AI PPT Maker
Templates
PPT Bundles
Design Services
Business PPTs
Business Plan
Management
Strategy
Introduction PPT
Roadmap
Self Introduction
Timelines
Process
Marketing
Agenda
Technology
Medical
Startup Business Plan
Cyber Security
Dashboards
SWOT
Proposals
Education
Pitch Deck
Digital Marketing
KPIs
Project Management
Product Management
Artificial Intelligence
Target Market
Communication
Supply Chain
Google Slides
Research Services
 One Pagers
All Categories
-
Home
- Customer Favorites
- Cost Analysis Dashboard
Cost Analysis Dashboard

Common Conflict Situations Kpi Metrics Dashboard Post Resolving Workplace Information PDF
The purpose of this slide is to outline key performance indicator KPI dashboard showcasing the results post resolving organizational conflicts. The metrics covered in this slide are conflicts by departments, conflicts logged by gender etc. The Common Conflict Situations Kpi Metrics Dashboard Post Resolving Workplace Information PDF is a compilation of the most recent design trends as a series of slides. It is suitable for any subject or industry presentation, containing attractive visuals and photo spots for businesses to clearly express their messages. This template contains a variety of slides for the user to input data, such as structures to contrast two elements, bullet points, and slides for written information. Slidegeeks is prepared to create an impression.
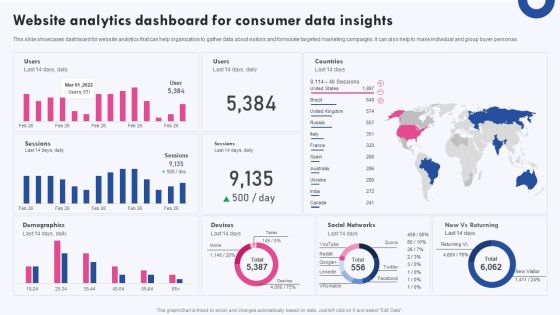
Targeted Marketing Campaigns To Improve Buyers Experience Website Analytics Dashboard For Consumer Infographics PDF
This slide showcases dashboard for website analytics that can help organization to gather data about visitors and formulate targeted marketing campaigns. It can also help to make individual and group buyer personas This modern and well arranged Targeted Marketing Campaigns To Improve Buyers Experience Website Analytics Dashboard For Consumer Infographics PDF provides lots of creative possibilities. It is very simple to customize and edit with the Powerpoint Software. Just drag and drop your pictures into the shapes. All facets of this template can be edited with Powerpoint no extra software is necessary. Add your own material, put your images in the places assigned for them, adjust the colors, and then you can show your slides to the world, with an animated slide included.

Metric Dashboard To Track Product Success Product Development And Management Plan Portrait PDF
This slide represents product development timeline. It covers gathering resources, strategy development, performance validation, prototyping etc.If you are looking for a format to display your unique thoughts, then the professionally designed Metric Dashboard To Track Product Success Product Development And Management Plan Portrait PDF is the one for you. You can use it as a Google Slides template or a PowerPoint template. Incorporate impressive visuals, symbols, images, and other charts. Modify or reorganize the text boxes as you desire. Experiment with shade schemes and font pairings. Alter, share or cooperate with other people on your work. Download Metric Dashboard To Track Product Success Product Development And Management Plan Portrait PDF and find out how to give a successful presentation. Present a perfect display to your team and make your presentation unforgettable.
Procurement Automation Strategy End To End Process Tracking Dashboard On Cloud Icons PDF
This slide covers tool for analysing end to end procurement process. It includes features such as tracking real- time overall business health, checking quotation to order conversion, automated notifications and payments reminders, etc. If you are looking for a format to display your unique thoughts, then the professionally designed Procurement Automation Strategy End To End Process Tracking Dashboard On Cloud Icons PDF is the one for you. You can use it as a Google Slides template or a PowerPoint template. Incorporate impressive visuals, symbols, images, and other charts. Modify or reorganize the text boxes as you desire. Experiment with shade schemes and font pairings. Alter, share or cooperate with other people on your work. Download Procurement Automation Strategy End To End Process Tracking Dashboard On Cloud Icons PDF and find out how to give a successful presentation. Present a perfect display to your team and make your presentation unforgettable.

Project Management Dashboard To Measure Performance Strategies To Enhance Project Lifecycle Themes PDF
This slide covers the project management dashboard which includes status of project phases such as planning, designing, development and testing that also focuses on launch date of project, overdue tasks with date, deadline, etc. And workload on employees.Slidegeeks is here to make your presentations a breeze with Project Management Dashboard To Measure Performance Strategies To Enhance Project Lifecycle Themes PDF With our easy-to-use and customizable templates, you can focus on delivering your ideas rather than worrying about formatting. With a variety of designs to choose from, you are sure to find one that suits your needs. And with animations and unique photos, illustrations, and fonts, you can make your presentation pop. So whether you are giving a sales pitch or presenting to the board, make sure to check out Slidegeeks first.

Dashboard For Dual Branding Campaign Performance Dual Branding Campaign For Product Promotion Portrait PDF
This slide showcases dashboard that can help organization to measure performance after launching dual branding campaign. Its key components are sales comparison, revenue by client, revenue by source and new customers by source.Slidegeeks is here to make your presentations a breeze with Dashboard For Dual Branding Campaign Performance Dual Branding Campaign For Product Promotion Portrait PDF With our easy-to-use and customizable templates, you can focus on delivering your ideas rather than worrying about formatting. With a variety of designs to choose from, you are sure to find one that suits your needs. And with animations and unique photos, illustrations, and fonts, you can make your presentation pop. So whether you are giving a sales pitch or presenting to the board, make sure to check out Slidegeeks first.
Operational Risk Assessment And Management Plan Enterprise Cyber Risk Management Dashboard Icons PDF
This slide represents dashboard representing details related to management of strategic risks in the organization. It includes details related to risk rating breakdown, risk heat map, top 5 vulnerabilities etc. Slidegeeks is here to make your presentations a breeze with Operational Risk Assessment And Management Plan Enterprise Cyber Risk Management Dashboard Icons PDF With our easy-to-use and customizable templates, you can focus on delivering your ideas rather than worrying about formatting. With a variety of designs to choose from, you are sure to find one that suits your needs. And with animations and unique photos, illustrations, and fonts, you can make your presentation pop. So whether you are giving a sales pitch or presenting to the board, make sure to check out Slidegeeks first.

Strategic Guide To Perform Marketing Marketing Campaign Performance Management Dashboard Diagrams PDF
This slide presents a dashboard ti track and measure performance of marketing campaign for effective decision making. It provides information about bounce rate, new users, users, average session duration, page performance, page path, average time on page, goal conversion rate and goal completions. Slidegeeks is here to make your presentations a breeze with Strategic Guide To Perform Marketing Marketing Campaign Performance Management Dashboard Diagrams PDF With our easy to use and customizable templates, you can focus on delivering your ideas rather than worrying about formatting. With a variety of designs to choose from, youre sure to find one that suits your needs. And with animations and unique photos, illustrations, and fonts, you can make your presentation pop. So whether youre giving a sales pitch or presenting to the board, make sure to check out Slidegeeks first.
Playbook For Sprint Agile Tracking User Stories Across Agile Project Development Dashboard Clipart PDF
This slide provides information regarding dashboard for tracking user stories across agile project development including work items, etc. Slidegeeks is here to make your presentations a breeze with Playbook For Sprint Agile Tracking User Stories Across Agile Project Development Dashboard Clipart PDF With our easy to use and customizable templates, you can focus on delivering your ideas rather than worrying about formatting. With a variety of designs to choose from, you are sure to find one that suits your needs. And with animations and unique photos, illustrations, and fonts, you can make your presentation pop. So whether you are giving a sales pitch or presenting to the board, make sure to check out Slidegeeks first.
Streamlining Manufacturing Processes With Workflow Automation Dashboard For Monthly Procurement Process Automated Workflow Icons PDF
This slide presents a dashboard for monthly procurement activities in an organization. It includes number of suppliers, contract attainted, supplier share, top supplier report, average procurement cycle time, etc. Slidegeeks is here to make your presentations a breeze with Streamlining Manufacturing Processes With Workflow Automation Dashboard For Monthly Procurement Process Automated Workflow Icons PDF With our easy-to-use and customizable templates, you can focus on delivering your ideas rather than worrying about formatting. With a variety of designs to choose from, you are sure to find one that suits your needs. And with animations and unique photos, illustrations, and fonts, you can make your presentation pop. So whether you are giving a sales pitch or presenting to the board, make sure to check out Slidegeeks first

Billing Software Dashboard To Track Company Performance Ppt PowerPoint Presentation File Professional PDF
Following slide shows billing software dashboard to track company financial performance. It includes elements such as average revenue, activity record of payments, invoice summary, income and expenditures. Slidegeeks is here to make your presentations a breeze with Billing Software Dashboard To Track Company Performance Ppt PowerPoint Presentation File Professional PDF With our easy to use and customizable templates, you can focus on delivering your ideas rather than worrying about formatting. With a variety of designs to choose from, you are sure to find one that suits your needs. And with animations and unique photos, illustrations, and fonts, you can make your presentation pop. So whether you are giving a sales pitch or presenting to the board, make sure to check out Slidegeeks first.
Go Viral Campaign Strategies To Increase Engagement Dashboard For Tracking Viral Posts Across Digital Professional PDF
This slide showcases dashboard which can help marketers track viral posts across multiple platforms. It provides details about viral views, seed views, direct, searh, referrer, network, Facebook, Twitter, etc. Slidegeeks is here to make your presentations a breeze with Go Viral Campaign Strategies To Increase Engagement Dashboard For Tracking Viral Posts Across Digital Professional PDF With our easy to use and customizable templates, you can focus on delivering your ideas rather than worrying about formatting. With a variety of designs to choose from, you are sure to find one that suits your needs. And with animations and unique photos, illustrations, and fonts, you can make your presentation pop. So whether you are giving a sales pitch or presenting to the board, make sure to check out Slidegeeks first.

Dashboard To Track Essential Activities Associated With IT Department Microsoft PDF
This slide provides information regarding dashboard to monitor critical activities related to IT in terms of incident tracker, outage report, IT spend per employee, application trends, etc. Slidegeeks is here to make your presentations a breeze with Dashboard To Track Essential Activities Associated With IT Department Microsoft PDF With our easy-to-use and customizable templates, you can focus on delivering your ideas rather than worrying about formatting. With a variety of designs to choose from, you are sure to find one that suits your needs. And with animations and unique photos, illustrations, and fonts, you can make your presentation pop. So whether you are giving a sales pitch or presenting to the board, make sure to check out Slidegeeks first

SLA KPL Dashboard Indicating Top Week Performers Ppt Infographics Examples PDF
This graph or chart is linked to excel, and changes automatically based on data. Just left click on it and select Edit Data. Showcasing this set of slides titled SLA KPL Dashboard Indicating Top Week Performers Ppt Infographics Examples PDF. The topics addressed in these templates are Active Slas Risk, Active Slas Breached, Active Slas. All the content presented in this PPT design is completely editable. Download it and make adjustments in color, background, font etc. as per your unique business setting.

Kpi Dashboard To Track Safety Program Performance Construction Site Safety Plan Summary PDF
This slide reflects the key performance indicator dashboard to track the performance of safety program. It includes information regarding the total manpower, manhours, unsafe conditions, lost time injuries frequency, injuries severity rate, along with the training hours. The Kpi Dashboard To Track Safety Program Performance Construction Site Safety Plan Summary PDF is a compilation of the most recent design trends as a series of slides. It is suitable for any subject or industry presentation, containing attractive visuals and photo spots for businesses to clearly express their messages. This template contains a variety of slides for the user to input data, such as structures to contrast two elements, bullet points, and slides for written information. Slidegeeks is prepared to create an impression.

Measuring Net Retention And Revenue Churn With Kpi Dashboard Ideas PDF
Mentioned slide outlines a comprehensive dashboard outlining the results of customer churn prevention strategies. The key performance indicators KPIs covered in the slide are net promoter score NPS, loyal customer rate, customer lifetime value CLV, revenue churn, net retention rate, etc. The Measuring Net Retention And Revenue Churn With Kpi Dashboard Ideas PDF is a compilation of the most recent design trends as a series of slides. It is suitable for any subject or industry presentation, containing attractive visuals and photo spots for businesses to clearly express their messages. This template contains a variety of slides for the user to input data, such as structures to contrast two elements, bullet points, and slides for written information. Slidegeeks is prepared to create an impression.

KPI Dashboard To Measure Effectiveness Of Real Estate Marketing Strategies Inspiration PDF
The following slide outlines performance key performance indicator KPI dashboard that can assist marketers to evaluate online and offline real estate promotional techniques performance. The metrics covered are quarterly sales, deals won, expired contracts, revenue, conversion rates, etc. Coming up with a presentation necessitates that the majority of the effort goes into the content and the message you intend to convey. The visuals of a PowerPoint presentation can only be effective if it supplements and supports the story that is being told. Keeping this in mind our experts created KPI Dashboard To Measure Effectiveness Of Real Estate Marketing Strategies Inspiration PDF to reduce the time that goes into designing the presentation. This way, you can concentrate on the message while our designers take care of providing you with the right template for the situation.

AI Deployment In IT Process Aiops Dashboard To Monitor IT Operations Infographics PDF
The following slide highlights the various key performance indicators of the AIOp, these can be problem quick review, cloud and infrastructure and applications health. If you are looking for a format to display your unique thoughts, then the professionally designed AI Deployment In IT Process Aiops Dashboard To Monitor IT Operations Infographics PDF is the one for you. You can use it as a Google Slides template or a PowerPoint template. Incorporate impressive visuals, symbols, images, and other charts. Modify or reorganize the text boxes as you desire. Experiment with shade schemes and font pairings. Alter, share or cooperate with other people on your work. Download AI Deployment In IT Process Aiops Dashboard To Monitor IT Operations Infographics PDF and find out how to give a successful presentation. Present a perfect display to your team and make your presentation unforgettable.

Playbook For Sales Growth Strategies Digital Marketing Dashboard For Organic Growth Designs PDF
This graph or chart is linked to excel, and changes automatically based on data. Just left click on it and select Edit Data. Deliver and pitch your topic in the best possible manner with this Playbook For Sales Growth Strategies Digital Marketing Dashboard For Organic Growth Designs PDF. Use them to share invaluable insights on Unique Visitors, Sessions, Bounce Rate and impress your audience. This template can be altered and modified as per your expectations. So, grab it now.
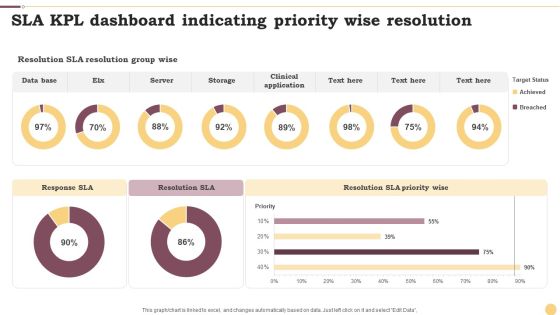
SLA KPL Dashboard Indicating Priority Wise Resolution Ppt Infographics Example File PDF
This graph or chart is linked to excel, and changes automatically based on data. Just left click on it and select Edit Data. Pitch your topic with ease and precision using this SLA KPL Dashboard Indicating Priority Wise Resolution Ppt Infographics Example File PDF. This layout presents information on Data Base, Server, Storage. It is also available for immediate download and adjustment. So, changes can be made in the color, design, graphics or any other component to create a unique layout.
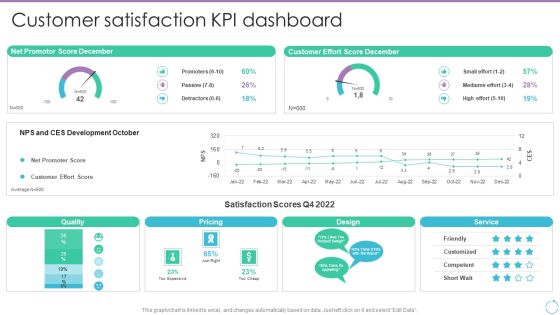
Personal Branding Plan For Executives Customer Satisfaction KPI Dashboard Graphics PDF
This graph or chart is linked to excel, and changes automatically based on data. Just left click on it and select Edit Data. Whether you have daily or monthly meetings, a brilliant presentation is necessary. Personal Branding Plan For Executives Customer Satisfaction KPI Dashboard Graphics PDF can be your best option for delivering a presentation. Represent everything in detail using Personal Branding Plan For Executives Customer Satisfaction KPI Dashboard Graphics PDF and make yourself stand out in meetings. The template is versatile and follows a structure that will cater to your requirements. All the templates prepared by Slidegeeks are easy to download and edit. Our research experts have taken care of the corporate themes as well. So, give it a try and see the results.

Workforce Appraisal Status Monitoring Kpi Dashboard Employee Performance Management Rules PDF
The following slide covers the management by objective MBO methodology to assess employee performance. It includes key elements such as details, advantages, disadvantages, best fit for etc. along with process workflow.Get a simple yet stunning designed Workforce Appraisal Status Monitoring Kpi Dashboard Employee Performance Management Rules PDF. It is the best one to establish the tone in your meetings. It is an excellent way to make your presentations highly effective. So, download this PPT today from Slidegeeks and see the positive impacts. Our easy-to-edit Workforce Appraisal Status Monitoring Kpi Dashboard Employee Performance Management Rules PDF can be your go-to option for all upcoming conferences and meetings. So, what are you waiting for Grab this template today.

Implementing Digital Transformation Kpi Dashboard To Track Digital Transformation Initiatives Structure PDF
Following slide provides dashboard that can be used by the businesses to measure the performance of digital transformation initiatives with the help of different KPIs. KPIs covered are social presence, click through rate, sales revenue, churn amount etc. The Implementing Digital Transformation Kpi Dashboard To Track Digital Transformation Initiatives Structure PDF is a compilation of the most recent design trends as a series of slides. It is suitable for any subject or industry presentation, containing attractive visuals and photo spots for businesses to clearly express their messages. This template contains a variety of slides for the user to input data, such as structures to contrast two elements, bullet points, and slides for written information. Slidegeeks is prepared to create an impression.
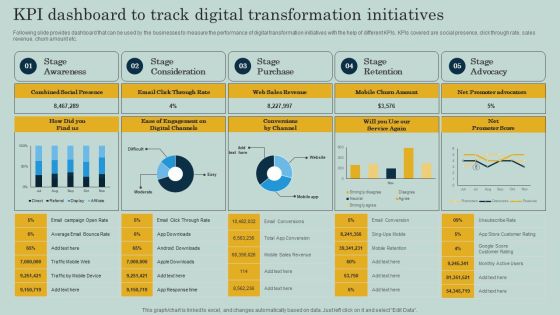
KPI Dashboard To Track Digital Transformation Initiatives Ppt Show Backgrounds PDF
Following slide provides dashboard that can be used by the businesses to measure the performance of digital transformation initiatives with the help of different KPIs. KPIs covered are social presence, click through rate, sales revenue, churn amount etc. The KPI Dashboard To Track Digital Transformation Initiatives Ppt Show Backgrounds PDF is a compilation of the most recent design trends as a series of slides. It is suitable for any subject or industry presentation, containing attractive visuals and photo spots for businesses to clearly express their messages. This template contains a variety of slides for the user to input data, such as structures to contrast two elements, bullet points, and slides for written information. Slidegeeks is prepared to create an impression.

Cyber Risks And Incident Response Playbook Real Time Incident Management Dashboard Guidelines PDF
Following slide illustrate KPI dashboard that can be used by organizations to track real time incident data. KPIs covered are number of tickets, average resolution time per customer, incidents registered per month. This Cyber Risks And Incident Response Playbook Real Time Incident Management Dashboard Guidelines PDF from Slidegeeks makes it easy to present information on your topic with precision. It provides customization options, so you can make changes to the colors, design, graphics, or any other component to create a unique layout. It is also available for immediate download, so you can begin using it right away. Slidegeeks has done good research to ensure that you have everything you need to make your presentation stand out. Make a name out there for a brilliant performance.

Workforce Security Realization Coaching Plan Organization Cyber Security Dashboard Template PDF
This slide covers the cyber security key performance indicators for the organization including application health, device license consumption, data encryption status and many more. Deliver an awe-inspiring pitch with this creative workforce security realization coaching plan organization cyber security dashboard template pdf bundle. Topics like makes and models, operating systems, encryption status, application health, license consumption can be discussed with this completely editable template. It is available for immediate download depending on the needs and requirements of the user.
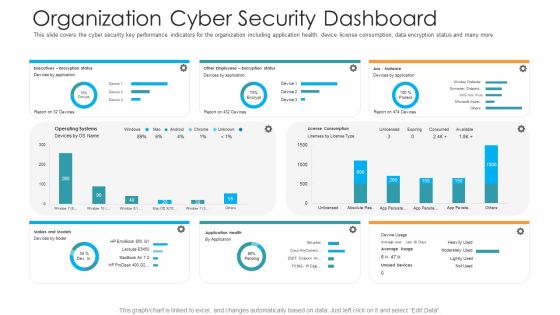
Organization Cyber Security Dashboard Hacking Prevention Awareness Training For IT Security Professional PDF
This slide covers the cyber security key performance indicators for the organization including application health, device license consumption, data encryption status and many more. Deliver and pitch your topic in the best possible manner with this organization cyber security dashboard hacking prevention awareness training for it security professional pdf. Use them to share invaluable insights on executives, license consumption, operating systems and impress your audience. This template can be altered and modified as per your expectations. So, grab it now.

Aiops Dashboard To Monitor IT Operations Aiops Integration Summary Report Clipart PDF
The following slide highlights the various key performance indicators of the AIOp, these can be problem quick review, cloud and infrastructure and applications health. If you are looking for a format to display your unique thoughts, then the professionally designed Aiops Dashboard To Monitor IT Operations Aiops Integration Summary Report Clipart PDF is the one for you. You can use it as a Google Slides template or a PowerPoint template. Incorporate impressive visuals, symbols, images, and other charts. Modify or reorganize the text boxes as you desire. Experiment with shade schemes and font pairings. Alter, share or cooperate with other people on your work. Download Aiops Dashboard To Monitor IT Operations Aiops Integration Summary Report Clipart PDF and find out how to give a successful presentation. Present a perfect display to your team and make your presentation unforgettable.

Operational Strategy For ML In IT Sector Aiops Dashboard To Monitor IT Operations Diagrams PDF
The following slide highlights the various key performance indicators of the AIOps, these can be problem quick review, cloud and infrastructure and applications health If you are looking for a format to display your unique thoughts, then the professionally designed Operational Strategy For ML In IT Sector Aiops Dashboard To Monitor IT Operations Diagrams PDF is the one for you. You can use it as a Google Slides template or a PowerPoint template. Incorporate impressive visuals, symbols, images, and other charts. Modify or reorganize the text boxes as you desire. Experiment with shade schemes and font pairings. Alter, share or cooperate with other people on your work. Download Operational Strategy For ML In IT Sector Aiops Dashboard To Monitor IT Operations Diagrams PDF and find out how to give a successful presentation. Present a perfect display to your team and make your presentation unforgettable.

Security Monitoring Dashboard With Application Control And Operating System Statistics Template PDF
This graph or chart is linked to excel, and changes automatically based on data. Just left click on it and select Edit Data. Deliver and pitch your topic in the best possible manner with this security monitoring dashboard with application control and operating system statistics template pdf. Use them to share invaluable insights on application control, restrict office macros, application patching, application hardening and impress your audience. This template can be altered and modified as per your expectations. So, grab it now.
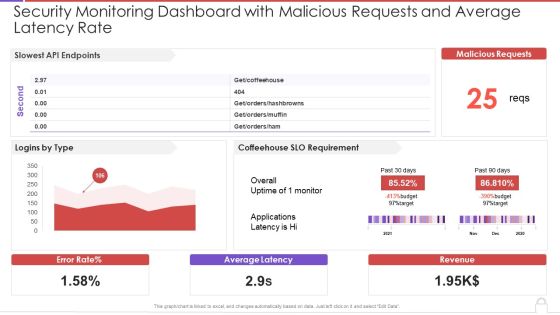
Security Monitoring Dashboard With Malicious Requests And Average Latency Rate Topics PDF
This graph or chart is linked to excel, and changes automatically based on data. Just left click on it and select Edit Data. Deliver an awe inspiring pitch with this creative security monitoring dashboard with malicious requests and average latency rate topics pdf bundle. Topics like slowest api endpoints, malicious requests, coffeehouse slo can be discussed with this completely editable template. It is available for immediate download depending on the needs and requirements of the user.
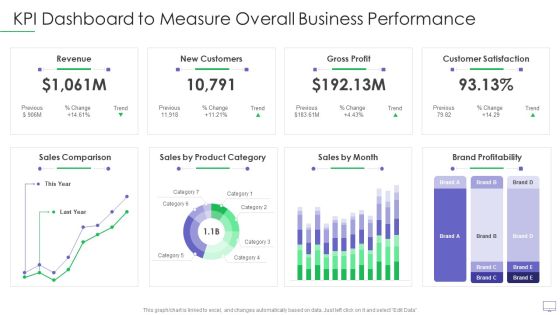
Guide For Software Developers KPI Dashboard To Measure Overall Business Performance Elements PDF
This graph or chart is linked to excel, and changes automatically based on data. Just left click on it and select Edit Data. Deliver an awe inspiring pitch with this creative guide for software developers kpi dashboard to measure overall business performance elements pdf bundle. Topics like revenue new customers, gross profit, customer satisfaction, sales comparison, brand profitability can be discussed with this completely editable template. It is available for immediate download depending on the needs and requirements of the user.
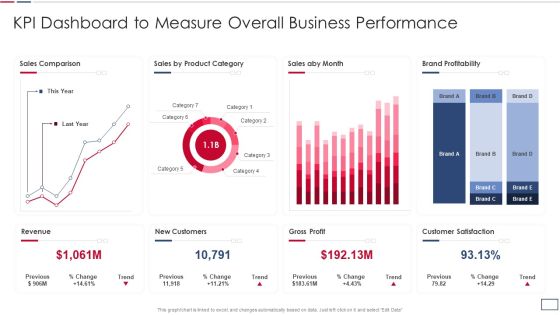
Software Developer Playbook Kpi Dashboard To Measure Overall Business Performance Topics PDF
This graph or chart is linked to excel, and changes automatically based on data. Just left click on it and select Edit Data. Deliver and pitch your topic in the best possible manner with this software developer playbook kpi dashboard to measure overall business performance topics pdf. Use them to share invaluable insights on revenue new customers, gross profit, customer satisfaction, sales comparison and impress your audience. This template can be altered and modified as per your expectations. So, grab it now.

Call Center Client Helpline Dashboard Status Ppt Show Graphics Design PDF
This graph or chart is linked to excel, and changes automatically based on data. Just left click on it and select Edit Data. Showcasing this set of slides titled Call Center Client Helpline Dashboard Status Ppt Show Graphics Design PDF. The topics addressed in these templates are Call Monitor, Active Calls, Abandoned, Agents Ready. All the content presented in this PPT design is completely editable. Download it and make adjustments in color, background, font etc. as per your unique business setting.

Client Helpline Dashboard With Average Talk Time Distribution Ppt Gallery Backgrounds PDF
This graph or chart is linked to excel, and changes automatically based on data. Just left click on it and select Edit Data. Showcasing this set of slides titled Client Helpline Dashboard With Average Talk Time Distribution Ppt Gallery Backgrounds PDF. The topics addressed in these templates are External Incoming Call, Occupancy, Break Time, Sales. All the content presented in this PPT design is completely editable. Download it and make adjustments in color, background, font etc. as per your unique business setting.

Client Helpline Dashboard With Product Customer Satisfaction Ppt Slides Graphics Template PDF
This graph or chart is linked to excel, and changes automatically based on data. Just left click on it and select Edit Data. Pitch your topic with ease and precision using this Client Helpline Dashboard With Product Customer Satisfaction Ppt Slides Graphics Template PDF. This layout presents information on Customer Satisfaction, Product, Compare. It is also available for immediate download and adjustment. So, changes can be made in the color, design, graphics or any other component to create a unique layout.

Client Helpline Dashboard With Resolution And Response Rate Ppt File Example Topics PDF
This graph or chart is linked to excel, and changes automatically based on data. Just left click on it and select Edit Data. Showcasing this set of slides titled Client Helpline Dashboard With Resolution And Response Rate Ppt File Example Topics PDF. The topics addressed in these templates are Resolutions, Response Time, Response Time Weekday. All the content presented in this PPT design is completely editable. Download it and make adjustments in color, background, font etc. as per your unique business setting.

Client Helpline Dashboard With Ticket Resolution Ppt Model Graphics Design PDF
This graph or chart is linked to excel, and changes automatically based on data. Just left click on it and select Edit Data. Pitch your topic with ease and precision using this Client Helpline Dashboard With Ticket Resolution Ppt Model Graphics Design PDF. This layout presents information on Ticket Due Times, Sourcewise Tickets, Open Tickets. It is also available for immediate download and adjustment. So, changes can be made in the color, design, graphics or any other component to create a unique layout.

Help Desk Call Centre Service Level Agreement KPI Dashboard Pictures PDF
This graph or chart is linked to excel, and changes automatically based on data. Just left click on it and select Edit Data. Showcasing this set of slides titled Help Desk Call Centre Service Level Agreement KPI Dashboard Pictures PDF. The topics addressed in these templates are Call Type Today, Occupancy Today, Call Summary Today. All the content presented in this PPT design is completely editable. Download it and make adjustments in color, background, font etc. as per your unique business setting.
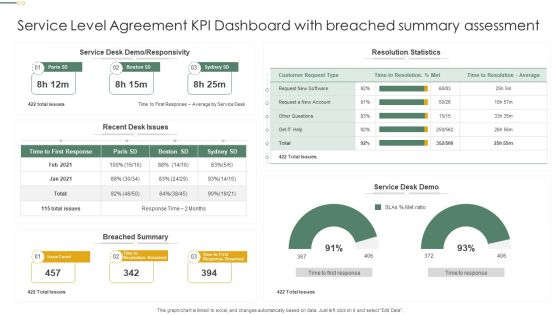
Service Level Agreement KPI Dashboard With Breached Summary Assessment Professional PDF
This graph or chart is linked to excel, and changes automatically based on data. Just left click on it and select Edit Data. Pitch your topic with ease and precision using this Service Level Agreement KPI Dashboard With Breached Summary Assessment Professional PDF. This layout presents information on Resolution Statistics, Service Desk Demo, Breached Summary. It is also available for immediate download and adjustment. So, changes can be made in the color, design, graphics or any other component to create a unique layout.
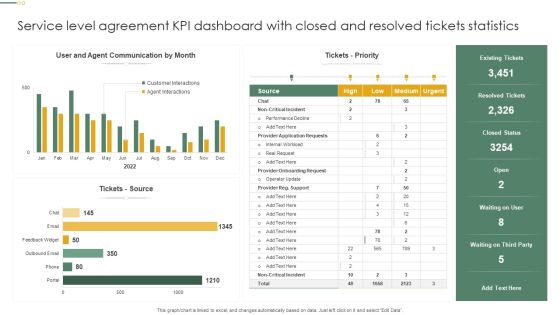
Service Level Agreement KPI Dashboard With Closed And Resolved Tickets Statistics Inspiration PDF
This graph or chart is linked to excel, and changes automatically based on data. Just left click on it and select Edit Data. Showcasing this set of slides titled Service Level Agreement KPI Dashboard With Closed And Resolved Tickets Statistics Inspiration PDF. The topics addressed in these templates are Tickets Priority, Tickets Source, Resolved Tickets. All the content presented in this PPT design is completely editable. Download it and make adjustments in color, background, font etc. as per your unique business setting.
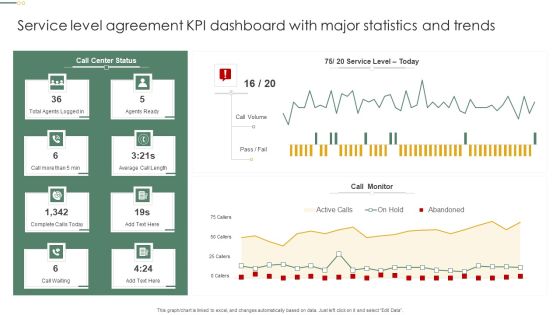
Service Level Agreement KPI Dashboard With Major Statistics And Trends Pictures PDF
This graph or chart is linked to excel, and changes automatically based on data. Just left click on it and select Edit Data. Pitch your topic with ease and precision using this Service Level Agreement KPI Dashboard With Major Statistics And Trends Pictures PDF. This layout presents information on Call Monitor, Call Volume, Agents Ready. It is also available for immediate download and adjustment. So, changes can be made in the color, design, graphics or any other component to create a unique layout.
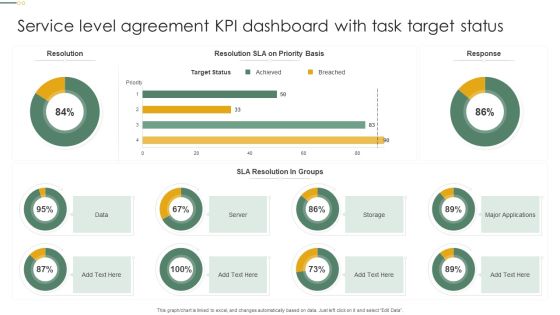
Service Level Agreement KPI Dashboard With Task Target Status Microsoft PDF
This graph or chart is linked to excel, and changes automatically based on data. Just left click on it and select Edit Data. Pitch your topic with ease and precision using this Service Level Agreement KPI Dashboard With Task Target Status Microsoft PDF. This layout presents information on Target Status, Sla Resolution, Groups, Server. It is also available for immediate download and adjustment. So, changes can be made in the color, design, graphics or any other component to create a unique layout.

Helpdesk SLA KPL Dashboard Illustrating Calls Details Ppt Slides Show PDF
This graph or chart is linked to excel, and changes automatically based on data. Just left click on it and select Edit Data. Showcasing this set of slides titled Helpdesk SLA KPL Dashboard Illustrating Calls Details Ppt Slides Show PDF. The topics addressed in these templates are Call Type Today, Trunk Utilization Today, Call Summery Today. All the content presented in this PPT design is completely editable. Download it and make adjustments in color, background, font etc. as per your unique business setting.

Service SLA KPL Changes And Incidents Dashboard Ppt Inspiration Infographics PDF
This graph or chart is linked to excel, and changes automatically based on data. Just left click on it and select Edit Data. Pitch your topic with ease and precision using this Service SLA KPL Changes And Incidents Dashboard Ppt Inspiration Infographics PDF. This layout presents information on Time Spent Department, Incidents Closed, Operator Group. It is also available for immediate download and adjustment. So, changes can be made in the color, design, graphics or any other component to create a unique layout.

SLA KPL Dashboard Indicating Compliance Priority With KPI Ppt File Format PDF
This graph or chart is linked to excel, and changes automatically based on data. Just left click on it and select Edit Data. Showcasing this set of slides titled SLA KPL Dashboard Indicating Compliance Priority With KPI Ppt File Format PDF. The topics addressed in these templates are KPI Graph, Insights Here, SLA Compliance Priority. All the content presented in this PPT design is completely editable. Download it and make adjustments in color, background, font etc. as per your unique business setting.

SLA KPL Overview Dashboard Depicting Service Targets Ppt Slides Maker PDF
This graph or chart is linked to excel, and changes automatically based on data. Just left click on it and select Edit Data. Pitch your topic with ease and precision using this SLA KPL Overview Dashboard Depicting Service Targets Ppt Slides Maker PDF. This layout presents information on Monthly Trend, Service Target, Quarterly Trend. It is also available for immediate download and adjustment. So, changes can be made in the color, design, graphics or any other component to create a unique layout.

Dashboard For Tracking Customer Service Team Performance Consumer Contact Point Guide Diagrams PDF
This slide covers the KPI dashboard for analyzing the performance of client support department. It includes metrics such as first call resolution, unresolved calls, average response rate, the best day to call, average time to solve issues, etc. The Dashboard For Tracking Customer Service Team Performance Consumer Contact Point Guide Diagrams PDF is a compilation of the most recent design trends as a series of slides. It is suitable for any subject or industry presentation, containing attractive visuals and photo spots for businesses to clearly express their messages. This template contains a variety of slides for the user to input data, such as structures to contrast two elements, bullet points, and slides for written information. Slidegeeks is prepared to create an impression.

Dashboard For Tracking Brand Communication Campaign Results Executing Brand Communication Strategy Clipart PDF
This slide covers the dashboard for monitoring various audience segments. It includes metrics such as ad mentions, engagement, top occupation of the audience, top interest of the audience, age, language, etc. The Dashboard For Tracking Brand Communication Campaign Results Executing Brand Communication Strategy Clipart PDF is a compilation of the most recent design trends as a series of slides. It is suitable for any subject or industry presentation, containing attractive visuals and photo spots for businesses to clearly express their messages. This template contains a variety of slides for the user to input data, such as structures to contrast two elements, bullet points, and slides for written information. Slidegeeks is prepared to create an impression.

Dashboard For Tracking Business And IT Alignment Ppt PowerPoint Presentation File Background Images PDF
This slide depicts the dashboard for business and IT alignment by covering details of total sales, customer support service, percentage of business operations aligned IT, usage of communication channels, and top performer associates. The Dashboard For Tracking Business And IT Alignment Ppt PowerPoint Presentation File Background Images PDF is a compilation of the most recent design trends as a series of slides. It is suitable for any subject or industry presentation, containing attractive visuals and photo spots for businesses to clearly express their messages. This template contains a variety of slides for the user to input data, such as structures to contrast two elements, bullet points, and slides for written information. Slidegeeks is prepared to create an impression.
Inbound Lead Performance Tracking Dashboard Enhancing Client Lead Conversion Rates Structure PDF
This slide covers the KPI dashboard for evaluating inbound lead performance. It includes metrics such as lead to opportunity ratio, opportunity to win ratio, lead conversion ratio, inbound leads, and leads in the sales funnel. The Inbound Lead Performance Tracking Dashboard Enhancing Client Lead Conversion Rates Structure PDF is a compilation of the most recent design trends as a series of slides. It is suitable for any subject or industry presentation, containing attractive visuals and photo spots for businesses to clearly express their messages. This template contains a variety of slides for the user to input data, such as structures to contrast two elements, bullet points, and slides for written information. Slidegeeks is prepared to create an impression.
Inbound Lead Performance Tracking Dashboard Improving Lead Generation Process Pictures PDF
This slide covers the KPI dashboard for evaluating inbound lead performance. It includes metrics such as lead to opportunity ratio, opportunity to win ratio, lead conversion ratio, inbound leads, and leads in the sales funnel. The Inbound Lead Performance Tracking Dashboard Improving Lead Generation Process Pictures PDF is a compilation of the most recent design trends as a series of slides. It is suitable for any subject or industry presentation, containing attractive visuals and photo spots for businesses to clearly express their messages. This template contains a variety of slides for the user to input data, such as structures to contrast two elements, bullet points, and slides for written information. Slidegeeks is prepared to create an impression.

Dashboard To Measure Performance Of Social Media Marketing Strategies Grid PDF
This following slide displays the key metrics that can help an organization to measure effectiveness of social media strategies. These can be leads generated, leads by region, web traffic targets etc. Find highly impressive Dashboard To Measure Performance Of Social Media Marketing Strategies Grid PDF on Slidegeeks to deliver a meaningful presentation. You can save an ample amount of time using these presentation templates. No need to worry to prepare everything from scratch because Slidegeeks experts have already done a huge research and work for you. You need to download Dashboard To Measure Performance Of Social Media Marketing Strategies Grid PDF for your upcoming presentation. All the presentation templates are 100 percent editable and you can change the color and personalize the content accordingly. Download now.

Consumer Lead Generation Process Enhanced Lead Performance Tracking Dashboard Portrait PDF
This slide covers the KPI dashboard for tracking improved lead management system performance. It includes metrics such as visitors, social media followers, email subscribers, organic leads, etc. Slidegeeks is here to make your presentations a breeze with Consumer Lead Generation Process Enhanced Lead Performance Tracking Dashboard Portrait PDF With our easy-to-use and customizable templates, you can focus on delivering your ideas rather than worrying about formatting. With a variety of designs to choose from, youre sure to find one that suits your needs. And with animations and unique photos, illustrations, and fonts, you can make your presentation pop. So whether youre giving a sales pitch or presenting to the board, make sure to check out Slidegeeks first.

Strategic Management Dashboard With Strategy Assessment Strategic Management For Competitive Portrait PDF
This slide showcases strategic management dashboard with technique assessment. It provides details about financial, customer, process, efficiency strategy, customer behavior, customer loyalty, customer feedbacks, marketing, suppliers, etc. Do you know about Slidesgeeks Strategic Management Dashboard With Strategy Assessment Strategic Management For Competitive Portrait PDF These are perfect for delivering any kind od presentation. Using it, create PowerPoint presentations that communicate your ideas and engage audiences. Save time and effort by using our pre-designed presentation templates that are perfect for a wide range of topic. Our vast selection of designs covers a range of styles, from creative to business, and are all highly customizable and easy to edit. Download as a PowerPoint template or use them as Google Slides themes.

Activity Management Customer Relationship Management Dashboard With Lead Status Portrait PDF
This slide illustrates graphical representation of activity management CRM statistical data. It includes sales team lead status, revenue meter, campaigns revenue graph. Showcasing this set of slides titled Activity Management Customer Relationship Management Dashboard With Lead Status Portrait PDF. The topics addressed in these templates are Sales Team Lead Status, Leads Sourced From Market. All the content presented in this PPT design is completely editable. Download it and make adjustments in color, background, font etc. as per your unique business setting.

Developing Brand Awareness To Gain Customer Attention Reputation Management Dashboard Infographics PDF
This slide provides information regarding reputation management to monitor brands status in terms of brand review summary, listing score, competition, listing accuracy, etc. Find highly impressive Developing Brand Awareness To Gain Customer Attention Reputation Management Dashboard Infographics PDF on Slidegeeks to deliver a meaningful presentation. You can save an ample amount of time using these presentation templates. No need to worry to prepare everything from scratch because Slidegeeks experts have already done a huge research and work for you. You need to download Developing Brand Awareness To Gain Customer Attention Reputation Management Dashboard Infographics PDF for your upcoming presentation. All the presentation templates are 100 Precent editable and you can change the color and personalize the content accordingly. Download now.

Dashboard To Track Brand Awareness Across Social Media Channels Brochure PDF
This slide provides information regarding brand awareness performance across various social media channels in terms of page reach, post impressions, etc. Explore a selection of the finest Dashboard To Track Brand Awareness Across Social Media Channels Brochure PDF here. With a plethora of professionally designed and pre-made slide templates, you can quickly and easily find the right one for your upcoming presentation. You can use our Dashboard To Track Brand Awareness Across Social Media Channels Brochure PDF to effectively convey your message to a wider audience. Slidegeeks has done a lot of research before preparing these presentation templates. The content can be personalized and the slides are highly editable. Grab templates today from Slidegeeks.

Digital Audit Dashboard Highlighting Website Visitors With Device And Social Networks Download PDF
This slide highlights the website visitors by different countries which also includes the users and session data from last 10 days, it also includes user demographic. Device and new vs returning user.Deliver an awe inspiring pitch with this creative Digital Audit Dashboard Highlighting Website Visitors With Device And Social Networks Download PDF bundle. Topics like Website Visitors, Social Networks can be discussed with this completely editable template. It is available for immediate download depending on the needs and requirements of the user.

Digital Audit Dashboard Highlighting Website Visitors With Device And Social Networks Themes PDF
This slide highlights the website visitors by different countries which also includes the users and session data from last 10 days, it also includes user demographic. Device and new vs returning user.Deliver an awe inspiring pitch with this creative Digital Audit Dashboard Highlighting Website Visitors With Device And Social Networks Themes PDF bundle. Topics like Visitors Country, Social Networks, Demographics can be discussed with this completely editable template. It is available for immediate download depending on the needs and requirements of the user.

Deployment Procedure Of Hyper Automation RPA And Hyper Automation Impact Dashboard For Healthcare Formats PDF
The following slide provides an overview of the impact of RPA and Hyper automation on healthcare , the provided highlights patients in and out time, patient data. There are so many reasons you need a Deployment Procedure Of Hyper Automation RPA And Hyper Automation Impact Dashboard For Healthcare Formats PDF. The first reason is you can not spend time making everything from scratch, Thus, Slidegeeks has made presentation templates for you too. You can easily download these templates from our website easily.

Agile Team Member Customer Relationship Management Dashboard With Deals Funnel Mockup PDF
This slide illustrates graphical representation of CRM sales team member data. It includes pipeline, business components and activity level, categories etc. Pitch your topic with ease and precision using this Agile Team Member Customer Relationship Management Dashboard With Deals Funnel Mockup PDF. This layout presents information on Funnel Of Deals, Sent Campaigns Emails, Sales Chart. It is also available for immediate download and adjustment. So, changes can be made in the color, design, graphics or any other component to create a unique layout.

Customer Relationship Management Salesperson Dashboard With Pipeline And Activity Level Designs PDF
This slide illustrates graphical representation of CRM sales team member data. It includes pipeline, business components and activity level, categories etc. Pitch your topic with ease and precision using this Customer Relationship Management Salesperson Dashboard With Pipeline And Activity Level Designs PDF. This layout presents information on Categories, Business Components, Team Member. It is also available for immediate download and adjustment. So, changes can be made in the color, design, graphics or any other component to create a unique layout.
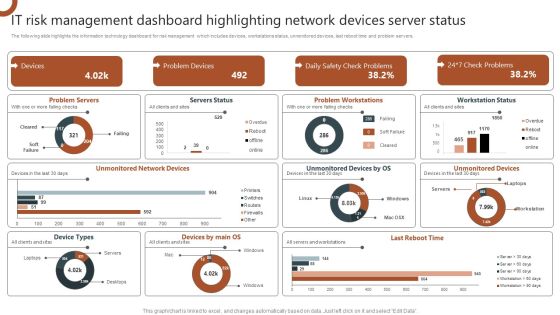
IT Risk Management Dashboard Highlighting Network Devices Server Status Pictures PDF
The following slide highlights the information technology dashboard for risk management which includes devices, workstations status, unmonitored devices, last reboot time and problem servers. Are you in need of a template that can accommodate all of your creative concepts This one is crafted professionally and can be altered to fit any style. Use it with Google Slides or PowerPoint. Include striking photographs, symbols, depictions, and other visuals. Fill, move around, or remove text boxes as desired. Test out color palettes and font mixtures. Edit and save your work, or work with colleagues. Download IT Risk Management Dashboard Highlighting Network Devices Server Status Pictures PDF and observe how to make your presentation outstanding. Give an impeccable presentation to your group and make your presentation unforgettable.

Help Desk Ticketing IT Service Desk Ticket Management System Dashboard Microsoft PDF
This slide illustrates information technology IT service desk management dashboard. It provides information about active incidents by state, service level management, applications, hardware, computers by site, customer satisfaction, etc. Welcome to our selection of the Help Desk Ticketing IT Service Desk Ticket Management System Dashboard Microsoft PDF. These are designed to help you showcase your creativity and bring your sphere to life. Planning and Innovation are essential for any business that is just starting out. This collection contains the designs that you need for your everyday presentations. All of our PowerPoints are 100 percent editable, so you can customize them to suit your needs. This multi-purpose template can be used in various situations. Grab these presentation templates today.

Implementing Advanced Service Help Desk Administration Program ITSM Ticketing Tool Dashboard With Activity Status Portrait PDF
This slide depicts information technology service management ITSM ticketing tool dashboard with activity status. It provides information about open tickets, closed tickets, requests, desktop support, alert level, completed tickets, etc. Are you in need of a template that can accommodate all of your creative concepts This one is crafted professionally and can be altered to fit any style. Use it with Google Slides or PowerPoint. Include striking photographs, symbols, depictions, and other visuals. Fill, move around, or remove text boxes as desired. Test out color palettes and font mixtures. Edit and save your work, or work with colleagues. Download Implementing Advanced Service Help Desk Administration Program ITSM Ticketing Tool Dashboard With Activity Status Portrait PDF and observe how to make your presentation outstanding. Give an impeccable presentation to your group and make your presentation unforgettable.

B2C Marketing Initiatives Strategies For Business RACE Digital Marketing Dashboard Ppt Infographic Template Objects PDF
This infographic is used to improve the digital marketing in the company by using the RACE framework model. Deliver an awe inspiring pitch with this creative B2C marketing initiatives strategies for business RACE digital marketing dashboard ppt infographic template objects pdf bundle. Topics like revenue, customer communications, inbound marketing, social referrals, conversion rate can be discussed with this completely editable template. It is available for immediate download depending on the needs and requirements of the user.

Investment Project KPI Dashboard Ppt PowerPoint Presentation Complete Deck With Slides
This Investment Project KPI Dashboard Ppt PowerPoint Presentation Complete Deck With Slides acts as backup support for your ideas, vision, thoughts, etc. Use it to present a thorough understanding of the topic. This PPT slideshow can be utilized for both in-house and outside presentations depending upon your needs and business demands. Entailing fourteen slides with a consistent design and theme, this template will make a solid use case. As it is intuitively designed, it suits every business vertical and industry. All you have to do is make a few tweaks in the content or any other component to design unique presentations. The biggest advantage of this complete deck is that it can be personalized multiple times once downloaded. The color, design, shapes, and other elements are free to modify to add personal touches. You can also insert your logo design in this PPT layout. Therefore a well-thought and crafted presentation can be delivered with ease and precision by downloading this Investment Project KPI Dashboard Ppt PowerPoint Presentation Complete Deck With Slides PPT slideshow.
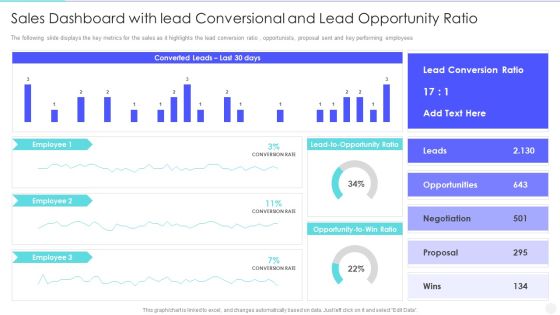
Increase Returns By Examining And Executing New Sales Qualification Procedure Sales Dashboard With Lead Themes PDF
The following slide displays the key metrics for the sales as it highlights the lead conversion ratio , opportunists, proposal sent and key performing employees. Deliver and pitch your topic in the best possible manner with this increase returns by examining and executing new sales qualification procedure sales dashboard with lead themes pdf. Use them to share invaluable insights on opportunities, negotiation, lead conversion ratio and impress your audience. This template can be altered and modified as per your expectations. So, grab it now.
Online Marketing Techniques Assessment Approach Content Performance Tracking Dashboard For Social Media Topics PDF
This Online Marketing Techniques Assessment Approach Content Performance Tracking Dashboard For Social Media Topics PDF from Slidegeeks makes it easy to present information on your topic with precision. It provides customization options, so you can make changes to the colors, design, graphics, or any other component to create a unique layout. It is also available for immediate download, so you can begin using it right away. Slidegeeks has done good research to ensure that you have everything you need to make your presentation stand out. Make a name out there for a brilliant performance.
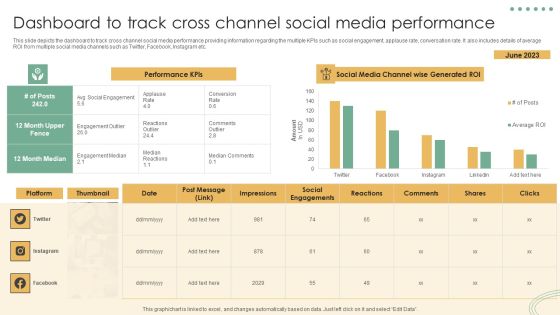
Online Marketing Techniques Assessment Approach Dashboard To Track Cross Channel Social Media Pictures PDF
Do you know about Slidesgeeks Online Marketing Techniques Assessment Approach Dashboard To Track Cross Channel Social Media Pictures PDF. These are perfect for delivering any kind od presentation. Using it, create PowerPoint presentations that communicate your ideas and engage audiences. Save time and effort by using our pre designed presentation templates that are perfect for a wide range of topic. Our vast selection of designs covers a range of styles, from creative to business, and are all highly customizable and easy to edit. Download as a PowerPoint template or use them as Google Slides themes.

Firm Marketing Dashboard Report With Closed Sales Ppt Slides Graphics Example PDF
This graph or chart is linked to excel, and changes automatically based on data. Just left click on it and select Edit Data. Showcasing this set of slides titled Firm Marketing Dashboard Report With Closed Sales Ppt Slides Graphics Example PDF. The topics addressed in these templates are Days On Market, Homes For Sale, Median Sales Price, Closed Sales. All the content presented in this PPT design is completely editable. Download it and make adjustments in color, background, font etc. as per your unique business setting.

Approach Optimization For Brand Promotion Strategy Dashboard Showing Digital Marketing Performance Introduction PDF
Slidegeeks is one of the best resources for PowerPoint templates. You can download easily and regulate Approach Optimization For Brand Promotion Strategy Dashboard Showing Digital Marketing Performance Introduction PDF for your personal presentations from our wonderful collection. A few clicks is all it takes to discover and get the most relevant and appropriate templates. Use our Templates to add a unique zing and appeal to your presentation and meetings. All the slides are easy to edit and you can use them even for advertisement purposes.

Finance Metrics Dashboard Indicating Account Receivable And Account Payable Demonstration PDF
This graph or chart is linked to excel, and changes automatically based on data. Just left click on it and select edit data. Showcasing this set of slides titled Finance Metrics Dashboard Indicating Account Receivable And Account Payable Demonstration PDF. The topics addressed in these templates are Total Accounts Receivable, Total Accounts Payable, Recommended Payment Timeline, Monthly Cash Flow. All the content presented in this PPT design is completely editable. Download it and make adjustments in color, background, font etc. as per your unique business setting.

Retail Marketing Campaign Effective Techniques Retail Marketing Campaign Analytics Dashboard Topics PDF
This slide shows the retail campaign performance highlighting the total product sales after implementing new strategies, total number of customers increased and number of new visitors in store. The best PPT templates are a great way to save time, energy, and resources. Slidegeeks have 100 percent editable powerpoint slides making them incredibly versatile. With these quality presentation templates, you can create a captivating and memorable presentation by combining visually appealing slides and effectively communicating your message. Download Retail Marketing Campaign Effective Techniques Retail Marketing Campaign Analytics Dashboard Topics PDF from Slidegeeks and deliver a wonderful presentation.

Project Data Quality Kpis Metrics Summary Dashboard With Threshold Guidelines PDF
This slide covers different KPIs to measure performance of data quality for project completion. It includes metric such as consistency, completeness, orderliness, timeliness, accuracy, auditability and uniqueness with thresholds. Pitch your topic with ease and precision using this Project Data Quality Kpis Metrics Summary Dashboard With Threshold Guidelines PDF. This layout presents information on Consistency, Completeness, Orderliness. It is also available for immediate download and adjustment. So, changes can be made in the color, design, graphics or any other component to create a unique layout.

Product And Services Promotion Marketing Performance Dashboard With Advertisement Graphics PDF
This graph or chart is linked to excel, and changes automatically based on data. Just left click on it and select Edit Data. Slidegeeks is here to make your presentations a breeze with Product And Services Promotion Marketing Performance Dashboard With Advertisement Graphics PDF With our easy-to-use and customizable templates, you can focus on delivering your ideas rather than worrying about formatting. With a variety of designs to choose from, youre sure to find one that suits your needs. And with animations and unique photos, illustrations, and fonts, you can make your presentation pop. So whether youre giving a sales pitch or presenting to the board, make sure to check out Slidegeeks first.

Approach Optimization For Brand Promotion Strategy Product Marketing Dashboard For Pay Per Click Campaign Brochure PDF
Coming up with a presentation necessitates that the majority of the effort goes into the content and the message you intend to convey. The visuals of a PowerPoint presentation can only be effective if it supplements and supports the story that is being told. Keeping this in mind our experts created Approach Optimization For Brand Promotion Strategy Product Marketing Dashboard For Pay Per Click Campaign Brochure PDF to reduce the time that goes into designing the presentation. This way, you can concentrate on the message while our designers take care of providing you with the right template for the situation.
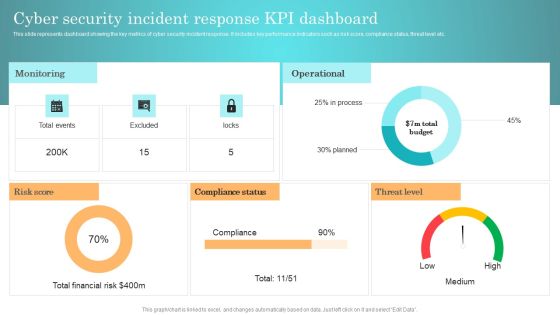
Incident Response Techniques Deployement Cyber Security Incident Response KPI Dashboard Background PDF
This slide represents dashboard showing the key metrics of cyber security incident response. It includes key performance indicators such as risk score, compliance status, threat level etc. From laying roadmaps to briefing everything in detail, our templates are perfect for you. You can set the stage with your presentation slides. All you have to do is download these easy to edit and customizable templates. Incident Response Techniques Deployement Cyber Security Incident Handler Contact Information Guidelines PDF will help you deliver an outstanding performance that everyone would remember and praise you for. Do download this presentation today.

Online Marketing Techniques For Acquiring Clients Dashboard To Measure Performance Information PDF
This following slide displays the key metrics that can help an organization to measure effectiveness of social media strategies. These can be leads generated, leads by region, web traffic targets etc. Take your projects to the next level with our ultimate collection of Online Marketing Techniques For Acquiring Clients Dashboard To Measure Performance Information PDF. Slidegeeks has designed a range of layouts that are perfect for representing task or activity duration, keeping track of all your deadlines at a glance. Tailor these designs to your exact needs and give them a truly corporate look with your own brand colors they will make your projects stand out from the rest.
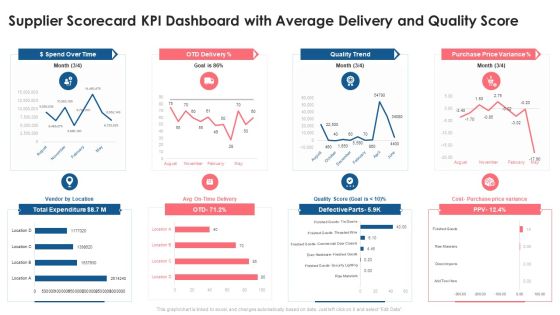
Supplier Scorecard Supplier Scorecard KPI Dashboard With Average Delivery And Quality Score Introduction PDF
This graph or chart is linked to excel, and changes automatically based on data. Just left click on it and select Edit Data. Deliver an awe inspiring pitch with this creative supplier scorecard supplier scorecard kpi dashboard with average delivery and quality score introduction pdf bundle. Topics like dollar spend over time, otd delivery, quality trend, purchase price variance, total expenditure can be discussed with this completely editable template. It is available for immediate download depending on the needs and requirements of the user.
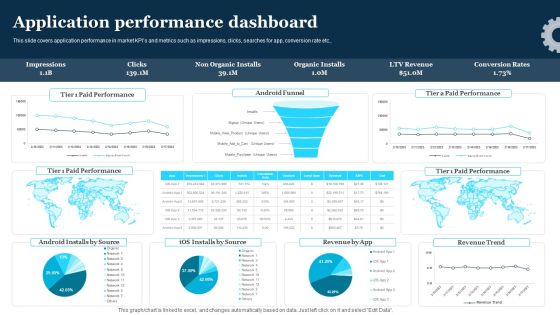
Play Store Launch Techniques For Shopping Apps Application Performance Dashboard Template PDF
This slide covers application performance in market KPIs and metrics such as impressions, clicks, searches for app, conversion rate etc., Present like a pro with Play Store Launch Techniques For Shopping Apps Application Performance Dashboard Template PDF Create beautiful presentations together with your team, using our easy to use presentation slides. Share your ideas in real time and make changes on the fly by downloading our templates. So whether you are in the office, on the go, or in a remote location, you can stay in sync with your team and present your ideas with confidence. With Slidegeeks presentation got a whole lot easier. Grab these presentations today.
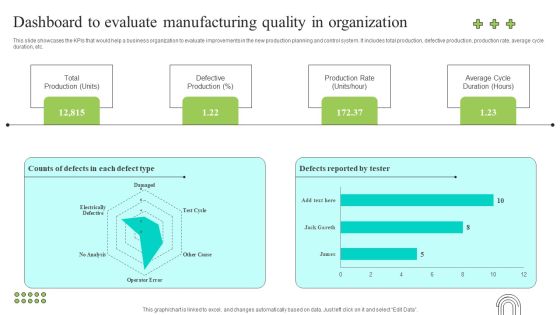
Effective Production Planning And Monitoring Techniques Dashboard To Evaluate Manufacturing Quality Brochure PDF
This slide showcases the KPIs that would help a business organization to evaluate improvements in the new production planning and control system. It includes total production, defective production, production rate, average cycle duration, etc. Make sure to capture your audiences attention in your business displays with our gratis customizable Effective Production Planning And Monitoring Techniques Dashboard To Evaluate Manufacturing Quality Brochure PDF. These are great for business strategies, office conferences, capital raising or task suggestions. If you desire to acquire more customers for your tech business and ensure they stay satisfied, create your own sales presentation with these plain slides.
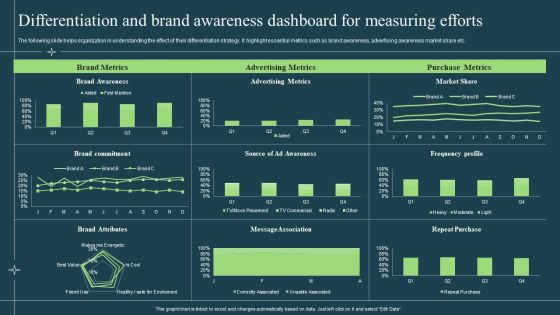
Differentiation Techniques Ways To Surpass Competitors Differentiation And Brand Awareness Dashboard For Measuring Efforts Template PDF
The following slide helps organization in understanding the effect of their differentiation strategy. It highlight essential metrics such as brand awareness, advertising awareness market share etc. Deliver and pitch your topic in the best possible manner with this Differentiation Techniques Ways To Surpass Competitors Differentiation And Brand Awareness Dashboard For Measuring Efforts Template PDF. Use them to share invaluable insights on Brand Awareness, Brand Metrics, Advertising Metrics and impress your audience. This template can be altered and modified as per your expectations. So, grab it now.

Smartphone Game Development And Advertising Technique Dashboard For Measuring P2E Web 3 Game Website Information PDF
Are you in need of a template that can accommodate all of your creative concepts This one is crafted professionally and can be altered to fit any style. Use it with Google Slides or PowerPoint. Include striking photographs, symbols, depictions, and other visuals. Fill, move around, or remove text boxes as desired. Test out color palettes and font mixtures. Edit and save your work, or work with colleagues. Download Smartphone Game Development And Advertising Technique Dashboard For Measuring P2E Web 3 Game Website Information PDF and observe how to make your presentation outstanding. Give an impeccable presentation to your group and make your presentation unforgettable.

Portfolio Administration Dashboard Budget Ppt PowerPoint Presentation Complete Deck With Slides
This portfolio administration dashboard budget ppt powerpoint presentation complete deck with slides acts as backup support for your ideas, vision, thoughts, etc. Use it to present a thorough understanding of the topic. This PPT slideshow can be utilized for both in-house and outside presentations depending upon your needs and business demands. Entailing twelve slides with a consistent design and theme, this template will make a solid use case. As it is intuitively designed, it suits every business vertical and industry. All you have to do is make a few tweaks in the content or any other component to design unique presentations. The biggest advantage of this complete deck is that it can be personalized multiple times once downloaded. The color, design, shapes, and other elements are free to modify to add personal touches. You can also insert your logo design in this PPT layout. Therefore a well-thought and crafted presentation can be delivered with ease and precision by downloading this portfolio administration dashboard budget ppt powerpoint presentation complete deck with slides PPT slideshow.

Product Marketing For Generating Product Marketing Dashboard With Sales Trend Designs PDF
This graph or chart is linked to excel, and changes automatically based on data. Just left click on it and select Edit Data. From laying roadmaps to briefing everything in detail, our templates are perfect for you. You can set the stage with your presentation slides. All you have to do is download these easy-to-edit and customizable templates. Product Marketing For Generating Product Marketing Dashboard With Sales Trend Designs PDF will help you deliver an outstanding performance that everyone would remember and praise you for. Do download this presentation today.
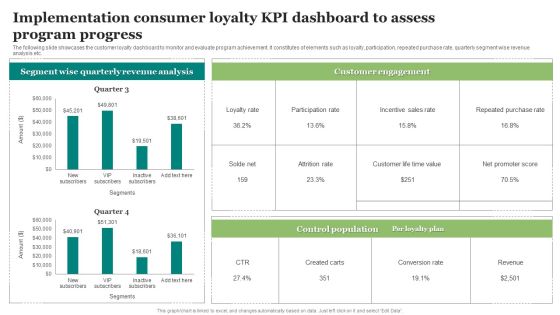
Implementation Consumer Loyalty KPI Dashboard To Assess Program Progress Guidelines PDF
The following slide illustrates the impact of executing artificial technology and machine learning in customer loyalty program. It includes elements such as predictive insights, prescriptive analytics, fraud prevention, intelligent interference etc. Showcasing this set of slides titled Implementation Consumer Loyalty KPI Dashboard To Assess Program Progress Guidelines PDF. The topics addressed in these templates are Implementation Consumer, Assess Program. All the content presented in this PPT design is completely editable. Download it and make adjustments in color, background, font etc. as per your unique business setting.
Ecommerce Website Creation Action Steps Playbook Ecommerce Website Performance Tracking Dashboard Template PDF
Slidegeeks is here to make your presentations a breeze with Ecommerce Website Creation Action Steps Playbook Ecommerce Website Performance Tracking Dashboard Template PDF With our easy-to-use and customizable templates, you can focus on delivering your ideas rather than worrying about formatting. With a variety of designs to choose from, youre sure to find one that suits your needs. And with animations and unique photos, illustrations, and fonts, you can make your presentation pop. So whether youre giving a sales pitch or presenting to the board, make sure to check out Slidegeeks first.
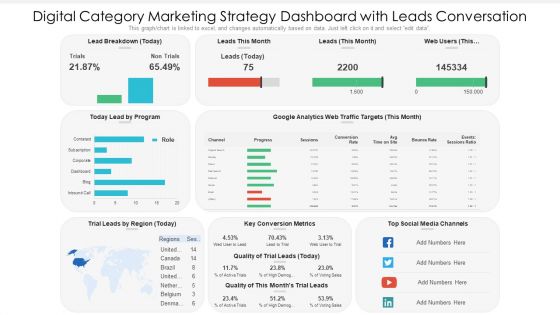
Digital Category Marketing Strategy Dashboard With Leads Conversation Ppt PowerPoint Presentation Slides Information PDF
This graph chart is linked to excel, and changes automatically based on data. Just left click on it and select edit data. Pitch your topic with ease and precision using this digital category marketing strategy dashboard with leads conversation ppt powerpoint presentation slides information pdf. This layout presents information on key conversion metrics, social media channels, lead by program. It is also available for immediate download and adjustment. So, changes can be made in the color, design, graphics or any other component to create a unique layout.
Effective Company Event Communication Plan Dashboard For Tracking Active Number Microsoft PDF
This slide covers metrics for analyzing the number of most active event participants. It includes KPIs such as check-in status, contract roles, top industries, contract by country, top 5 job functions, etc. Deliver and pitch your topic in the best possible manner with this Effective Company Event Communication Plan Dashboard For Tracking Active Number Microsoft PDF Use them to share invaluable insights on Marketing, Management Less, Attendance and impress your audience. This template can be altered and modified as per your expectations. So, grab it now.

Client Helpline Dashboard At Valet Information Dsk Ppt Gallery Slide Portrait PDF
This graph or chart is linked to excel, and changes automatically based on data. Just left click on it and select Edit Data. Pitch your topic with ease and precision using this Client Helpline Dashboard At Valet Information Dsk Ppt Gallery Slide Portrait PDF. This layout presents information on Valet Damage Claims, Valet Wait Times, Information Desk. It is also available for immediate download and adjustment. So, changes can be made in the color, design, graphics or any other component to create a unique layout.

Firm KPI Dashboard With Average Click Through Rate Ppt Inspiration Sample PDF
This graph or chart is linked to excel, and changes automatically based on data. Just left click on it and select Edit Data. Pitch your topic with ease and precision using this Firm KPI Dashboard With Average Click Through Rate Ppt Inspiration Sample PDF. This layout presents information on Total Clicks, Total Impressive, Average CTR, Average Position. It is also available for immediate download and adjustment. So, changes can be made in the color, design, graphics or any other component to create a unique layout.
Effective Company Event Communication Tactics Dashboard For Tracking Active Number Of Attendances Demonstration PDF
This slide covers metrics for analyzing the number of most active event participants. It includes KPIs such as check-in status, contract roles, top industries, contract by country, top 5 job functions, etc. Deliver and pitch your topic in the best possible manner with this Effective Company Event Communication Tactics Dashboard For Tracking Active Number Of Attendances Demonstration PDF. Use them to share invaluable insights on Attendance, Exhibitors, Management and impress your audience. This template can be altered and modified as per your expectations. So, grab it now.

Service Level Agreement KPI Dashboard Indicating Violation Count And Overdue Requests Diagrams PDF
This graph or chart is linked to excel, and changes automatically based on data. Just left click on it and select Edit Data. Showcasing this set of slides titled Service Level Agreement KPI Dashboard Indicating Violation Count And Overdue Requests Diagrams PDF. The topics addressed in these templates are Total Requests Category, Total Requests Status, Urgent Requests. All the content presented in this PPT design is completely editable. Download it and make adjustments in color, background, font etc. as per your unique business setting.

Service Level Agreement KPI Dashboard With Current Risk Statistics Topics PDF
This graph or chart is linked to excel, and changes automatically based on data. Just left click on it and select Edit Data. Pitch your topic with ease and precision using this Service Level Agreement KPI Dashboard With Current Risk Statistics Topics PDF. This layout presents information on Current Risk SLAS, Current Breached Slas, Personal Active SLA It is also available for immediate download and adjustment. So, changes can be made in the color, design, graphics or any other component to create a unique layout.

Company Financial Performance Indicators Dashboard With Liquidity And Turnover Ratios Formats PDF
This graph or chart is linked to excel, and changes automatically based on data. Just left click on it and select Edit Data. Pitch your topic with ease and precision using this Company Financial Performance Indicators Dashboard With Liquidity And Turnover Ratios Formats PDF. This layout presents information on Cash Balance, Days Inventory Outstanding, Days Payable Outstanding. It is also available for immediate download and adjustment. So, changes can be made in the color, design, graphics or any other component to create a unique layout.
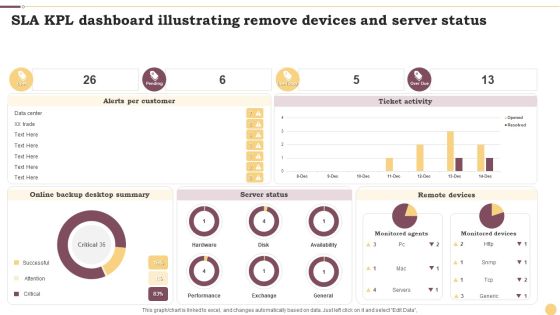
SLA KPL Dashboard Illustrating Remove Devices And Server Status Ppt Inspiration Layout Ideas PDF
This graph or chart is linked to excel, and changes automatically based on data. Just left click on it and select Edit Data. Showcasing this set of slides titled SLA KPL Dashboard Illustrating Remove Devices And Server Status Ppt Inspiration Layout Ideas PDF. The topics addressed in these templates are Alerts Per Customer, Ticket Activity, Server Status. All the content presented in this PPT design is completely editable. Download it and make adjustments in color, background, font etc. as per your unique business setting.

SLA KPL Dashboard Illustrating Risk And Active Services Ppt Portfolio Design Inspiration PDF
This graph or chart is linked to excel, and changes automatically based on data. Just left click on it and select Edit Data. Pitch your topic with ease and precision using this SLA KPL Dashboard Illustrating Risk And Active Services Ppt Portfolio Design Inspiration PDF. This layout presents information on My Active SLAs, Database Group, Priority. It is also available for immediate download and adjustment. So, changes can be made in the color, design, graphics or any other component to create a unique layout.
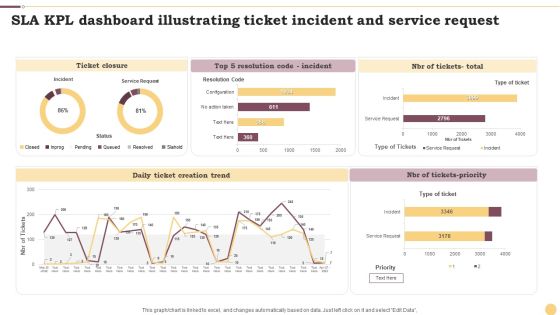
SLA KPL Dashboard Illustrating Ticket Incident And Service Request Ppt File Portrait PDF
This graph or chart is linked to excel, and changes automatically based on data. Just left click on it and select Edit Data. Showcasing this set of slides titled SLA KPL Dashboard Illustrating Ticket Incident And Service Request Ppt File Portrait PDF. The topics addressed in these templates are Ticket Closure, Daily Ticket, Creation Trend, NBR Tickets Priority. All the content presented in this PPT design is completely editable. Download it and make adjustments in color, background, font etc. as per your unique business setting.
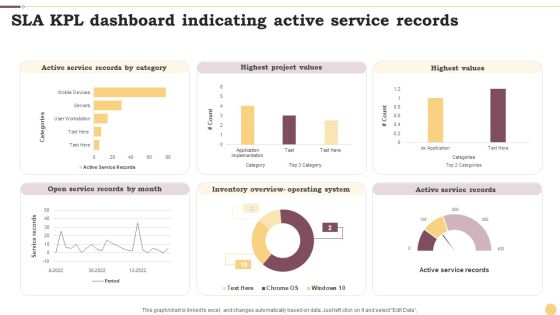
SLA KPL Dashboard Indicating Active Service Records Ppt Professional Graphics Example PDF
This graph or chart is linked to excel, and changes automatically based on data. Just left click on it and select Edit Data. Pitch your topic with ease and precision using this SLA KPL Dashboard Indicating Active Service Records Ppt Professional Graphics Example PDF. This layout presents information on Active Service Records, Highest Project Values, Highest Values. It is also available for immediate download and adjustment. So, changes can be made in the color, design, graphics or any other component to create a unique layout.
Rebranding Project Progress Tracking Dashboard Strategies For Rebranding Without Losing Template PDF
This slide provides information regarding essential characteristics of co branding in terms of strategic partnership, build credibility, developing marketing strategy, develop innovation and value addition, etc. If your project calls for a presentation, then Slidegeeks is your go-to partner because we have professionally designed, easy-to-edit templates that are perfect for any presentation. After downloading, you can easily edit Rebranding Project Progress Tracking Dashboard Strategies For Rebranding Without Losing Template PDF and make the changes accordingly. You can rearrange slides or fill them with different images. Check out all the handy templates
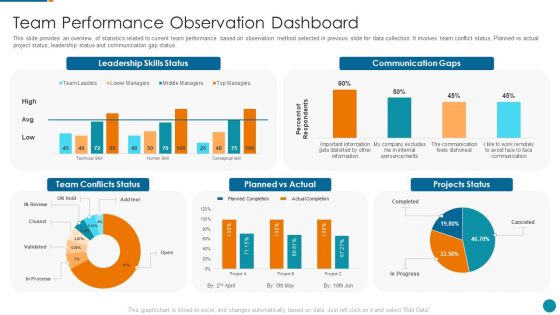
Strategic Procedure To Improve Employee Efficiency Team Performance Observation Dashboard Formats PDF
This slide provides an overview of statistics related to current team performance based on observation method selected in previous slide for data collection. It involves team conflict status, Planned vs actual project status, leadership status and communication gap status.Deliver an awe inspiring pitch with this creative strategic procedure to improve employee efficiency team performance observation dashboard formats pdf bundle. Topics like leadership skills status, communication gaps, planned vs actual can be discussed with this completely editable template. It is available for immediate download depending on the needs and requirements of the user.

Website And Social Media Digital Audit Dashboard Highlighting Website Visitors With Device Rules PDF
This slide highlights the website visitors by different countries which also includes the users and session data from last 10 days, it also includes user demographic. Device and new vs returning user. Deliver an awe inspiring pitch with this creative Website And Social Media Digital Audit Dashboard Highlighting Website Visitors With Device Rules PDF bundle. Topics like Website Visitors Country, User Demographics, Social Networks can be discussed with this completely editable template. It is available for immediate download depending on the needs and requirements of the user.
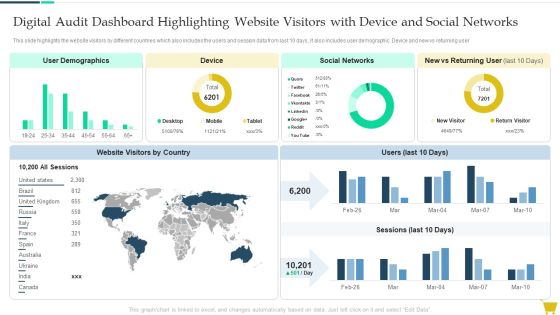
Digital Audit Dashboard Highlighting Website Visitors With Device And Social Networks Guidelines PDF
This slide highlights the website visitors by different countries which also includes the users and session data from last 10 days, it also includes user demographic. Device and new vs returning user. Deliver and pitch your topic in the best possible manner with this Digital Audit Dashboard Highlighting Website Visitors With Device And Social Networks Guidelines PDF. Use them to share invaluable insights on Device, Social Networks, User Demographics and impress your audience. This template can be altered and modified as per your expectations. So, grab it now.
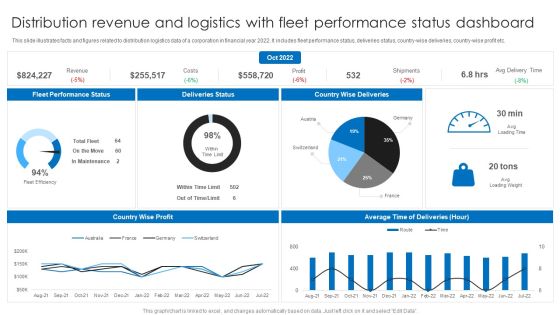
Distribution Revenue And Logistics With Fleet Performance Status Dashboard Ppt Layouts Background PDF
This slide illustrates facts and figures related to distribution logistics data of a corporation in financial year 2022. It includes fleet performance status, deliveries status, country-wise deliveries, country-wise profit etc. Pitch your topic with ease and precision using this Distribution Revenue And Logistics With Fleet Performance Status Dashboard Ppt Layouts Background PDF. This layout presents information on Deliveries Status, Country Wise Deliveries, Fleet Performance Status. It is also available for immediate download and adjustment. So, changes can be made in the color, design, graphics or any other component to create a unique layout.

Employee Performance Management To Enhance Organizational Growth KPI Dashboard To Track Employee Topics PDF
The Employee Performance Management To Enhance Organizational Growth KPI Dashboard To Track Employee Topics PDF is a compilation of the most recent design trends as a series of slides. It is suitable for any subject or industry presentation, containing attractive visuals and photo spots for businesses to clearly express their messages. This template contains a variety of slides for the user to input data, such as structures to contrast two elements, bullet points, and slides for written information. Slidegeeks is prepared to create an impression.
SEO Tracking Dashboard For Backlinks And Keywords Ppt PowerPoint Presentation File Deck PDF
Purpose of the following slide is to measure the SEO performance of the organization as it measures the keywords, backlinks, the total number of sessions and average call duration The SEO Tracking Dashboard For Backlinks And Keywords Ppt PowerPoint Presentation File Deck PDF is a compilation of the most recent design trends as a series of slides. It is suitable for any subject or industry presentation, containing attractive visuals and photo spots for businesses to clearly express their messages. This template contains a variety of slides for the user to input data, such as structures to contrast two elements, bullet points, and slides for written information. Slidegeeks is prepared to create an impression.

Dashboard To Track On Page And Off Page SEO Website Traffic Management Information PDF
This slide showcases traffic results from on-page SEO techniques like strategy ideas, SERP features, technical SEO etc. and off-page SEO traffic results from backlink, link building etc. Showcasing this set of slides titled Dashboard To Track On Page And Off Page SEO Website Traffic Management Information PDF. The topics addressed in these templates are Domain Analytics, Site Audit, Backlink Audit. All the content presented in this PPT design is completely editable. Download it and make adjustments in color, background, font etc. as per your unique business setting.

Six Stage Of IT Issue Resolution And Project Status Dashboard Topics PDF
This slide illustrates facts and figures related to six steps of finding solution for a technical issue with IT project. It includes steps such as planning, design, development, testing, project launch, etc. Showcasing this set of slides titled Six Stage Of IT Issue Resolution And Project Status Dashboard Topics PDF. The topics addressed in these templates are Planning, Design, Development. All the content presented in this PPT design is completely editable. Download it and make adjustments in color, background, font etc. as per your unique business setting.

Survey Response Results KPI Dashboard Infographic Ppt PowerPoint Presentation Complete Deck With Slides
If designing a presentation takes a lot of your time and resources and you are looking for a better alternative, then this Survey Response Results KPI Dashboard Infographic Ppt PowerPoint Presentation Complete Deck With Slides is the right fit for you. This is a prefabricated set that can help you deliver a great presentation on the topic. All the twelv slides included in this sample template can be used to present a birds-eye view of the topic. These slides are also fully editable, giving you enough freedom to add specific details to make this layout more suited to your business setting. Apart from the content, all other elements like color, design, theme are also replaceable and editable. This helps in designing a variety of presentations with a single layout. Not only this, you can use this PPT design in formats like PDF, PNG, and JPG once downloaded. Therefore, without any further ado, download and utilize this sample presentation as per your liking.

Online Marketing Techniques For Acquiring Clients Dashboard To Measure Performance Of Social Media Guidelines PDF
This following slide displays the key metrics that can help an organization to measure effectiveness of e commerce strategies. These can be revenue generated using e-commerce platform, conversion rates etc. This Online Marketing Techniques For Acquiring Clients Dashboard To Measure Performance Of Social Media Guidelines PDF from Slidegeeks makes it easy to present information on your topic with precision. It provides customization options, so you can make changes to the colors, design, graphics, or any other component to create a unique layout. It is also available for immediate download, so you can begin using it right away. Slidegeeks has done good research to ensure that you have everything you need to make your presentation stand out. Make a name out there for a brilliant performance.
Traditional Marketing Techniques Dashboard For Tracking Offline Marketing Event Pictures PDF
This slide covers metrics for analyzing the event revenue and registrations. It includes KPIs such as gross revenue, gross revenue from promos, total refund, total registration, visits to purchase conversion, check-in- status, etc. Slidegeeks is one of the best resources for PowerPoint templates. You can download easily and regulate Traditional Marketing Techniques Dashboard For Tracking Offline Marketing Event Pictures PDF for your personal presentations from our wonderful collection. A few clicks is all it takes to discover and get the most relevant and appropriate templates. Use our Templates to add a unique zing and appeal to your presentation and meetings. All the slides are easy to edit and you can use them even for advertisement purposes.
Techniques To Enhance Customer Engagement Via Digital Platforms Dashboard To Measure Performance Of Social Icons PDF
This following slide displays the key metrics that can help an organization to measure effectiveness of social media strategies. These can be leads generated, leads by region, web traffic targets etc. Slidegeeks is here to make your presentations a breeze with Techniques To Enhance Customer Engagement Via Digital Platforms Dashboard To Measure Performance Of Social Icons PDF With our easy-to-use and customizable templates, you can focus on delivering your ideas rather than worrying about formatting. With a variety of designs to choose from, you are sure to find one that suits your needs. And with animations and unique photos, illustrations, and fonts, you can make your presentation pop. So whether you are giving a sales pitch or presenting to the board, make sure to check out Slidegeeks first.
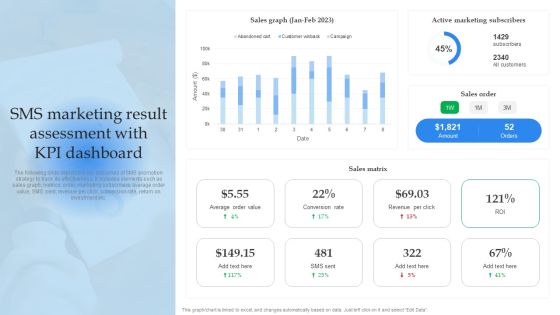
Mobile Promotion Strategic Guide For Micro Businesses Sms Marketing Result Assessment With Kpi Dashboard Slides PDF
The following slide depicts the key outcomes of SMS promotion strategy to track its effectiveness. It includes elements such as sales graph, metrics, order, marketing subscribers, average order value, SMS sent, revenue per click, conversion rate, return on investment etc. Slidegeeks is here to make your presentations a breeze with Mobile Promotion Strategic Guide For Micro Businesses Sms Marketing Result Assessment With Kpi Dashboard Slides PDF With our easy to use and customizable templates, you can focus on delivering your ideas rather than worrying about formatting. With a variety of designs to choose from, you are sure to find one that suits your needs. And with animations and unique photos, illustrations, and fonts, you can make your presentation pop. So whether you are giving a sales pitch or presenting to the board, make sure to check out Slidegeeks first.

Creating Positioning Techniques For Market Research Kpi Dashboard To Analyze Customer Satisfaction Mockup PDF
The following slide outlines a comprehensive visual representation of customer satisfaction CSAT that can assist companies to measure how happy are customers wit the brand. The KPIs covered are net promoter score NPS, customer effort score CES, product quality, pricing, etc. Want to ace your presentation in front of a live audience Our Creating Positioning Techniques For Market Research Kpi Dashboard To Analyze Customer Satisfaction Mockup PDF can help you do that by engaging all the users towards you. Slidegeeks experts have put their efforts and expertise into creating these impeccable powerpoint presentations so that you can communicate your ideas clearly. Moreover, all the templates are customizable, and easy to edit and downloadable. Use these for both personal and commercial use.

Adopting IMC Technique To Boost Brand Recognition Kpi Dashboard To Analyze Personal Selling Results Formats PDF
The following slide highlights personal selling efforts of region wise sales representatives to attract new and retain previous customers. It includes elements such as total team sales, weekly, monthly and annual individual outcomes etc. Coming up with a presentation necessitates that the majority of the effort goes into the content and the message you intend to convey. The visuals of a PowerPoint presentation can only be effective if it supplements and supports the story that is being told. Keeping this in mind our experts created Adopting IMC Technique To Boost Brand Recognition Kpi Dashboard To Analyze Personal Selling Results Formats PDF to reduce the time that goes into designing the presentation. This way, you can concentrate on the message while our designers take care of providing you with the right template for the situation.

Techniques To Elevate Brand Visibility Reputation Management Dashboard To Manage Brands Status Sample PDF
This slide provides information regarding reputation management to monitor brands status in terms of brand review summary, listing score, competition, listing accuracy, etc. Are you in need of a template that can accommodate all of your creative concepts This one is crafted professionally and can be altered to fit any style. Use it with Google Slides or PowerPoint. Include striking photographs, symbols, depictions, and other visuals. Fill, move around, or remove text boxes as desired. Test out color palettes and font mixtures. Edit and save your work, or work with colleagues. Download Techniques To Elevate Brand Visibility Reputation Management Dashboard To Manage Brands Status Sample PDF and observe how to make your presentation outstanding. Give an impeccable presentation to your group and make your presentation unforgettable.

Company Event Communication Dashboard For Tracking Active Number Of Attendances Portrait PDF
This slide covers metrics for analyzing the number of most active event participants. It includes KPIs such as check-in status, contract roles, top industries, contract by country, top 5 job functions, etc. Slidegeeks is one of the best resources for PowerPoint templates. You can download easily and regulate Company Event Communication Dashboard For Tracking Active Number Of Attendances Portrait PDF for your personal presentations from our wonderful collection. A few clicks is all it takes to discover and get the most relevant and appropriate templates. Use our Templates to add a unique zing and appeal to your presentation and meetings. All the slides are easy to edit and you can use them even for advertisement purposes.

Social Media Marketing Dashboard Marketing Tactics To Enhance Business Topics PDF
The following slide displays key metrics that can help the organization to measure effectiveness of social media marketing strategy, these can be growth in engagement, audience growth etc. Slidegeeks is here to make your presentations a breeze with Social Media Marketing Dashboard Marketing Tactics To Enhance Business Topics PDF With our easy-to-use and customizable templates, you can focus on delivering your ideas rather than worrying about formatting. With a variety of designs to choose from, you are sure to find one that suits your needs. And with animations and unique photos, illustrations, and fonts, you can make your presentation pop. So whether you are giving a sales pitch or presenting to the board, make sure to check out Slidegeeks first.

Brand Personality Improvement To Increase Profits Reputation Management Dashboard To Track Demonstration PDF
This slide provides information regarding reputation management to monitor brands effectiveness in terms of brand review summary, listing score, competition, listing accuracy, etc. Slidegeeks is here to make your presentations a breeze with Brand Personality Improvement To Increase Profits Reputation Management Dashboard To Track Demonstration PDF With our easy to use and customizable templates, you can focus on delivering your ideas rather than worrying about formatting. With a variety of designs to choose from, you are sure to find one that suits your needs. And with animations and unique photos, illustrations, and fonts, you can make your presentation pop. So whether you are giving a sales pitch or presenting to the board, make sure to check out Slidegeeks first.

Dashboard To Measure Display Advertising Campaigns Performance Ppt Layouts Objects PDF
This slide showcases the functioning model of the programmatic RTB methodology. It include processes such as user visit, website communication with SSP, SSP communication with DSP and setting bid rates. Present like a pro with Dashboard To Measure Display Advertising Campaigns Performance Ppt Layouts Objects PDF Create beautiful presentations together with your team, using our easy to use presentation slides. Share your ideas in real time and make changes on the fly by downloading our templates. So whether you are in the office, on the go, or in a remote location, you can stay in sync with your team and present your ideas with confidence. With Slidegeeks presentation got a whole lot easier. Grab these presentations today.
Procurement Automation Strategy End To End Process Tracking Dashboard On Cloud Pictures PDF
This slide covers tool for analysing end to end procurement process. It includes features such as tracking real- time overall business health, checking quotation to order conversion, automated notifications and payments reminders, etc. Do you know about Slidesgeeks Procurement Automation Strategy End To End Process Tracking Dashboard On Cloud Pictures PDF These are perfect for delivering any kind od presentation. Using it, create PowerPoint presentations that communicate your ideas and engage audiences. Save time and effort by using our pre designed presentation templates that are perfect for a wide range of topic. Our vast selection of designs covers a range of styles, from creative to business, and are all highly customizable and easy to edit. Download as a PowerPoint template or use them as Google Slides themes.

Sales Growth And Profitability Sales Dashboard Ppt PowerPoint Presentation Complete Deck With Slides
If designing a presentation takes a lot of your time and resources and you are looking for a better alternative, then this sales growth and profitability sales dashboard ppt powerpoint presentation complete deck with slides is the right fit for you. This is a prefabricated set that can help you deliver a great presentation on the topic. All the twelve slides included in this sample template can be used to present a birds-eye view of the topic. These slides are also fully editable, giving you enough freedom to add specific details to make this layout more suited to your business setting. Apart from the content, all other elements like color, design, theme are also replaceable and editable. This helps in designing a variety of presentations with a single layout. Not only this, you can use this PPT design in formats like PDF, PNG, and JPG once downloaded. Therefore, without any further ado, download and utilize this sample presentation as per your liking.

Development And Operations KPI Dashboard Ppt PowerPoint Presentation Complete Deck With Slides
If designing a presentation takes a lot of your time and resources and you are looking for a better alternative, then this Development And Operations KPI Dashboard Ppt PowerPoint Presentation Complete Deck With Slides is the right fit for you. This is a prefabricated set that can help you deliver a great presentation on the topic. All the twelve slides included in this sample template can be used to present a birds-eye view of the topic. These slides are also fully editable, giving you enough freedom to add specific details to make this layout more suited to your business setting. Apart from the content, all other elements like color, design, theme are also replaceable and editable. This helps in designing a variety of presentations with a single layout. Not only this, you can use this PPT design in formats like PDF, PNG, and JPG once downloaded. Therefore, without any further ado, download and utilize this sample presentation as per your liking.

Content Marketing Freelance KPI Dashboard Ppt PowerPoint Presentation Complete With Slides
If designing a presentation takes a lot of your time and resources and you are looking for a better alternative, then this Content Marketing Freelance KPI Dashboard Ppt PowerPoint Presentation Complete With Slides is the right fit for you. This is a prefabricated set that can help you deliver a great presentation on the topic. All the twenty seven slides included in this sample template can be used to present a birds-eye view of the topic. These slides are also fully editable, giving you enough freedom to add specific details to make this layout more suited to your business setting. Apart from the content, all other elements like color, design, theme are also replaceable and editable. This helps in designing a variety of presentations with a single layout. Not only this, you can use this PPT design in formats like PDF, PNG, and JPG once downloaded. Therefore, without any further ado, download and utilize this sample presentation as per your liking.

Data Safety Initiatives Risk Management KPI Dashboard With Loss Events And Actions Rules PDF
Following slide illustrates a risk management KPI dashboard. KPIs covered are top ten risks, loss events, actions, key risk indicators and compliance. Deliver an awe inspiring pitch with this creativedata safety initiatives overview of new it policy framework pictures pdf bundle. Topics like actions, key risk indicators, compliance, top 10 risks, loss events can be discussed with this completely editable template. It is available for immediate download depending on the needs and requirements of the user.

Detailed Analysis Of Red Ocean Vs Blue Ocean Approach Summary Of The Blue Ocean Strategy Sample PDF
This template covers summary of blue ocean strategy for company. It depicts that blue ocean is founded on data rather than unproven theories, blue ocean strategy indicates that the objective is not to exceed the competitors or be the best in the industry and low cost can be achieved if company can identify what consumers value and then rethink how to provide that value it is called value innovation. This Detailed Analysis Of Red Ocean Vs Blue Ocean Approach Summary Of The Blue Ocean Strategy Sample PDF from Slidegeeks makes it easy to present information on your topic with precision. It provides customization options, so you can make changes to the colors, design, graphics, or any other component to create a unique layout. It is also available for immediate download, so you can begin using it right away. Slidegeeks has done good research to ensure that you have everything you need to make your presentation stand out. Make a name out there for a brilliant performance.

Data Lake Architecture Future Of Data Analysis What Are The Benefits Of A Data Lake Background PDF
This slide depicts the benefits of the data lake including low-cost scalability and flexibility, collection of multiple content sources, adaptability, and low-cost file storage.Deliver and pitch your topic in the best possible manner with this Data Lake Architecture Future Of Data Analysis What Are The Benefits Of A Data Lake Background PDF. Use them to share invaluable insights on Product Ionization, Scalability And Flexibility, Changeable And Adaptable and impress your audience. This template can be altered and modified as per your expectations. So, grab it now.

Credit Rating Process With Issuer And Rating Agency Credit Risk Analysis Model For Banking Institutions Graphics PDF
This slide shows the credit rating process with issuer and rating agency request such as data and rating charges, interactions of executives, team assigned, etc.This Credit Rating Process With Issuer And Rating Agency Credit Risk Analysis Model For Banking Institutions Graphics PDF from Slidegeeks makes it easy to present information on your topic with precision. It provides customization options, so you can make changes to the colors, design, graphics, or any other component to create a unique layout. It is also available for immediate download, so you can begin using it right away. Slidegeeks has done good research to ensure that you have everything you need to make your presentation stand out. Make a name out there for a brilliant performance.

Optimizing Logistics Models To Enhance Supply Chain Management Cost Involved In Implementing Best Supply Chain Model Professional PDF
This slide highlights the cost involved in implementing supply chain model which covers resources availability, warehousing and transportation, data evaluation, market demand analysis, etc. Want to ace your presentation in front of a live audience Our Optimizing Logistics Models To Enhance Supply Chain Management Cost Involved In Implementing Best Supply Chain Model Professional PDF can help you do that by engaging all the users towards you. Slidegeeks experts have put their efforts and expertise into creating these impeccable powerpoint presentations so that you can communicate your ideas clearly. Moreover, all the templates are customizable, and easy to edit and downloadable. Use these for both personal and commercial use.
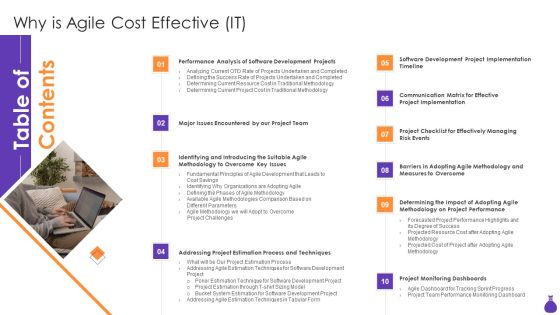
Table Of Contents Why Is Agile Cost Effective IT Wd Ppt PowerPoint Presentation File Visual Aids PDF
Presenting Table Of Contents Why Is Agile Cost Effective IT Wd Ppt PowerPoint Presentation File Visual Aids PDF to provide visual cues and insights. Share and navigate important information on ten stages that need your due attention. This template can be used to pitch topics like Addressing Project Estimation, Process And Techniques, Project Monitoring Dashboards, Major Issues Encountered By Our Project Team. In addtion, this PPT design contains high resolution images, graphics, etc, that are easily editable and available for immediate download.

Introduction To Artificial Intelligence In Operation Management Industry Cost Of Artificial Intelligence In IT Operations Microsoft PDF
The following slide highlights the various providers AIOPs providers, the provided table highlights various metrics such as data collection, data analysis, automated reaction, data visualization and the price. Present like a pro with Introduction To Artificial Intelligence In Operation Management Industry Cost Of Artificial Intelligence In IT Operations Microsoft PDF Create beautiful presentations together with your team, using our easy-to-use presentation slides. Share your ideas in real-time and make changes on the fly by downloading our templates. So whether you are in the office, on the go, or in a remote location, you can stay in sync with your team and present your ideas with confidence. With Slidegeeks presentation got a whole lot easier. Grab these presentations today.

Web 3 0 Blockchain Based P2E Mobile Game Sector Report Promotional Plan Marketing Activity Budget And Cost Clipart PDF
The following slide helps organization in analysing the marketing activity cost breakdown for P2E Web3 NFT based game. It highlights essential elements such as influencer marketing cost, average cost per install etc. If your project calls for a presentation, then Slidegeeks is your go-to partner because we have professionally designed, easy-to-edit templates that are perfect for any presentation. After downloading, you can easily edit Web 3 0 Blockchain Based P2E Mobile Game Sector Report Promotional Plan Marketing Activity Budget And Cost Clipart PDF and make the changes accordingly. You can rearrange slides or fill them with different images. Check out all the handy templates

Gym Health And Fitness Market Industry Report Competitors Analysis On The Basis Of Membership Fees Initiation Rules PDF
Presenting this set of slides with name gym health and fitness market industry report competitors analysis on the basis of membership fees initiation rules pdf. The topics discussed in these slides are gym chain, initiation fee, annual fee, monthly cost, annual total. This is a completely editable PowerPoint presentation and is available for immediate download. Download now and impress your audience.
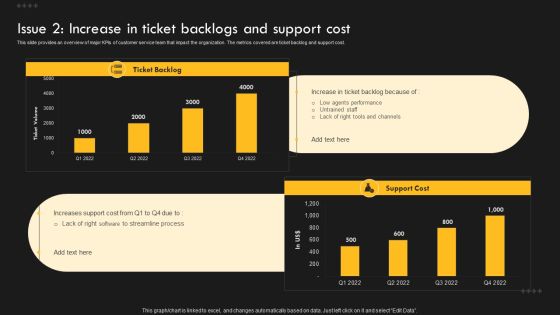
Service Improvement Techniques For Client Retention Issue 2 Increase In Ticket Backlogs And Support Cost Guidelines PDF
This slide provides an overview of major KPIs of customer service team. The metrics covered are customer satisfaction and retention. Are you searching for a Service Improvement Techniques For Client Retention Issue 2 Increase In Ticket Backlogs And Support Cost Guidelines PDF that is uncluttered, straightforward, and original. Its easy to edit, and you can change the colors to suit your personal or business branding. For a presentation that expresses how much effort you have put in, this template is ideal. With all of its features, including tables, diagrams, statistics, and lists, its perfect for a business plan presentation. Make your ideas more appealing with these professional slides. Download Service Improvement Techniques For Client Retention Issue 2 Increase In Ticket Backlogs And Support Cost Guidelines PDF from Slidegeeks today.

Cost Of Developing A Personal Brand Comprehensive Personal Brand Building Guide For Social Media Influencers Brochure PDF
Following slide illustrates information about the brand developing activities along with the costing details. Activities covered are related to competitor research, brand strategy, brand design and brand marketing.The Cost Of Developing A Personal Brand Comprehensive Personal Brand Building Guide For Social Media Influencers Brochure PDF is a compilation of the most recent design trends as a series of slides. It is suitable for any subject or industry presentation, containing attractive visuals and photo spots for businesses to clearly express their messages. This template contains a variety of slides for the user to input data, such as structures to contrast two elements, bullet points, and slides for written information. Slidegeeks is prepared to create an impression.

Data Lake Architecture Future Of Data Analysis Data Lakes Vs Data Lakehouses Vs Data Warehouses Portrait PDF
This slide represents a comparison between data lakes, data lake houses, and data warehouses based on factors such as type of data, cost, format, scalability, reliability, and so on.Deliver and pitch your topic in the best possible manner with this Data Lake Architecture Future Of Data Analysis Data Lakes Vs Data Lakehouses Vs Data Warehouses Portrait PDF. Use them to share invaluable insights on Reliability, Machine Learning, Data Scientists and impress your audience. This template can be altered and modified as per your expectations. So, grab it now.

BPA Tools For Process Enhancement And Cost Minimization What Tasks Can Be Automated Within Social Media Platforms Infographics PDF
The following slide outlines different tasks which can be automated within social media platforms such as facebook, instagram, and youtube. Scheduling and publishing, data collection and reporting, social ads management and social monitoring are the major tasks which can be automated. This modern and well arranged BPA Tools For Process Enhancement And Cost Minimization What Tasks Can Be Automated Within Social Media Platforms Infographics PDF provides lots of creative possibilities. It is very simple to customize and edit with the Powerpoint Software. Just drag and drop your pictures into the shapes. All facets of this template can be edited with Powerpoint no extra software is necessary. Add your own material, put your images in the places assigned for them, adjust the colors, and then you can show your slides to the world, with an animated slide included.
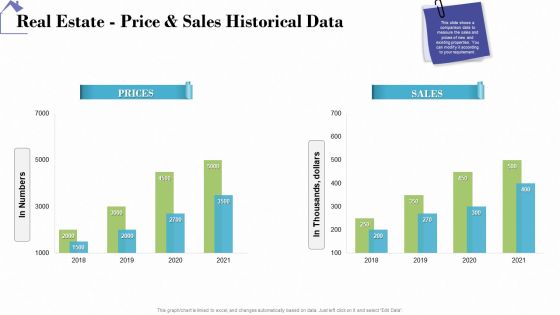
Industry Analysis Of Real Estate And Construction Sector Real Estate Price And Sales Historical Data Diagrams PDF
Deliver and pitch your topic in the best possible manner with this industry analysis of real estate and construction sector real estate price and sales historical data diagrams pdf. Use them to share invaluable insights on prices, sales and impress your audience. This template can be altered and modified as per your expectations. So, grab it now.
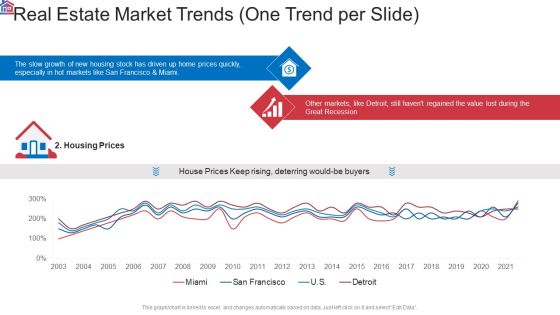
Market Research Analysis Of Housing Sector Real Estate Market Trends One Trend Per Slide Prices Template PDF
Deliver an awe inspiring pitch with this creative market research analysis of housing sector real estate market trends one trend per slide prices template pdf bundle. Topics like growth, markets, prices, value can be discussed with this completely editable template. It is available for immediate download depending on the needs and requirements of the user.
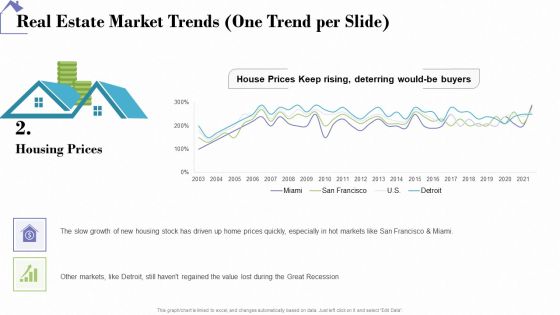
Industry Analysis Of Real Estate And Construction Sector Real Estate Market Trends One Trend Per Slide Prices Elements PDF
Deliver an awe inspiring pitch with this creative industry analysis of real estate and construction sector real estate market trends one trend per slide prices elements pdf bundle. Topics like growth, markets, prices, value can be discussed with this completely editable template. It is available for immediate download depending on the needs and requirements of the user.
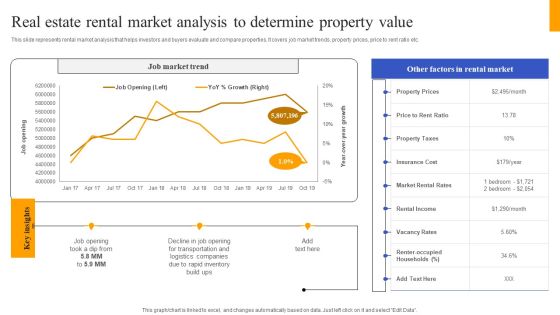
Fix And Flip Method For Renovating Real Estate Real Estate Rental Market Analysis To Determine Designs PDF
This slide represents rental market analysis that helps investors and buyers evaluate and compare properties. It covers job market trends, property prices, price to rent ratio etc. Find highly impressive Fix And Flip Method For Renovating Real Estate Real Estate Rental Market Analysis To Determine Designs PDF on Slidegeeks to deliver a meaningful presentation. You can save an ample amount of time using these presentation templates. No need to worry to prepare everything from scratch because Slidegeeks experts have already done a huge research and work for you. You need to download Fix And Flip Method For Renovating Real Estate Real Estate Rental Market Analysis To Determine Designs PDF for your upcoming presentation. All the presentation templates are 100 percent editable and you can change the color and personalize the content accordingly. Download now.

Convertible Note Pitch Deck Funding Strategy Competitive Analysis By Financial And Operational Data Ppt PowerPoint Presentation Styles Structure PDF
Presenting this set of slides with name convertible note pitch deck funding strategy competitive analysis by financial and operational data ppt powerpoint presentation styles structure pdf. The topics discussed in these slides are competitive factor, existence, locations, product service, quality consumer feedback, sales, profit marg, employee count. This is a completely editable PowerPoint presentation and is available for immediate download. Download now and impress your audience.
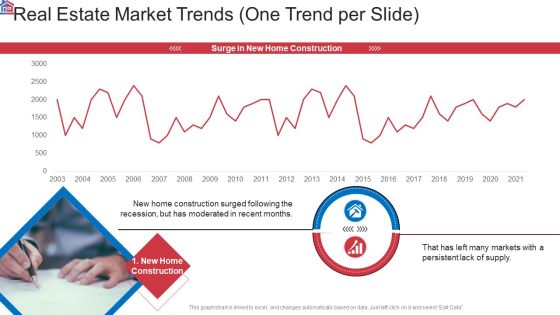
Market Research Analysis Of Housing Sector Real Estate Market Trends One Trend Per Slide Construction Guidelines PDF
Deliver and pitch your topic in the best possible manner with this market research analysis of housing sector real estate market trends one trend per slide construction guidelines pdf. Use them to share invaluable insights on real estate market trends one trend per slide and impress your audience. This template can be altered and modified as per your expectations. So, grab it now.
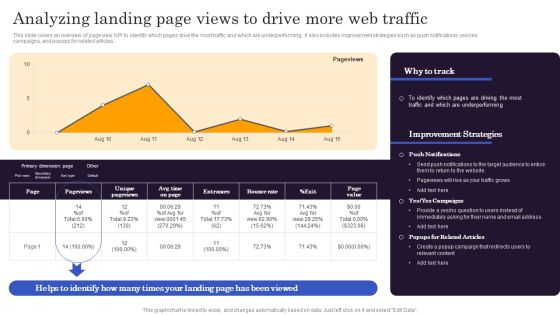
Marketers Guide To Data Analysis Optimization Analyzing Landing Page Views To Drive More Web Traffic Rules PDF
This slide covers an overview of page view KPI to identify which pages drive the most traffic and which are underperforming. It also includes improvement strategies such as push notifications, yes yes campaigns, and popups for related articles. Do you have an important presentation coming up Are you looking for something that will make your presentation stand out from the rest Look no further than Marketers Guide To Data Analysis Optimization Analyzing Landing Page Views To Drive More Web Traffic Rules PDF. With our professional designs, you can trust that your presentation will pop and make delivering it a smooth process. And with Slidegeeks, you can trust that your presentation will be unique and memorable. So why wait Grab Marketers Guide To Data Analysis Optimization Analyzing Landing Page Views To Drive More Web Traffic Rules PDF today and make your presentation stand out from the rest.

Data Interpretation And Analysis Playbook How To Fix The Business Intelligence Problem Data Analytics Playbook Sample PDF
This template covers the solution for BI problems such as analytics transformation and business intelligence program. It also depicts that switching to next-generation analytics platform that gives business users data-driven insights. Presenting data interpretation and analysis playbook how to fix the business intelligence problem data analytics playbook sample pdf to provide visual cues and insights. Share and navigate important information on six stages that need your due attention. This template can be used to pitch topics like analytics, business intelligence, predictive analytics. In addtion, this PPT design contains high resolution images, graphics, etc, that are easily editable and available for immediate download.

Mitigating Sales Risks With Strategic Action Planning Key Metrics To Assess Effectiveness Of Sales Risk Analysis Rules PDF
The following slide highlights some key performance indicators to measure the effectiveness of sales risk evaluation on revenue performance. It includes elements such as opportunities, win rate, average time to win, sales velocity along with key insights etc. Create an editable Mitigating Sales Risks With Strategic Action Planning Key Metrics To Assess Effectiveness Of Sales Risk Analysis Rules PDF that communicates your idea and engages your audience. Whether youre presenting a business or an educational presentation, pre designed presentation templates help save time. Mitigating Sales Risks With Strategic Action Planning Key Metrics To Assess Effectiveness Of Sales Risk Analysis Rules PDF is highly customizable and very easy to edit, covering many different styles from creative to business presentations. Slidegeeks has creative team members who have crafted amazing templates. So, go and get them without any delay.
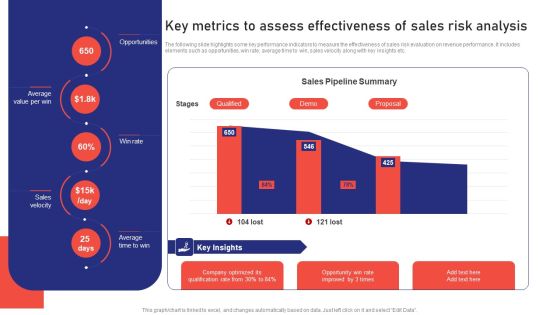
Sales Risk Assessment For Profit Maximization Key Metrics To Assess Effectiveness Of Sales Risk Analysis Ideas PDF
The following slide highlights some key performance indicators to measure the effectiveness of sales risk evaluation on revenue performance. It includes elements such as opportunities, win rate, average time to win, sales velocity along with key insights etc. Get a simple yet stunning designed Sales Risk Assessment For Profit Maximization Key Metrics To Assess Effectiveness Of Sales Risk Analysis Ideas PDF. It is the best one to establish the tone in your meetings. It is an excellent way to make your presentations highly effective. So, download this PPT today from Slidegeeks and see the positive impacts. Our easy to edit Sales Risk Assessment For Profit Maximization Key Metrics To Assess Effectiveness Of Sales Risk Analysis Ideas PDF can be your go to option for all upcoming conferences and meetings. So, what are you waiting for Grab this template today.

Marketers Guide To Data Analysis Optimization Introduction To Paid Search Analytics For Improving Campaign Roi Demonstration PDF
This slide covers a brief overview of paid search analytics to determine campaign returns. It also includes steps for conducting a PPC audit, such as checking location and target settings, evaluating ads, using extensions, assessing keywords, etc. The best PPT templates are a great way to save time, energy, and resources. Slidegeeks have 100 percent editable powerpoint slides making them incredibly versatile. With these quality presentation templates, you can create a captivating and memorable presentation by combining visually appealing slides and effectively communicating your message. Download Marketers Guide To Data Analysis Optimization Introduction To Paid Search Analytics For Improving Campaign Roi Demonstration PDF from Slidegeeks and deliver a wonderful presentation.
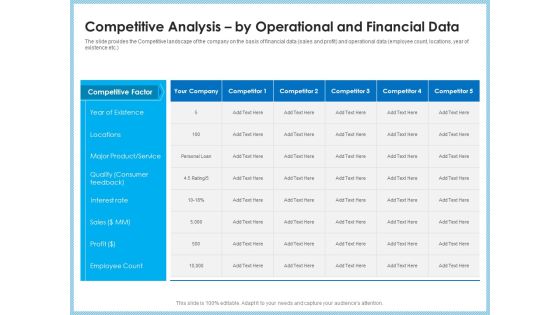
Investment Pitch To Generating Capital From Mezzanine Credit Competitive Analysis By Operational And Financial Data Inspiration PDF
The slide provides the Competitive landscape of the company on the basis of financial data sales and profit and operational data employee count, locations, year of existence etc. Deliver and pitch your topic in the best possible manner with this investment pitch to generating capital from mezzanine credit competitive analysis by operational and financial data inspiration pdf. Use them to share invaluable insights on competitive factor, year existence, locations, major product, service, quality consumer, interest rate and impress your audience. This template can be altered and modified as per your expectations. So, grab it now.
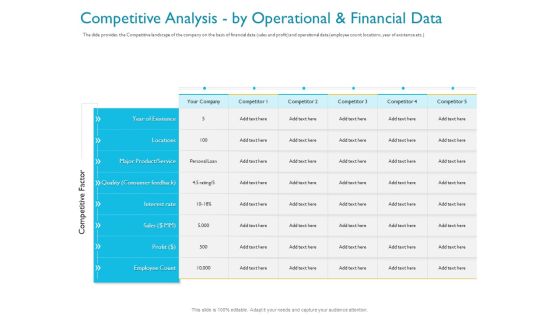
Investor Funding Deck For Hybrid Financing Competitive Analysis By Operational And Financial Data Ppt Pictures Rules PDF
The slide provides the Competitive landscape of the company on the basis of financial data sales and profit and operational data employee count, locations, year of existence etc. Deliver and pitch your topic in the best possible manner with this investor funding deck for hybrid financing competitive analysis by operational and financial data ppt pictures rules pdf. Use them to share invaluable insights on locations, sales, interest rate, major product, service, employee count, quality, consumer feedback and impress your audience. This template can be altered and modified as per your expectations. So, grab it now.

Industry Analysis Of Real Estate And Construction Sector Real Estate Market Trends One Trend Per Slide Construction Download PDF
Deliver and pitch your topic in the best possible manner with this industry analysis of real estate and construction sector real estate market trends one trend per slide construction download pdf. Use them to share invaluable insights on real estate market trends one trend per slide and impress your audience. This template can be altered and modified as per your expectations. So, grab it now.
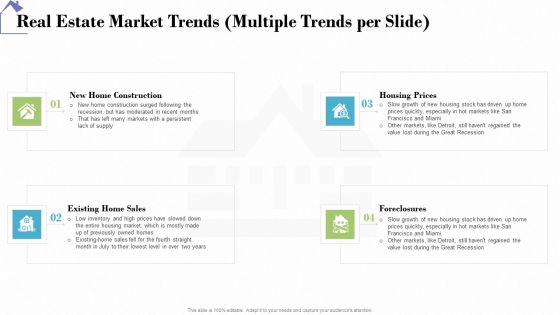
Industry Analysis Of Real Estate And Construction Sector Real Estate Market Trends Multiple Trends Per Slide Portrait PDF
Presenting industry analysis of real estate and construction sector real estate market trends multiple trends per slide portrait pdf to provide visual cues and insights. Share and navigate important information on four stages that need your due attention. This template can be used to pitch topics like new home construction, housing prices, foreclosures, existing home sales. In addtion, this PPT design contains high resolution images, graphics, etc, that are easily editable and available for immediate download.
Marketers Guide To Data Analysis Optimization Tracking Social Media Content Reach For Better Campaign Results Themes PDF
This slide covers an overview of social media content reach to identify the number of people who see your content, either ads or posts. It also includes improvement strategies such as producing high-quality content, increasing the number of images, etc. There are so many reasons you need a Marketers Guide To Data Analysis Optimization Tracking Social Media Content Reach For Better Campaign Results Themes PDF. The first reason is you cannot spend time making everything from scratch, Thus, Slidegeeks has made presentation templates for you too. You can easily download these templates from our website easily.

Gap Analysis Budgeting And Reporting Define Role Of Team Members Ppt PowerPoint Presentation Show Format Ideas PDF
Presenting this set of slides with name gap analysis budgeting and reporting define role of team members ppt powerpoint presentation show format ideas pdf. This is a four stage process. The stages in this process are project leaders, process co ordination role, release management role, performance management role, team. This is a completely editable PowerPoint presentation and is available for immediate download. Download now and impress your audience.

Food Processing Industry Latest Insights Trends And Analytics Analysis Of Meat Segment In Food Manufacturing Industry Inspiration PDF
This slide provides information regarding the market analysis of meat segment in food manufacturing industry in terms of leading states in meat production, species wise meat production, top exported products, opportunities in meat processing technology. Take your projects to the next level with our ultimate collection of Food Processing Industry Latest Insights Trends And Analytics Analysis Of Meat Segment In Food Manufacturing Industry Inspiration PDF. Slidegeeks has designed a range of layouts that are perfect for representing task or activity duration, keeping track of all your deadlines at a glance. Tailor these designs to your exact needs and give them a truly corporate look with your own brand colors they will make your projects stand out from the rest.
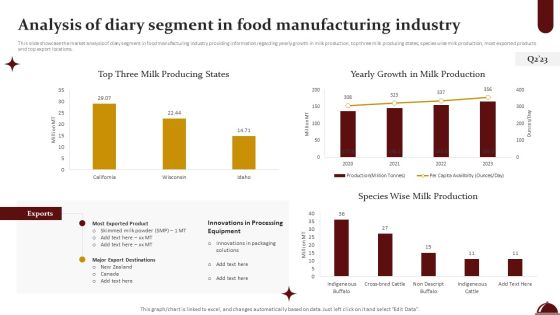
Food Processing Industry Latest Insights Trends And Analytics Analysis Of Diary Segment In Food Manufacturing Industry Mockup PDF
This slide showcase the market analysis of diary segment in food manufacturing industry providing information regarding yearly growth in milk production, top three milk producing states, species wise milk production, most exported products and top export locations. This Food Processing Industry Latest Insights Trends And Analytics Analysis Of Diary Segment In Food Manufacturing Industry Mockup PDF from Slidegeeks makes it easy to present information on your topic with precision. It provides customization options, so you can make changes to the colors, design, graphics, or any other component to create a unique layout. It is also available for immediate download, so you can begin using it right away. Slidegeeks has done good research to ensure that you have everything you need to make your presentation stand out. Make a name out there for a brilliant performance.
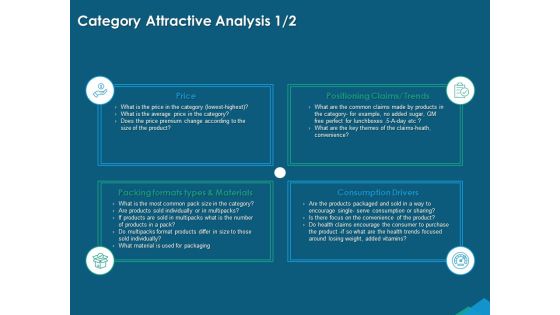
Guide For Managers To Effectively Handle Products Category Attractive Analysis Price Ppt PowerPoint Presentation Show Portrait PDF
Presenting this set of slides with name guide for managers to effectively handle products category attractive analysis price ppt powerpoint presentation show portrait pdf. This is a four stage process. The stages in this process are price, positioning claims trends, packing formats types and materials, consumption drivers. This is a completely editable PowerPoint presentation and is available for immediate download. Download now and impress your audience.

Strategies For Flipping Houses For Maximum Revenue Real Estate Rental Market Analysis Determine Property Value Download PDF
This slide represents rental market analysis that helps investors and buyers evaluate and compare properties. It covers job market trends, property prices, price to rent ratio etc. Are you in need of a template that can accommodate all of your creative concepts This one is crafted professionally and can be altered to fit any style. Use it with Google Slides or PowerPoint. Include striking photographs, symbols, depictions, and other visuals. Fill, move around, or remove text boxes as desired. Test out color palettes and font mixtures. Edit and save your work, or work with colleagues. Download Strategies For Flipping Houses For Maximum Revenue Real Estate Rental Market Analysis Determine Property Value Download PDF and observe how to make your presentation outstanding. Give an impeccable presentation to your group and make your presentation unforgettable.
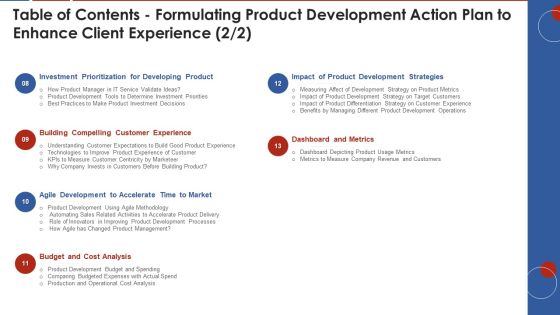
Table Of Contents Formulating Product Development Action Plan To Enhance Client Experience Metrics Themes PDF
Deliver and pitch your topic in the best possible manner with this table of contents formulating product development action plan to enhance client experience metrics themes pdf. Use them to share invaluable insights on investment prioritization, agile development, cost analysis, dashboard and metrics, development strategies and impress your audience. This template can be altered and modified as per your expectations. So, grab it now.

Dynamic Costing Process Workflow Framework Professional PDF
The following slide showcases a framework of dynamic pricing process to capitalize on ever changing market conditions. It includes key elements such as supply, demand, customer data, competitors prices, substitute product prices, ML training, data collection, etc. Showcasing this set of slides titled Dynamic Costing Process Workflow Framework Professional PDF. The topics addressed in these templates are Customer Data, Competition Prices, Demand. All the content presented in this PPT design is completely editable. Download it and make adjustments in color, background, font etc. as per your unique business setting.
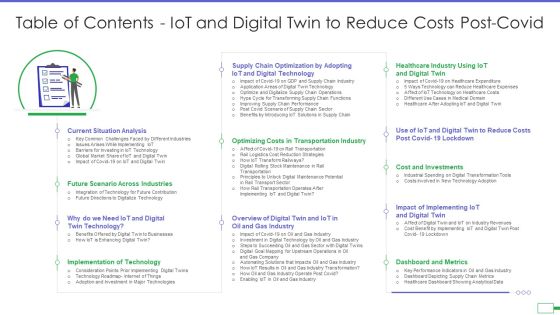
Table Of Contents Iot And Digital Twin To Reduce Costs Post Covid Background PDF
Presenting table of contents iot and digital twin to reduce costs post covid background pdf to provide visual cues and insights. Share and navigate important information on one stages that need your due attention. This template can be used to pitch topics like analysis, technology, dashboard and metrics, cost and investments. In addtion, this PPT design contains high resolution images, graphics, etc, that are easily editable and available for immediate download.

Developing New Sales And Marketing Strategic Approach Marketing Campaign Dashboard Ppt PowerPoint Presentation Infographic Template Slide Portrait PDF
Presenting this set of slides with name developing new sales and marketing strategic approach marketing campaign dashboard ppt powerpoint presentation infographic template slide portrait pdf. The topics discussed in these slides are impressions, acquisitions, cost per acquisition, click through rate, cost per click. This is a completely editable PowerPoint presentation and is available for immediate download. Download now and impress your audience.

Retail Kpi Dashboard Showing Sales Revenue Customers And Out Of Stock Items Ppt PowerPoint Presentation Outline Example
This is a retail kpi dashboard showing sales revenue customers and out of stock items ppt powerpoint presentation outline example. This is a three stage process. The stages in this process are finance, marketing, management, investment, analysis.

Retail Kpi Dashboard Showing Total Sales Per Labor Hour Sales By Unit Area Ppt PowerPoint Presentation Styles Influencers
This is a retail kpi dashboard showing total sales per labor hour sales by unit area ppt powerpoint presentation styles influencers. This is a three stage process. The stages in this process are finance, marketing, management, investment, analysis.
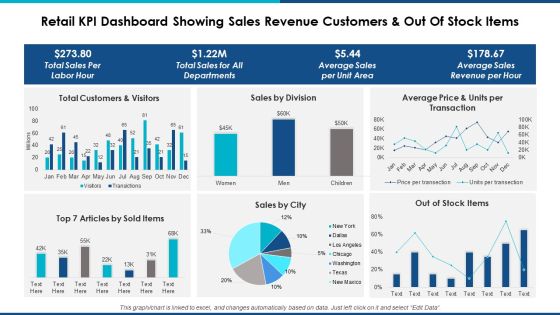
Retail Kpi Dashboard Showing Sales Revenue Customers And Out Of Stock Items Ppt Powerpoint Presentation Professional Background Designs
This is a retail kpi dashboard showing sales revenue customers and out of stock items ppt powerpoint presentation professional background designs. This is a six stage process. The stages in this process are finance, marketing, management, investment, analysis.
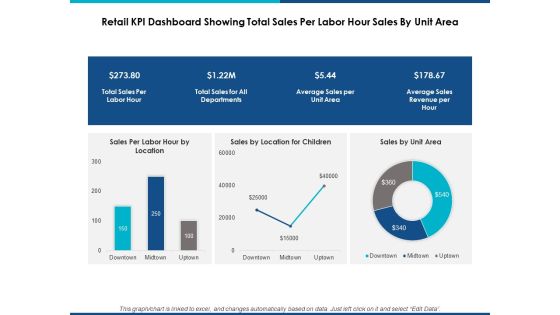
Retail Kpi Dashboard Showing Total Sales Per Labor Hour Sales By Unit Area Ppt Powerpoint Presentation Show Graphic Tips
This is a retail kpi dashboard showing total sales per labor hour sales by unit area ppt powerpoint presentation show graphic tips. This is a three stage process. The stages in this process are finance, marketing, management, investment, analysis.

Retail Kpi Dashboard Showing Revenue Vs Units Sold Top 5 Product Categories Ppt PowerPoint Presentation Layouts Designs Download
This is a retail kpi dashboard showing revenue vs units sold top 5 product categories ppt powerpoint presentation layouts designs download. This is a four stage process. The stages in this process are finance, strategy, analysis, marketing.
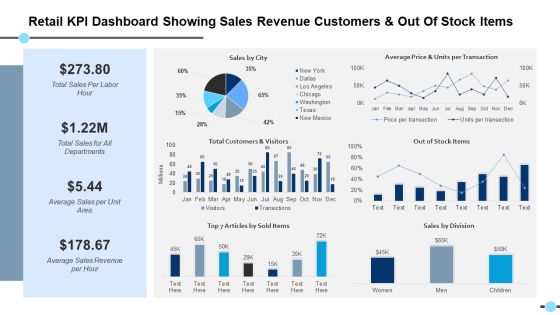
Retail Kpi Dashboard Showing Sales Revenue Customers And Out Of Stock Items Out Of Stock Items Ppt PowerPoint Presentation Files
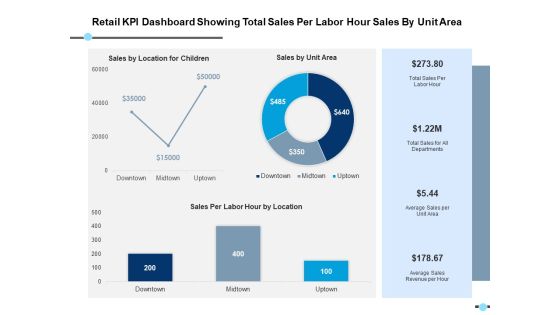
Retail Kpi Dashboard Showing Total Sales Per Labor Hour Sales By Unit Area Ppt PowerPoint Presentation Model Format
This is a retail kpi dashboard showing total sales per labor hour sales by unit area ppt powerpoint presentation model format. This is a three stage process. The stages in this process are finance, strategy, analysis, marketing.

Business Intelligence Dashboards Presentation Slides
This is a business intelligence dashboards presentation slides. This is a seven stage process. The stages in this process are strategy formulation, planning, resource allocation, budgeting forecasting, reporting, monitoring, analysis, additional use of dashboards, most typical use of dashboard.
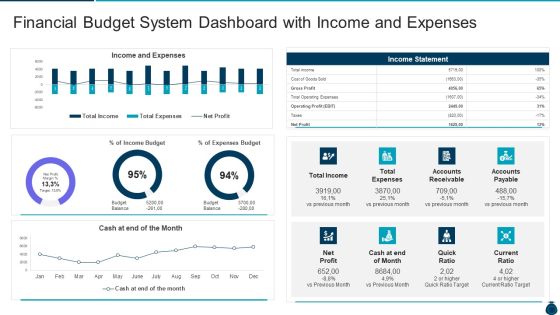
Key Elements And Techniques Of A Budgeting System Financial Budget System Dashboard With Income And Expenses Rules PDF
Deliver an awe inspiring pitch with this creative key elements and techniques of a budgeting system financial budget system dashboard with income and expenses rules pdf bundle. Topics like financial budget system dashboard with income and expenses can be discussed with this completely editable template. It is available for immediate download depending on the needs and requirements of the user.
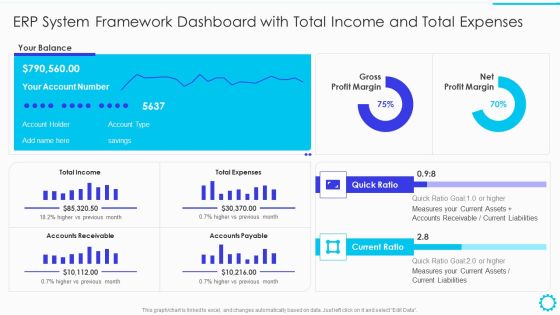
Summary Of Cloud ERP System Framework ERP System Framework Dashboard With Total Income And Total Expenses Guidelines PDF
Deliver an awe inspiring pitch with this creative Summary Of Cloud ERP System Framework ERP System Framework Dashboard With Total Income And Total Expenses Guidelines PDF bundle. Topics like ERP System Framework Dashboard With Total Income And Total Expenses can be discussed with this completely editable template. It is available for immediate download depending on the needs and requirements of the user.
Modern Security Observation Plan To Eradicate Cybersecurity Risk And Data Breach Security Monitoring Dashboard With Malicious Icons PDF
Deliver an awe inspiring pitch with this creative modern security observation plan to eradicate cybersecurity risk and data breach security monitoring dashboard with malicious icons pdf bundle. Topics like security monitoring dashboard with malicious requests and average latency rate can be discussed with this completely editable template. It is available for immediate download depending on the needs and requirements of the user.

Key Prioritization Techniques For Project Team Management Project Management Dashboard Tool Ppt PowerPoint Presentation Professional Pictures PDF
Presenting this set of slides with name key prioritization techniques for project team management project management dashboard tool ppt powerpoint presentation professional pictures pdf. The topics discussed in these slides are project management dashboard tool. This is a completely editable PowerPoint presentation and is available for immediate download. Download now and impress your audience.

Team Performance Improvement Functional Optimization Through Agile Methodologies Agile Project Status Dashboard With Story Details Diagrams PDF
The following slide shows Agile Project Status Dashboard with project summary, story details, possible risks and mitigation strategies, team velocity, project status, percentage of budget spent etc. Deliver and pitch your topic in the best possible manner with this team performance improvement functional optimization through agile methodologies agile project status dashboard with story details diagrams pdf. Use them to share invaluable insights on agile project status dashboard with story details and impress your audience. This template can be altered and modified as per your expectations. So, grab it now.
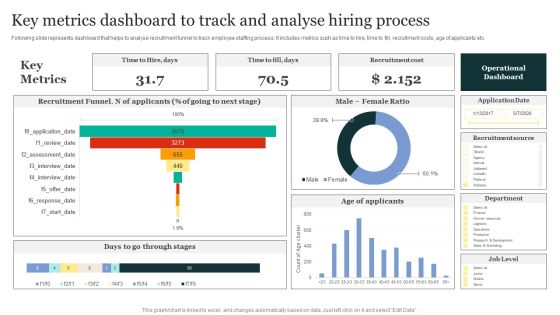
Strategic Approaches To Efficient Candidate Selection Key Metrics Dashboard To Track And Analyse Hiring Process Template PDF
Following slide represents dashboard that helps to analyse recruitment funnel to track employee staffing process. It includes metrics such as time to hire, time to fill, recruitment costs, age of applicants etc. Welcome to our selection of the Strategic Approaches To Efficient Candidate Selection Key Metrics Dashboard To Track And Analyse Hiring Process Template PDF. These are designed to help you showcase your creativity and bring your sphere to life. Planning and Innovation are essential for any business that is just starting out. This collection contains the designs that you need for your everyday presentations. All of our PowerPoints are 100 percent editable, so you can customize them to suit your needs. This multi-purpose template can be used in various situations. Grab these presentation templates today

Techniques For Effective Supply Chain Management KPI Dashboard To Assess Performance Of Order And Shipments Structure PDF
This slide covers KPI dashboard to assess performance of integrating warehouse management system. It involves key details such as overall warehouse operating costs, perfect order rate and total number of shipments. Boost your pitch with our creative Techniques For Effective Supply Chain Management KPI Dashboard To Assess Performance Of Order And Shipments Structure PDF. Deliver an awe-inspiring pitch that will mesmerize everyone. Using these presentation templates you will surely catch everyones attention. You can browse the ppts collection on our website. We have researchers who are experts at creating the right content for the templates. So you do not have to invest time in any additional work. Just grab the template now and use them.

Strategy To Enhance Supply Chain Operations KPI Dashboard To Assess Performance Of Order And Shipments Professional PDF
This slide covers KPI dashboard to assess performance of integrating warehouse management system. It involves key details such as overall warehouse operating costs, perfect order rate and total number of shipments. Slidegeeks has constructed Strategy To Enhance Supply Chain Operations KPI Dashboard To Assess Performance Of Order And Shipments Professional PDF after conducting extensive research and examination. These presentation templates are constantly being generated and modified based on user preferences and critiques from editors. Here, you will find the most attractive templates for a range of purposes while taking into account ratings and remarks from users regarding the content. This is an excellent jumping off point to explore our content and will give new users an insight into our top notch PowerPoint Templates.
