AI PPT Maker
Templates
PPT Bundles
Design Services
Business PPTs
Business Plan
Management
Strategy
Introduction PPT
Roadmap
Self Introduction
Timelines
Process
Marketing
Agenda
Technology
Medical
Startup Business Plan
Cyber Security
Dashboards
SWOT
Proposals
Education
Pitch Deck
Digital Marketing
KPIs
Project Management
Product Management
Artificial Intelligence
Target Market
Communication
Supply Chain
Google Slides
Research Services
 One Pagers
All Categories
-
Home
- Customer Favorites
- Correlation
Correlation
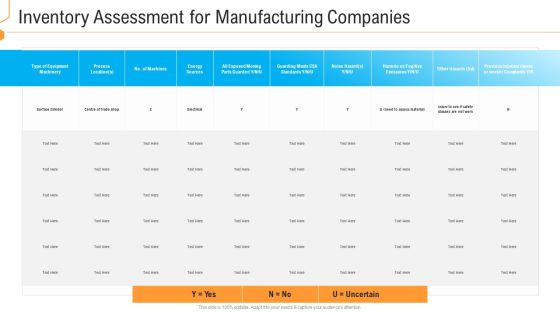
Inventory Assessment For Manufacturing Companies Diagrams PDF
Deliver an awe inspiring pitch with this creative inventory assessment for manufacturing companies diagrams pdf bundle. Topics like inventory assessment for manufacturing companies can be discussed with this completely editable template. It is available for immediate download depending on the needs and requirements of the user.

Companys Valuation Table With Financials Infographics PDF
This slide provides the companys valuations through discounted free cash flows with Enterprise Value and Equity Value.Deliver an awe-inspiring pitch with this creative companys valuation table with financials infographics pdf. bundle. Topics like market value, 2019 to 2023 can be discussed with this completely editable template. It is available for immediate download depending on the needs and requirements of the user.
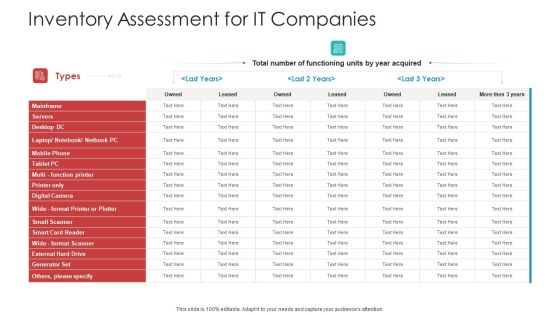
Inventory Assessment For IT Companies Designs PDF
Deliver an awe inspiring pitch with this creative inventory assessment for it companies designs pdf bundle. Topics like inventory assessment for it companies can be discussed with this completely editable template. It is available for immediate download depending on the needs and requirements of the user.

Guide To Mergers And Acquisitions Post Merger And Acquisition Performance Gap Assessment Template PDF
Following slide shows the comparison of current versus target capabilities of the firm post merger and acquisition. It includes information about the companys score as well as a performance rating. Take your projects to the next level with our ultimate collection of Guide To Mergers And Acquisitions Post Merger And Acquisition Performance Gap Assessment Template PDF. Slidegeeks has designed a range of layouts that are perfect for representing task or activity duration, keeping track of all your deadlines at a glance. Tailor these designs to your exact needs and give them a truly corporate look with your own brand colors they will make your projects stand out from the rest.
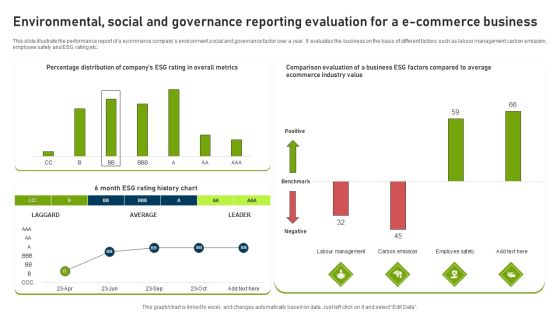
Environmental Social And Governance Reporting Evaluation For A E Commerce Business Template PDF
This slide illustrate the performance report of a ecommerce companys environment,social and governance factor over a year. It evaluates the business on the basis of different factors such as labour management,carbon emission, employee safety and ESG rating etc. Pitch your topic with ease and precision using this Environmental Social And Governance Reporting Evaluation For A E Commerce Business Template PDF. This layout presents information on Comparison Evaluation, Business, Ecommerce Industry Value. It is also available for immediate download and adjustment. So, changes can be made in the color, design, graphics or any other component to create a unique layout.
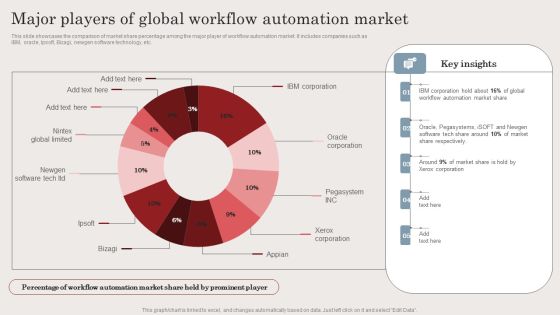
Major Players Of Global Workflow Automation Market Ppt Infographics Design Templates PDF
This slide showcases the comparison of market share percentage among the major player of workflow automation market. It includes companies such as IBM, oracle, Ipsoft, Bizagi, newgen software technology, etc. Take your projects to the next level with our ultimate collection of Major Players Of Global Workflow Automation Market Ppt Infographics Design Templates PDF. Slidegeeks has designed a range of layouts that are perfect for representing task or activity duration, keeping track of all your deadlines at a glance. Tailor these designs to your exact needs and give them a truly corporate look with your own brand colors they will make your projects stand out from the rest.
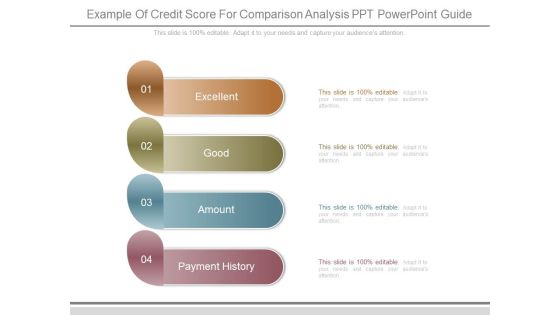
Example Of Credit Score For Comparison Analysis Ppt Powerpoint Guide
This is a example of credit score for comparison analysis ppt powerpoint guide. This is a four stage process. The stages in this process are excellent, good, amount, payment history.
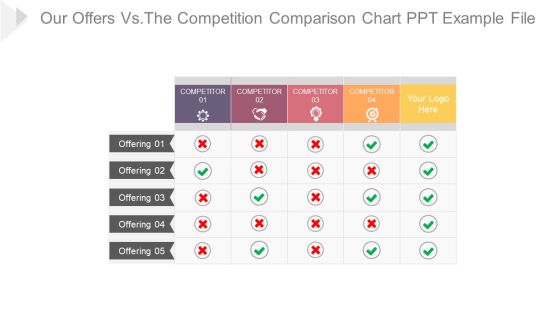
Our Offers Vs The Competition Comparison Chart Ppt Example File
This is a our offers vs the competition comparison chart ppt example file. This is a five stage process. The stages in this process are compare, table, management, business, strategy.

Comparison Of Pricing Strategy Diagram Presentation Background Images
This is a comparison of pricing strategy diagram presentation background images. This is a three stage process. The stages in this process are competition based pricing, cost based pricing, value based pricing.

Competition Comparison Table With New Criteria Powerpoint Ideas
This is a competition comparison table with new criteria powerpoint ideas. This is a seven stage process. The stages in this process are revenu, profit, market share, main activity, number of employee, product quality, insert your text.

Comparison Between Old And New Communication Powerpoint Guide
This is a comparison between old and new communication powerpoint guide. This is a four stage process. The stages in this process are medium used, medium preferred, telephone, email, face to face, live web chat.

Comparison Chart For Male And Female Employment Powerpoint Shapes
This is a comparison chart for male and female employment powerpoint shapes. This is a two stage process. The stages in this process are female 72 percent, male 54 percent.

Sales Performance Comparison In Multiple Locations Ppt Slides
This is a sales performance comparison in multiple locations ppt slides. This is a two stage process. The stages in this process are business, marketing, location, finance, strategy, analysis.

Product Features Comparison Table Ppt PowerPoint Presentation Example 2015
This is a product features comparison table ppt powerpoint presentation example 2015. This is a ten stage process. The stages in this process are business, strategy, marketing, table, product, management.
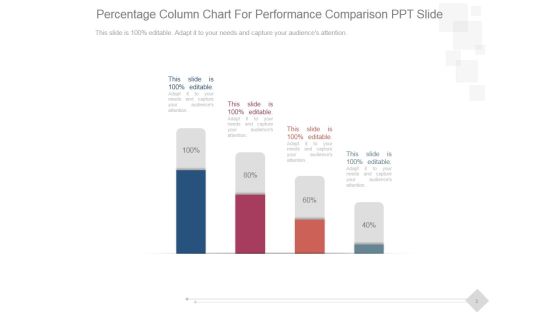
Percentage Column Chart For Performance Comparison Ppt PowerPoint Presentation Good
This is a percentage column chart for performance comparison ppt powerpoint presentation good. This is a four stage process. The stages in this process are business, marketing, technology, presentation, management.
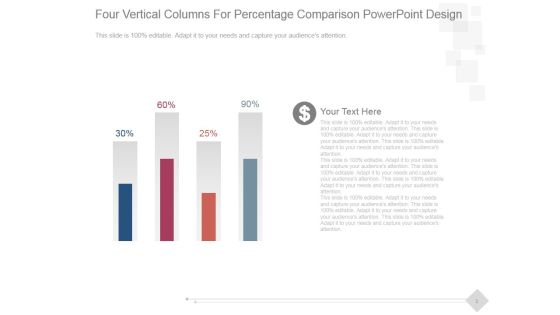
Four Vertical Columns For Percentage Comparison Ppt PowerPoint Presentation Introduction
This is a four vertical columns for percentage comparison ppt powerpoint presentation introduction. This is a four stage process. The stages in this process are business, marketing, success, management, presentation.

Male Vs Female Work Productivity Comparison Ppt PowerPoint Presentation Slides
This is a male vs female work productivity comparison ppt powerpoint presentation slides. This is a two stage process. The stages in this process are finance, business, percentage, compare, marketing.

Budgeting Planned Actual Comparison Ppt PowerPoint Presentation Deck
This is a budgeting planned actual comparison ppt powerpoint presentation deck. This is a two stage process. The stages in this process are planned cost, actual cost, value difference.

Budgeting Planned Actual Comparison Ppt PowerPoint Presentation Graphics
This is a budgeting planned actual comparison ppt powerpoint presentation graphics. This is a two stage process. The stages in this process are value difference, actual cost, planned cost, type of cost.

Budgeting Planned Actual Comparison Ppt PowerPoint Presentation Portfolio
This is a budgeting planned actual comparison ppt powerpoint presentation portfolio. This is a three stage process. The stages in this process are business, strategy, marketing, analysis, success, bar graph.

Budgeting Planned Actual Comparison Ppt PowerPoint Presentation Shapes
This is a budgeting planned actual comparison ppt powerpoint presentation shapes. This is a three stage process. The stages in this process are planned cost, actual cost, value difference, finance, timeline.
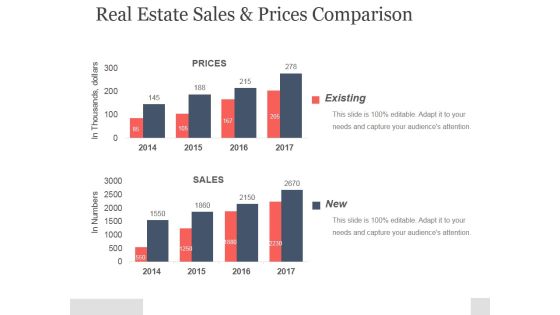
Real Estate Sales And Prices Comparison Ppt PowerPoint Presentation Example
This is a real estate sales and prices comparison ppt powerpoint presentation example. This is a two stage process. The stages in this process are existing, prices, sales, in thousands, dollars.

Current State Analysis Financial Comparison Ppt PowerPoint Presentation Gallery Professional
This is a current state analysis financial comparison ppt powerpoint presentation gallery professional. This is a five stage process. The stages in this process are business, marketing, process, growth, management.

Budgeting Planned Actual Comparison Ppt PowerPoint Presentationpictures Files
This is a budgeting planned actual comparison ppt powerpoint presentationpictures files. This is a two stage process. The stages in this process are deviation, planned costs vs actual costs, planned cost, actual cost.

Current State Analysis Financial Comparison Ppt PowerPoint Presentation Inspiration Good
This is a current state analysis financial comparison ppt powerpoint presentation inspiration good. This is a five stage process. The stages in this process are revenue, profits, cash balance, competitor.

Budgeting Planned Actual Comparison Ppt PowerPoint Presentation Pictures Elements
This is a budgeting planned actual comparison ppt powerpoint presentation pictures elements. This is a two stage process. The stages in this process are type of cost, planned cost, actual cost, value difference.

competition comparison table ppt powerpoint presentation infographics design inspiration
This is a competition comparison table ppt powerpoint presentation infographics design inspiration. This is a seven stage process. The stages in this process are revenue, profit, market share, main activity, number of employee.
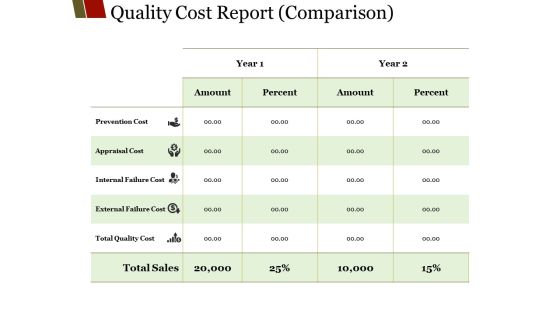
Quality Cost Report Comparison Ppt PowerPoint Presentation Visual Aids Model
This is a quality cost report comparison ppt powerpoint presentation visual aids model. This is a five stage process. The stages in this process are amount, percent, year, prevention cost, prevention cost.

Quality Cost Report Comparison Ppt PowerPoint Presentation Model Portfolio
This is a quality cost report comparison ppt powerpoint presentation model portfolio. This is a two stage process. The stages in this process are prevention cost, appraisal cost, internal failure cost, external failure cost, total quality cost.

Comparison Based On Criteria Ppt PowerPoint Presentation Outline Pictures
This is a comparison based on criteria ppt powerpoint presentation outline pictures. This is a six stage process. The stages in this process are revenue, profit, market share, main activity, number of employee.

Comparison Based On Criteria Ppt PowerPoint Presentation Show Icon
This is a comparison based on criteria ppt powerpoint presentation show icon. This is a six stage process. The stages in this process are revenue, profit, market share, main activity, number of employee.

Comparison Based On Criteria Ppt PowerPoint Presentation Gallery Themes
This is a comparison based on criteria ppt powerpoint presentation gallery themes. This is a seven stage process. The stages in this process are revenue, profit, market share, main activity, product quality.

Comparison Based On Criteria Ppt PowerPoint Presentation Gallery Sample
This is a comparison based on criteria ppt powerpoint presentation gallery sample. This is a six stage process. The stages in this process are revenue, profit, market share, main activity, number of employee.

Comparison Based On Criteria Ppt PowerPoint Presentation Icon Example Introduction
This is a comparison based on criteria ppt powerpoint presentation icon example introduction. This is a six stage process. The stages in this process are criteria, revenue, profit, market share, main activity.

Comparison Based On Criteria Ppt PowerPoint Presentation Show File Formats
This is a comparison based on criteria ppt powerpoint presentation show file formats. This is a six stage process. The stages in this process are revenue, profit, market share, main activity, number of employee.

Budgeting Planned Actual Comparison Ppt PowerPoint Presentation Portfolio Background
This is a budgeting planned actual comparison ppt powerpoint presentation portfolio background. This is a three stage process. The stages in this process are planned cost, actual cost, value difference, deviation, bar graph.

Budgeting Planned Actual Comparison Ppt PowerPoint Presentation Gallery Graphic Tips
This is a budgeting planned actual comparison ppt powerpoint presentation gallery graphic tips. This is a three stage process. The stages in this process are planned cost, actual cost, value difference.

Budgeting Planned Actual Comparison Ppt PowerPoint Presentation Visual Aids Outline
This is a budgeting planned actual comparison ppt powerpoint presentation visual aids outline. This is a three stage process. The stages in this process are planned cost, actual cost, value difference.

Budgeting Planned Actual Comparison Ppt PowerPoint Presentation Icon Clipart Images
This is a budgeting planned actual comparison ppt powerpoint presentation icon clipart images. This is a two stage process. The stages in this process are planned cost, actual cost, compare, finance, business.

Budgeting Planned Actual Comparison Ppt PowerPoint Presentation Portfolio Information
This is a budgeting planned actual comparison ppt powerpoint presentation portfolio information. This is a three stage process. The stages in this process are planned cost, actual cost, deviation.

Budgeting Planned Actual Comparison Ppt PowerPoint Presentation Portfolio Display
This is a budgeting planned actual comparison ppt powerpoint presentation portfolio display. This is a three stage process. The stages in this process are type of cost, planned cost, actual cost, deviation, value difference.

Comparison Based On Criteria Ppt PowerPoint Presentation Infographics Elements
This is a comparison based on criteria ppt powerpoint presentation infographics elements. This is a four stage process. The stages in this process are design, price, performance, product, competitor.

Comparison Based On Criteria Ppt PowerPoint Presentation Styles Show
This is a comparison based on criteria ppt powerpoint presentation styles show. This is a four stage process. The stages in this process are own business, design, price, performance, quality.

Comparison Based On Criteria Ppt PowerPoint Presentation Inspiration
This is a comparison based on criteria ppt powerpoint presentation inspiration. This is a four stage process. The stages in this process are design, price, performance, quality, additional functions.

Comparison Based On Criteria Ppt PowerPoint Presentation Inspiration Graphic Tips
This is a comparison based on criteria ppt powerpoint presentation inspiration graphic tips. This is afour stage process. The stages in this process are design, price, quality, additional functions, equipment.

Comparison Based On Criteria Ppt PowerPoint Presentation Summary Good
This is a comparison based on criteria ppt powerpoint presentation summary good. This is a four stage process. The stages in this process are product, design, price, performance, quality.

Valuation Methods Comparison Ppt PowerPoint Presentation Inspiration Background Images
This is a valuation methods comparison ppt powerpoint presentation inspiration background images. This is a two stage process. The stages in this process are valuation method, results, comments, internal rate of return, net present value.

Valuation Methods Comparison Ppt PowerPoint Presentation Ideas Picture
This is a valuation methods comparison ppt powerpoint presentation ideas picture. This is a two stage process. The stages in this process are valuation method, results, comments, business, marketing.
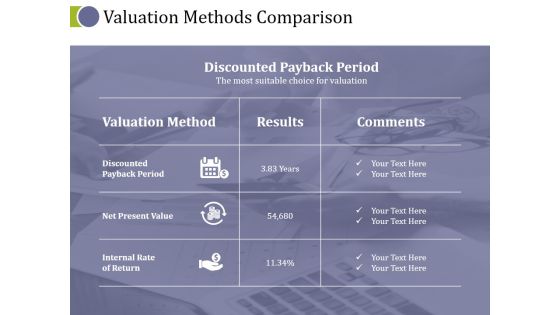
Valuation Methods Comparison Ppt PowerPoint Presentation Ideas Background Image
This is a valuation methods comparison ppt powerpoint presentation ideas background image. This is a two stage process. The stages in this process are valuation method, discounted payback period, net present value, internal rate of return.
Valuation Methods Comparison Ppt PowerPoint Presentation Icon Graphic Tips
This is a valuation methods comparison ppt powerpoint presentation icon graphic tips. This is a two stage process. The stages in this process are compare, business, marketing, strategy, management.
Quality Cost Report Comparison Ppt PowerPoint Presentation Icon Background Designs
This is a quality cost report comparison ppt powerpoint presentation icon background designs. This is a two stage process. The stages in this process are compare, business, table, marketing, strategy.
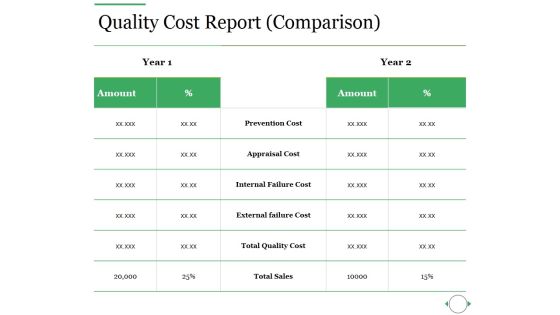
Quality Cost Report Comparison Ppt PowerPoint Presentation Ideas Slides
This is a quality cost report comparison ppt powerpoint presentation ideas slides. This is a two stage process. The stages in this process are prevention cost, appraisal cost, internal failure cost, external failure cost, total quality cost.
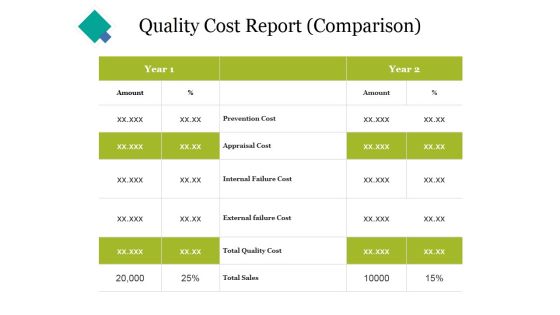
Quality Cost Report Comparison Ppt PowerPoint Presentation Portfolio Themes
This is a quality cost report comparison ppt powerpoint presentation portfolio themes. This is a two stage process. The stages in this process are prevention cost, appraisal cost, internal failure cost, external failure cost, total quality cost.

quality cost report comparison ppt powerpoint presentation portfolio information
This is a quality cost report comparison ppt powerpoint presentation portfolio information. This is a two stage process. The stages in this process are prevention cost, appraisal cost, internal failure cost, external failure cost, total quality cost.

Comparison Based On Criteria Ppt PowerPoint Presentation Slides Skills
This is a comparison based on criteria ppt powerpoint presentation slides skills. This is a five stage process. The stages in this process are revenue, profit, market share, main activity, number of employees, product quality.

Comparison Based On Criteria Ppt PowerPoint Presentation Show Outline
This is a comparison based on criteria ppt powerpoint presentation show outline. This is a six stage process. The stages in this process are revenue, profit, market share, main activity, number of employees.

Comparison Based On Criteria Ppt PowerPoint Presentation Show Graphics Pictures
This is a comparison based on criteria ppt powerpoint presentation show graphics pictures. This is a seven stage process. The stages in this process are competitor, revenue, profit, market share, main activity.

Comparison Based On Criteria Ppt PowerPoint Presentation Styles Picture
This is a comparison based on criteria ppt powerpoint presentation styles picture. This is a five stage process. The stages in this process are competitor, revenue, profit, criteria, market share.

Comparison Based On Criteria Ppt PowerPoint Presentation Styles Designs
This is a comparison based on criteria ppt powerpoint presentation styles designs. This is a three stage process. The stages in this process are revenue, profit, market share, main activity, number of employees, product quality.

Budgeting Planned Actual Comparison Ppt PowerPoint Presentation Show Background Image
This is a budgeting planned actual comparison ppt powerpoint presentation show background image. This is a three stage process. The stages in this process are planned cost, actual cost, value difference, deviation.
