AI PPT Maker
Templates
PPT Bundles
Design Services
Business PPTs
Business Plan
Management
Strategy
Introduction PPT
Roadmap
Self Introduction
Timelines
Process
Marketing
Agenda
Technology
Medical
Startup Business Plan
Cyber Security
Dashboards
SWOT
Proposals
Education
Pitch Deck
Digital Marketing
KPIs
Project Management
Product Management
Artificial Intelligence
Target Market
Communication
Supply Chain
Google Slides
Research Services
 One Pagers
All Categories
-
Home
- Customer Favorites
- Corporate Banking
Corporate Banking

Stock Photo Blue Globe With Golden Dollar Coins PowerPoint Slide
Be The Doer With Our stock photo blue globe with golden dollar coins powerpoint slide Powerpoint Templates. Put Your Thoughts Into Practice.
Stock Photo Blue Like Symbol With Shopping Cart PowerPoint Slide
Our stock photo blue like symbol with shopping cart powerpoint slide Powerpoint Templates Team Are A Dogged Lot. They Keep At It Till They Get It Right.

Stock Photo Illustration Of Four Soccer Balls PowerPoint Slide
Our stock photo illustration of four soccer balls powerpoint slide Powerpoint Templates Leave No One In Doubt. Provide A Certainty To Your Views.
Stock Photo Increasing Stack Of Coins Around Globe PowerPoint Slide
Our stock photo increasing stack of coins around globe powerpoint slide Powerpoint Templates Heighten Concentration. Your Audience Will Be On The Edge.
Stock Photo Increasing Stack Of Coins With Globe PowerPoint Slide
Edit Your Work With Our stock photo increasing stack of coins with globe powerpoint slide Powerpoint Templates. They Will Help You Give The Final Form.
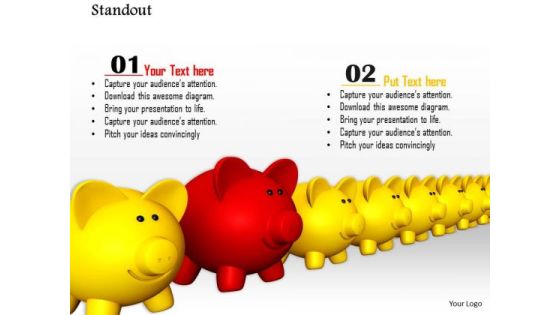
Stock Photo Red Piggy Stand Out From Others PowerPoint Slide
Open Up Doors That Lead To Success. Our Stock Photo Red Piggy Stand Out From Others Powerpoint Slide Powerpoint Templates Provide The Handles.

Stock Photo 50 Percent Discount With Shopping Cart PowerPoint Slide
This image of 50 percent discount with shopping cart is very useful for presentations on shopping and purchasing. Discount and sale concepts can also be described with this image slide. Create eye-catching presentation using this image.
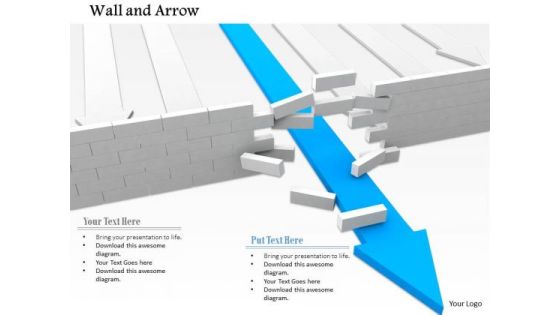
Stock Photo Blue Arrow Breaking The Concrete Wall PowerPoint Slide
Blue colored arrow is used in this power point image template. This arrows is crossing the concrete wall which shows the success concept and wall is used as a hurdle in success path. Display success and hard work related concepts with the help of this image.

Stock Photo Cart Full With Discount Symbols PowerPoint Slide
The above image shows shopping cart full with discount. This image is designed to represent concept of shopping, sale and discount. Our unique image makes your presentations more professional.

Stock Photo Cart With 15 Percent Discount Sale Concept PowerPoint Slide
The above image is designed with 15 percent discount with shopping cart. This image is designed to represent concept of shopping, sale and discount. Our unique image makes your presentations more professional.

Stock Photo Cart With Twenty Percent Discount PowerPoint Slide
The above image is designed with 20 percent discount with shopping cart. This image is designed to represent concept of shopping, sale and discount. Our unique image makes your presentations more professional.
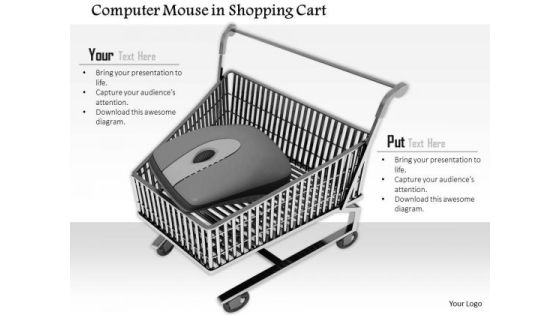
Stock Photo Computer Mouse In Shopping Cart For Online Shopping PowerPoint Slide
Our above image has been designed with computer mouse in shopping cart. This image is well designed to portray concepts of online shopping. Use this shopping cart image to make outstanding presentations.

Stock Photo Concept Of 100 Percent Target Achivement PowerPoint Slide
This pre-designed image signifies the concept of 100 percent target achievement. This Image is carefully designed to look interesting and informative. Use this theme to give unified look to your presentations.

Stock Photo Golden Batch With 24 Hours Online Text PowerPoint Slide
Our unique image is designed with golden wreath award for 3rd winner. This image clearly defines the award, win bravery, merit etc. Special effects of this image will surely interest the audience.

Stock Photo 3d House With Sale Board PowerPoint Slide
Concept of sale in real-estate is well defined in this graphic image. To display this concept we have used graphic of 3d house with sale board. This image is designed for real-estate and marketing strategy related topics.

Stock Photo Graphics Of Golden Laurel For Game Winners PowerPoint Slide
This image slide displays golden laurels for game winners . This image slide has been crafted with graphic of golden color laurel with text space. You may change size, color and orientation of any icon to your liking. Use this PowerPoint template, in your presentations to express views on success and achievements. This image slide may also be used in games presentations to represent championship. This image slide will enhance the quality of your presentations.

Stock Photo Laurel Award For Number One Winner PowerPoint Slide
This image slide displays laurel award for winner. This image slide has been crafted with graphic of golden color laurel with number one. You may change size, color and orientation of any icon to your liking. Use this PowerPoint template, in your presentations to express views on success and achievements. This image slide may also be used in games presentations to represent championship. This image slide will enhance the quality of your presentations.
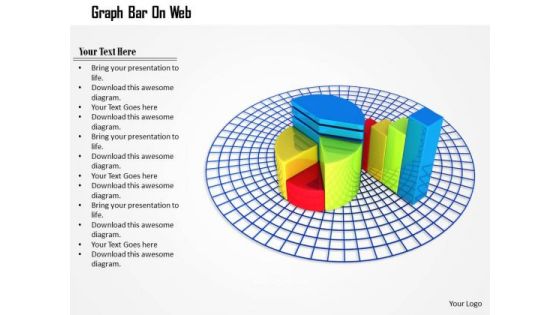
Stock Photo Pie Chart And Bar Graph On Web PowerPoint Slide
This image is designed with pie chart and bar graph on web. Use this diagram to explain your strategy to co-ordinate activities. Deliver amazing presentations to mesmerize your audience.

Stock Photo Twisted Arrows Around Bars PowerPoint Slide
This conceptual image displays graphics of bar graph. This image of bar graph can be used to show growth in sales or profit. Pass your ideas through this image slide in relation to profit growth.

Stock Photo 3d Sale Text With Upward Arrow PowerPoint Slide
You can illustrate your ideas and imprint them in the minds of your team with this image. It contains 3d sale word with upward arrow. You have some highly profitable plans. Display those plans with the use if this professional image graphics.

Stock Photo Arrow Jumping Over Hurdles PowerPoint Slide
You can illustrate your ideas and imprint them in the minds of your team with this image. It caintains image of arrow jumping over hurdles. This image is meant to depict hurdles, challenges, deadlines, competition and a contest.

Stock Photo Four Colored Labels On White Background PowerPoint Slide
This image has backdrop colorful batches for winner. This unique image contains graphic of winner medals. This image enables you to communicate your ideas in your presentation related to winner, award, success etc.
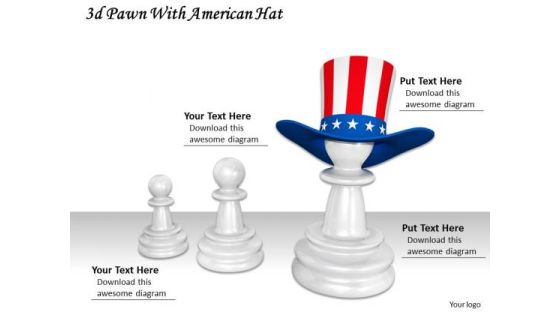
Stock Photo Pawns With American Flag Hat PowerPoint Slide
This image contains unique graphics of chess pawns with American flag hat. Use the American hat on chess pawn image to make awesome presentations on success, win etc.
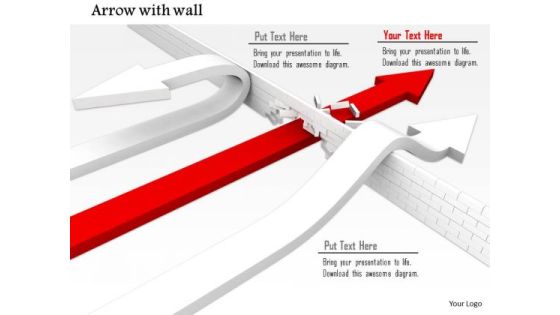
Stock Photo Red Arrow Leading White Arrows Shows Leadership PowerPoint Slide
Our above image can help you create presentations related to success and progress. This image contains graphics of red arrow breaking the wall. Enhance the look of your presentations with this image.
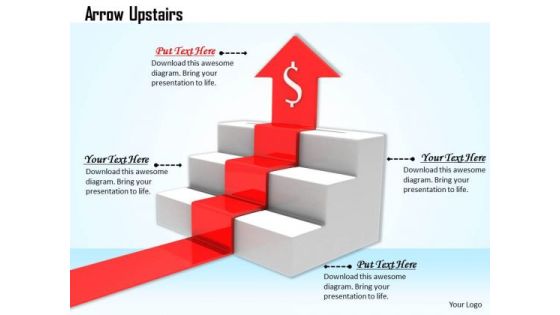
Stock Photo Red Arrow Moving Upwards In Stairs PowerPoint Slide
This image has been designed with red arrow moving upward on stairs with dollar symbol. This Image clearly relates to concept of financial growth. Use our image to drive the point to your audience and constantly attract their attention.

Stock Photo Red Green Poker Chips With Aces PowerPoint Slide
The above image contains a graphic of aces with poker chips. This image portrays the concepts of gambling, poker and casino. You may use this image to make outstanding presentations. Accelerate the impact of your ideas using this image.
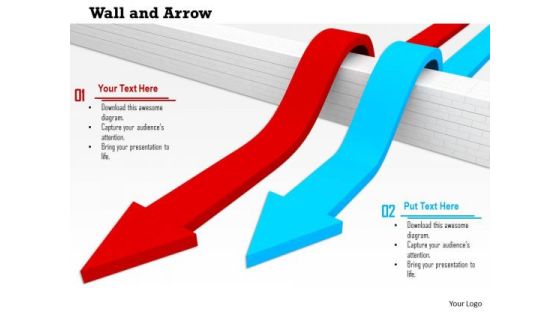
Stock Photo Red And Blue Arrow Jumping Over The Wall PowerPoint Slide
This image slide displays wall and arrows graphic. This image slide has been designed with graphic of red and blue arrow jumping the wall. This image slide may be used to depict passing the hurdle and reaching the target. This image slide may be used to express views on competition, success and goal achievement in your presentations. This image slide will give edge to your presentations.
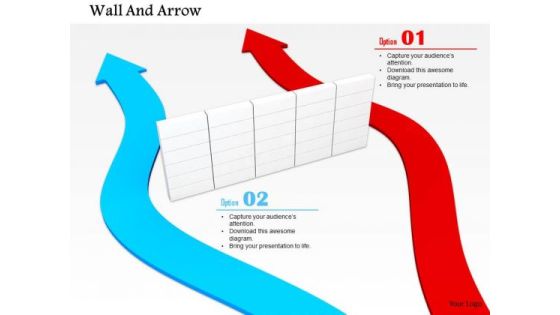
Stock Photo Red And Blue Arrow Passing Besides The Wall PowerPoint Slide
This image slide displays wall and arrows graphic. This image slide has been designed with graphic of red and blue arrow passing besides the wall. This image slide may be used to depict passing the hurdle and reaching the target. This image slide may be used to express views on competition, success and goal achievement in your presentations. This image slide will give edge to your presentations.

Stock Photo Red Arrow Achieves Success Breaking The Hurdle Wall PowerPoint Slide
This image slide displays wall and arrows graphic. This image slide has been designed with graphic of white arrows and red arrow breaking the wall. This image slide may be used to depict clearing the hurdle and reaching the target. This image slide may be used to express views on competition, success and goal achievement in your presentations. This image slide will give edge to your presentations.

Stock Photo Red Arrow Crossing From Center Of The Wall PowerPoint Slide
This image slide displays wall and arrows graphic. This image slide has been designed with graphic of red arrow crossing the wall. This image slide may be used to depict clearing the hurdle and reaching the target. This image slide may be used to express views on competition, success and goal achievement in your presentations. This image slide will give edge to your presentations.

Stock Photo Red Arrow Leads The Way And Achieves Success PowerPoint Slide
This image slide displays wall and arrows graphic. This image slide has been designed with graphic of white arrows and red arrow jumping the wall. This image slide may be used to depict passing the hurdle and reaching the target. This image slide may be used to express views on competition, success and goal achievement in your presentations. This image slide will give edge to your presentations.

Stock Photo Silver And Golden Chess Pieces PowerPoint Slide
This image slide displays silver and gold chess pieces. This image slide has been designed with graphic of metallic chess pawns. Use this image slide, in your presentations to express views on leadership, teamwork and management. This image slide may also be used in game presentations. This image slide will enhance the quality of your presentations.

Stock Photo White Black Pieces Of Chess Game PowerPoint Slide
This image slide displays dark brown and light brown chess pieces. This image slide has been designed with graphic of wooden chess pawns on blue background. Use this image slide, in your presentations to express views on leadership, teamwork, strategy and challenges. This image slide may also be used in game presentations. This image slide will enhance the quality of your presentations.
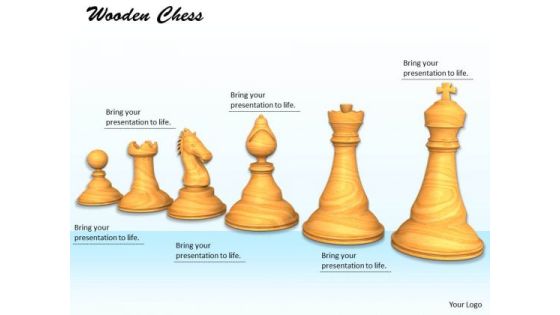
Stock Photo White Pieces Of Chess Game PowerPoint Slide
This image slide displays light brown color chess pieces. This image slide has been designed with graphic of wooden chess pawns on blue shaded background. Use this image slide, in your presentations to express views on leadership, teamwork, strategy and challenges. This image slide may also be used in game presentations. This image slide will enhance the quality of your presentations.

Stock Photo Work Text With Alarm Clock PowerPoint Slide
This image slide displays work text with clock. This innovative image slide has been crafted with graphic of red color work text with clock instead of o word. Use this image slide, in your presentations to express the importance of time at work. This image slide may also be used to depict work timings in presentations. This image slide will enhance the quality of your presentations.

Stock Photo Arrows Finding Way Through The Wall PowerPoint Slide
Two arrows with red and blue colors are used in this power point image template. These two arrows are crossing the wall which shows the success concept and wall is used as a hurdle in success path. Display success and hard work related concepts with the help of this image.

Stock Photo Blue Arrow Surpassing The Wall PowerPoint Slide
Blue colored arrow is used in this power point image template. This arrows is surpassing the concrete wall which shows the success concept and wall is used as a hurdle in success path. Display success and difficulty level in finding success with the help of this image.
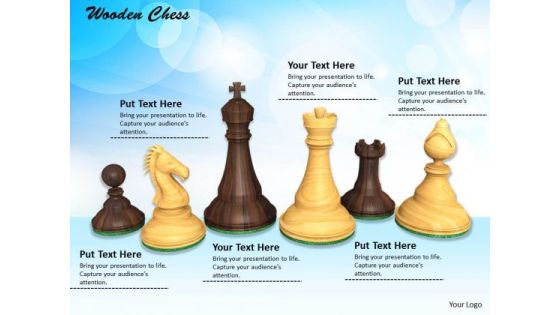
Stock Photo Illustration Of Chess Pieces Strategy Concept PowerPoint Slide
Two different colored chess pieces are used in this power point image slide. This image slide contains the two different concepts, one is game and other is team work. Display these two concepts in your sales and game related presentations.

Stock Photo King Standing Ahead Of Other Chess Pieces PowerPoint Slide
concept of leadership is well explained in this image with the graphics of chess pawns. One king of chess has been used to show leadership concept. Us this unique image slide to enhance the effect of your views in any presentations.
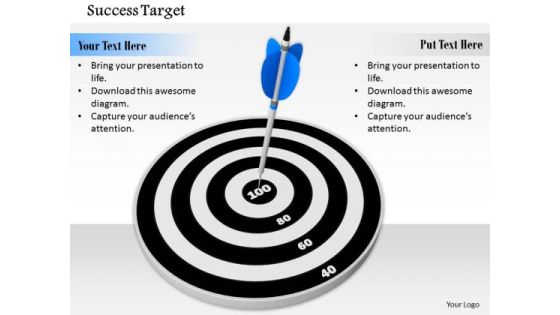
Stock Photo Goal Setting And Achievement Concept Pwerpoint Slide
Display the goal setting and achievement concept with this exclusive image. This image contains the graphic of black dart with arrow. Make a quality presentation for your viewers with this innovative image.

Stock Photo Never Give Up Text With Target Dart Pwerpoint Slide
Show the spirit of never give up with this image .To display this concept we have used target text and never give up text . Use it for your skill and success related topics display in any presentation.

Stock Photo Usa Baseball Isolated On White Background PowerPoint Slide
Develop competitive advantage with this image which contains Baseball Bat with Flag of America. This image clearly defines the concepts of patriotism, baseballs, USA and sports. Special effects of this image will surely interest the audience.

Stock Photo Usa Flag And Basketball For Sports PowerPoint Slide
Develop competitive advantage with this image which contains USA Flag with basket ball. This image clearly defines the concepts of patriotism, basketball, USA and sports. Special effects of this image will surely interest the audience.
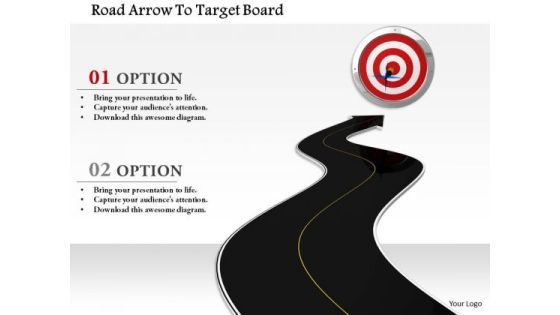
Stock Photo Road Arrow To Target Board PowerPoint Slide
This image slide displays road with target board. This image contains continuous road with target board in end to present vision of a desired destination and the best road to take to reach that goal. Make an impressive presentation by using this image.

Stock Photo Smartphone Shopping Cart Credit Card PowerPoint Slide
This image slide is designed with graphics of smart phone with credit card. This image depicts shopping through mobile apps. You may use this layout to display your content in an interesting, eye-catching manner.

Stock Photo Basketball White Grey Background PowerPoint Slide
This image slide has been crafted with graphic of basketball and white grey background. This slide contains the concept of gaming and success. Use this image for entertainment and game related presentations.

Stock Photo Basketballs In Line White Background Game PowerPoint Slide
This PowerPoint slide has been designed with graphic of basketballs in line on white background. This slide contains the concept of basketball game. Use this image for your success and game related presentations.
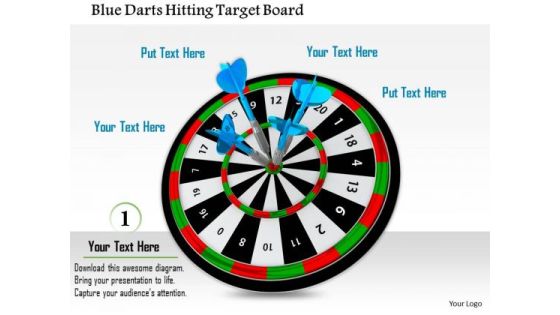
Stock Photo Blue Darts Hitting Target Board PowerPoint Slide
Explain the concept of target achievement with this innovative image slide. This slide contains the graphic of blue darts hitting the target board. Make an exclusive presentation for your viewers with this slide design.

Stock Photo Balloons Inside The Gift Box Fo Celebration PowerPoint Slide
Concept of celebration has been displayed in this power point template. This slide contains the graphic of balloons and gift box. Use this image slide to express your views on party and celebrations.

Stock Photo Dollar On Tablet For Financial Growth PowerPoint Slide
Graphic of dollar on tablet has been displayed in this image slide. This image contains the concept of financial growth. Use this editable design to depict financial transactions.

Stock Photo Dollars Covered With Lock And Chain PowerPoint Slide
This Power Point image template has been designed with graphic of dollar and chain. In this image dollar is covered with chain which shows the concept of safety. Use this image template financial security related presentations.
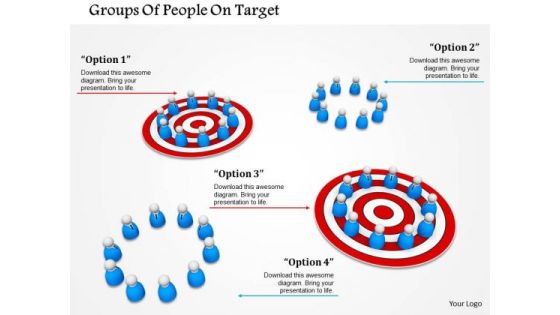
Stock Photo Groups Of People On Target PowerPoint Slide
This image slide contains groups of people on target. Download this image to portray concepts like team targets and communication. Use this image to enhance the beauty of your words.

Men On Boats For Competition Presentation Template
Concept of competition can be explained with this PowerPoint template. It contains graphics of men in boat race. Above slide provides the ideal backdrop to make interactive presentations.
Circles With Icons For Communication PowerPoint Template
The above template displays a diagram of circles with icons. This diagram has been professionally designed to emphasize on concept of competitive strategy. Grab centre stage with this slide. Capture the attention of your audience.

Pie Chart For Financial Ratio Analysis PowerPoint Template
Deliver amazing presentations with our above template showing pie chart. You may download this slide to display financial ratio analysis. Capture the attention of your audience using this diagram.
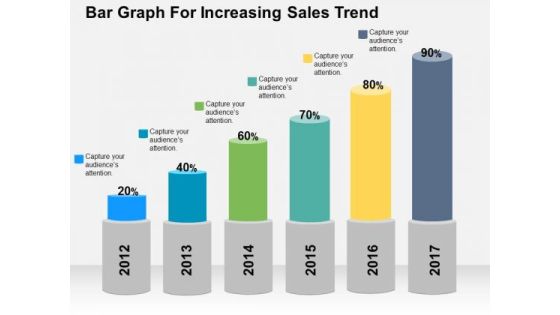
Bar Graph For Increasing Sales Trend PowerPoint Template
Deliver amazing presentations with our above template showing bar graph with percentage values. You may download this slide to depict increase in sales trends. Capture the attention of your audience using this diagram.
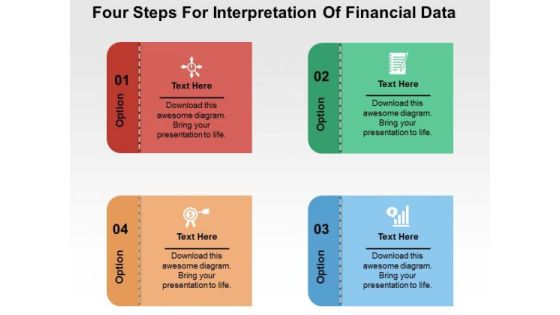
Four Steps For Interpretation Of Financial Data PowerPoint Templates
Our PPT above slide displays graphics of four text boxes with icons. This template may be used to depict interpretation of financial data. You can present your opinions using this impressive slide.

Scorecard For Companys Performance And Financial Condition PowerPoint Templates
Use this PPT slide to display companies performance financial planning. This slide contains graphics of circular scorecard. Trigger the imagination of your audience with this professional diagram.

Bars Displaying Percentage Growth PowerPoint Templates
Our above PPT slide contains bar graph displaying percentage growth. This diagram of bar graph helps to depict statistical information. Use this diagram to impart more clarity to data and to create more sound impact on viewers.
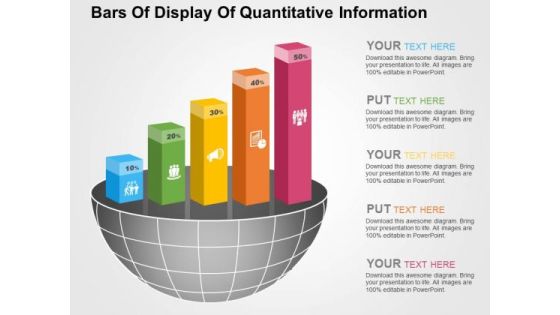
Bars Of Display Of Quantitative Information PowerPoint Templates
Visually support your presentation with our above template illustrating quantitative information. It contains graphics of bars. Etch your views in the brains of your audience with this diagram slide.
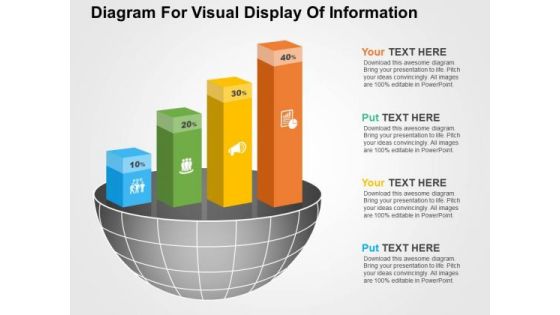
Diagram For Visual Display Of Information PowerPoint Templates
Visually support your presentation with our above template illustrating quantitative information. It contains graphics of bars. Etch your views in the brains of your audience with this diagram slide.

Circular Steps For Market Entry Strategy Powerpoint Slides
This PowerPoint template contains graphics of circular steps. You may download this PPT slide design to display market entry strategy. You can easily customize this template to make it more unique as per your need.

Bar Graph For Statistical Analysis Powerpoint Slides
This PowerPoint template has been designed with bar chart and percentage values. You may download this PPT slide to depict statistical analysis. Add this slide to your presentation and impress your superiors.

Dashboard With Increasing Values Powerpoint Slides
This innovative, stunningly beautiful dashboard has been designed for data visualization. It contains pie charts with increasing percentage values. This PowerPoint template helps to display your information in a useful, simple and uncluttered way.

Bar Graph For Year Based Analysis Powerpoint Slides
This PowerPoint template has been designed with year based bar graph. This diagram may be used to display yearly statistical analysis. Use this PPT slide design to make impressive presentations.
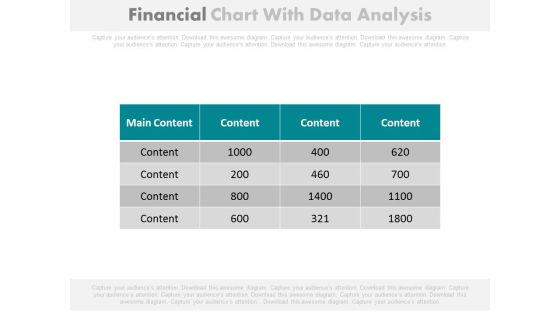
Financial Figures Data Analysis Report Powerpoint Slides
Our above PowerPoint template contains table chart with financial figures. This professional slide may be used to display data analysis report. Enlighten your audience with your breathtaking ideas.

Four Circles With Percentage Data Display Powerpoint Slides
This PowerPoint template has been designed with graphics of four circles. Download this PPT slide to display percentage data display. Use this professional template to build an exclusive presentation.
Four Colored Text Boxes With Icons Powerpoint Slides
This PowerPoint template has been designed with graphics of four text boxes. Download this PPT slide to display percentage data display. Use this professional template to build an exclusive presentation.

Four Tags For Financial Review And Analysis Powerpoint Slides
This PowerPoint template has been designed with four tags and financial values. This PowerPoint template helps to exhibit financial review and analysis. Use this diagram slide to build an exclusive presentation.
Mountain Chart With Social Media Icons Powerpoint Slides
The above PPT template displays mountain chart with social media icons. This PowerPoint template has been designed to exhibit users of social media. Download this PPT slide to attract the attention of your audience.

Pie Chart For Financial Ratio Analysis Powerpoint Slides
This PPT slide contains graphics of eight stage pie chart. Download this PowerPoint template slide for financial ratio analysis. This diagram is editable you can edit text, color, shade and style as per you need.
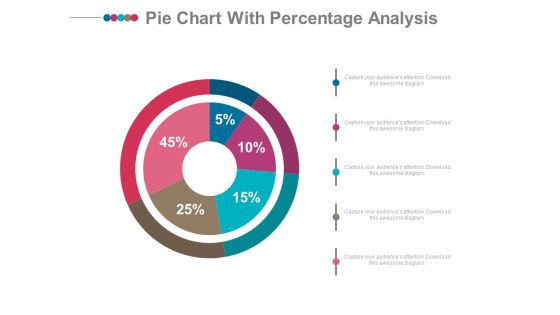
Pie Chart With Financial Data Comparison Powerpoint Slides
Emphatically define your message with our above template which contains graphics of pie chart. This PowerPoint template may be used to display financial data comparison. Grab the attention of your listeners with this slide.

Four Steps For Financial Data Analysis Powerpoint Slides
This PowerPoint contains four circles with percentage values. Download this diagram slide to display financial data analysis. This template is editable, You can edit text, color, shade and style of this diagram as per you need.
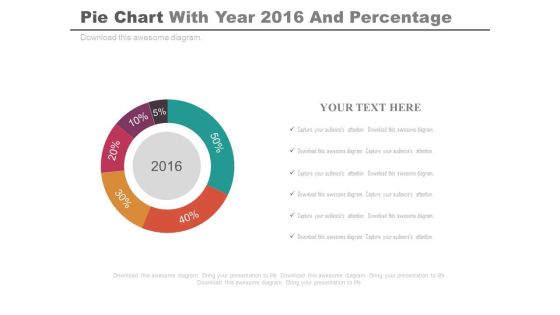
Pie Chart For Projected Profit Of 2016 Powerpoint Slides
Our above PPT slide displays graphics of Pie chart. This PowerPoint template may be used to display projected profit report of 2016. Download this template to leave permanent impression on your audience.

Circle Chart With Man And Woman Ratio Comparison Powerpoint Slides
This PowerPoint template has been designed with graphics of circle chart. You may download this PPT slide to depict man and woman ratio analysis. Add this slide to your presentation and impress your superiors.

Four Months Sales Statistics Chart Powerpoint Slides
This PowerPoint template has been designed with four shopping bags with percentage values. Download this PPT slide to display four months sales statistics. Add this slide to your presentation and impress your superiors.
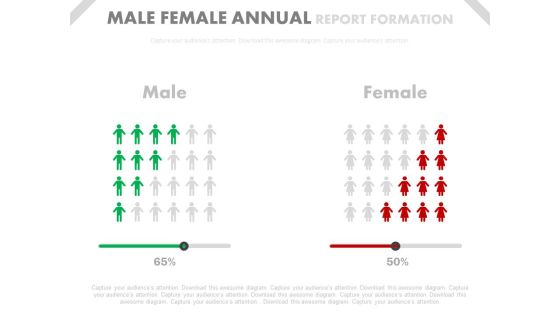
Male Female Ratio Comparison Chart Powerpoint Slides
This PowerPoint template has been designed with graphics of comparison chart. You may download this PPT slide to depict male female ratio comparison chart. Add this slide to your presentation and impress your superiors.

Test Tubes With Percentage Data For Comparison Powerpoint Slides
This PowerPoint template has been designed with test tubes and percentage data. You may download this PPT slide to display data comparison and analysis. Add this slide to your presentation and impress your superiors.

Bar Graph For Profit Growth Analysis Powerpoint Slides
This PowerPoint template has been designed with bar graph with percentage values. This diagram is useful to exhibit profit growth analysis. This diagram slide can be used to make impressive presentations.

Bar Graph For Yearly Statistical Analysis Powerpoint Slides
This PowerPoint template has been designed with bar graph. This PowerPoint diagram is useful to exhibit yearly statistical analysis. This diagram slide can be used to make impressive presentations.

Circular Diagram For Percentage Analysis Powerpoint Slides
This PowerPoint slide has been designed with circular diagram with social media icons. This diagram slide may be used to display users of social media. Prove the viability of your ideas with this professional slide.
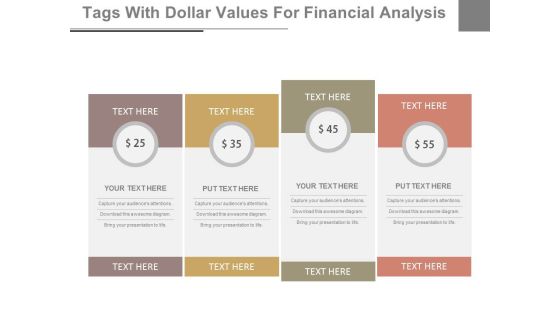
Dollar Value Pricing Table Powerpoint Slides
This PowerPoint template has been designed with dollar value pricing table chart. This PPT slide may be used for sample marketing proposal. Download this slide to build unique presentation.
Five Linear Circles And Icons For Technology Powerpoint Slides
This PowerPoint template has been designed with five linear circles and icons. This professional PPT slide is suitable to present technology growth steps. Capture the attention of your audience using this professional slide.

Five Steps Bar Graph For Financial Management Powerpoint Slides
This PowerPoint template has been designed with five steps bar graph and icons. This diagram is useful to exhibit financial management. This diagram slide can be used to make impressive presentations.
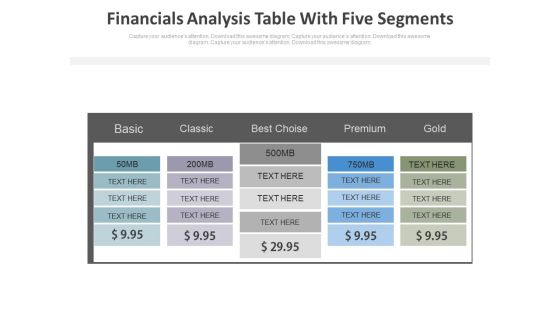
Five Steps Financial Analysis Table Powerpoint Slides
This PowerPoint template has been designed with dollar value pricing table chart. This PPT slide may be used for sample marketing proposal. Download this slide to build unique presentation.
Four Banners With Icons For Financial Planning Powerpoint Slides
The above PowerPoint template displays graphics of four text banners with icons. This diagram has been professionally designed to display steps of financial planning. Capture the attention of your audience.
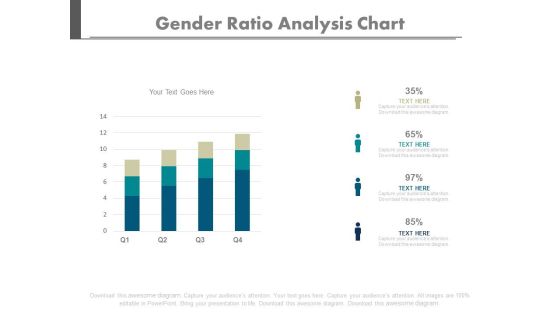
Four Bars Gender Population Ratio Chart Powerpoint Slides
Create dynamic presentations with our creative template of bar graph. This diagram may be used to present gender population. Download this template to leave permanent impression on your audience.

Four Dollar Value Financial Tags For Analysis Powerpoint Slides
This PowerPoint template has been designed with dollar value financial tags. This PPT slide may be used for sample marketing proposal. Download this slide to build unique presentation.

Four Options Circle Chart With Percentage Powerpoint Slides
This PowerPoint template has been designed with graphics of four options circle chart. This PowerPoint template may be used to display four steps of financial analysis. Prove the viability of your ideas using this impressive slide.
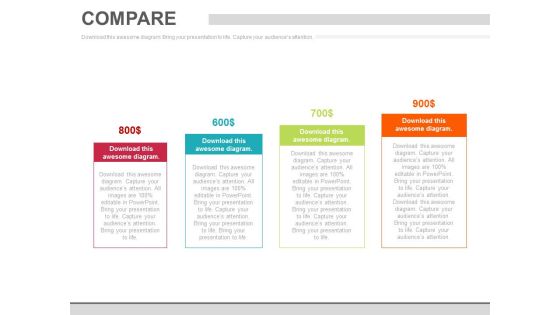
Four Steps Pricing Option Chart Powerpoint Slides
This PowerPoint template has been designed with dollar value pricing table chart. This PPT slide may be used for sample marketing proposal. Download this slide to build unique presentation.
Four Steps Pricing Table With Icons Powerpoint Slides
This PowerPoint template has been designed with dollar value pricing table chart. This PPT slide may be used for sample marketing proposal. Download this slide to build unique presentation.
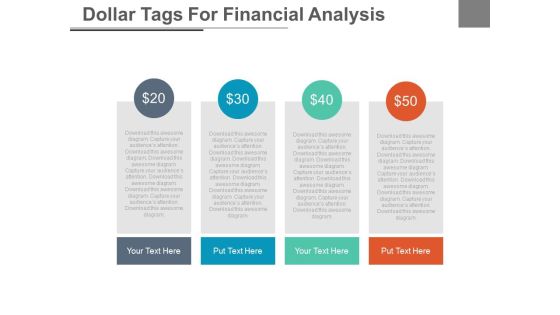
Four Tags With Dollar Values For Financial Analysis Powerpoint Slides
This PowerPoint template has been designed with dollar value pricing table chart. This PPT slide may be used for sample marketing proposal. Download this slide to build unique presentation.

Pricing Comparison Table For Analysis Powerpoint Slides
This PowerPoint template has been designed with pricing comparison table. This PowerPoint template may be used to present pricing strategy. Prove the viability of your ideas using this impressive slide.

Table For Total Sales Analysis Powerpoint Slides
This PowerPoint template has been designed with four steps table chart. Use this PPT slide to display total sales analysis. Download this template to leave permanent impression on your audience.
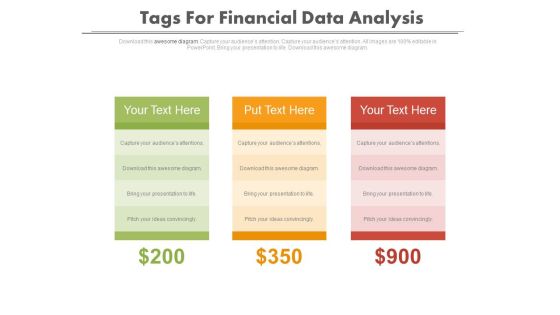
Tags For Financial Data Comparison Powerpoint Slides
Graphic of three text tag with dollar values has been used to design this power point template. This diagram may be used for financial data comparison. Use this diagram to build a professional presentation.
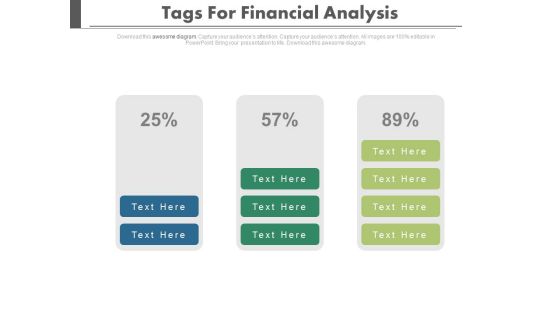
Three Stages Of Financial Growth Powerpoint Slides
Three stages of financial growth have been displayed in this power point template. This diagram helps to portray the concept of financial planning and analysis. Download this template to leave permanent impression on your audience.

Triangle For Teams Performance Analysis Powerpoint Slides
This PPT slide displays graphics of triangle diagram with teams icons. Download this PowerPoint template for teams performances analysis. Use this PowerPoint template to emphasize your views.

Triangle With Two Segments And Percentage Values Powerpoint Slides
This PowerPoint template contains graphics of triangle with two segments and percentage values. You may use this PPT slide for financial planning. The color coding of this template is specifically designed to highlight you points.

Map Of Africa With Men And Women Gender Ratio Powerpoint Slides
This PowerPoint template displays graphics of Africa map with men women icons. This PPT template can be used to display gender ratio analysis. This slide can also be used by school students for educational projects.

Map Of Usa With Contact Us Text Powerpoint Slides
This PowerPoint template has been designed with USA Map and contact us text. You may use this slide to display contact details and location. This diagram provides an effective way of displaying information you can edit text, color, shade and style as per you need.
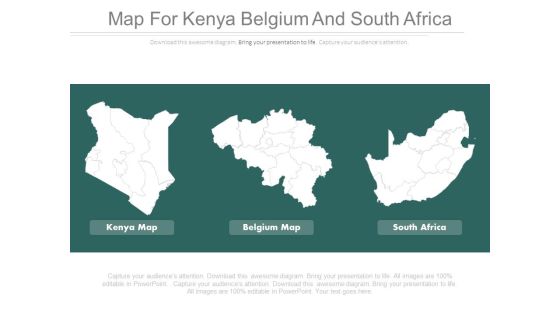
Maps For Kenya Belgium And South Africa Powerpoint Slides
This PowerPoint template has been designed with maps of Kenya, Belgium and South Africa. You may use this PPT slide depict area comparison of these three countries. Above slide provide ideal backdrop to make impressive presentations.

Bar Chart For Strategic Planning Powerpoint Slides
This PowerPoint template has been designed with bar graph with two teams. This diagram is useful to exhibit strategic planning. This diagram slide can be used to make impressive presentations.

Bar Graph For Data Distribution And Analysis Powerpoint Slides
This PowerPoint template has been designed with bar graph. This PowerPoint diagram is useful for data distribution and analysis This diagram slide can be used to make impressive presentations.

Bar Graph With Increasing Percentage Flow Powerpoint Slides
This PowerPoint slide has been designed with bar graph and increasing percentage values. This diagram slide may be used to display profit growth. Prove the viability of your ideas with this professional slide.

Chart For Financial Percentage Analysis Powerpoint Slides
This PowerPoint template has been designed with financial chart with dollar icon. This PPT slide may be used to display dollar value analysis chart. Download this slide to build unique presentation.

Five Steps Linear Chart For Financial Growth Powerpoint Slides
This PowerPoint template has been designed with five steps linear chart. This PPT slide may be used to display financial planning and growth. Download this slide to build unique presentation.
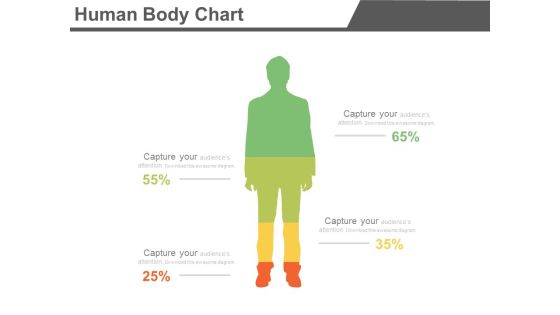
Four Segments Human Body Chart Powerpoint Slides
Create dynamic presentations with our creative template of human body chart with four segments. This diagram may be used to present information in visual manner. Download this template to leave permanent impression on your audience.
Market Trends Chart With Percentage And Icons Powerpoint Slides
This PowerPoint template has been designed with graphics of chart with percentage values and icons. This PowerPoint template may be used to market trends and financial analysis. Prove the viability of your ideas using this impressive slide.
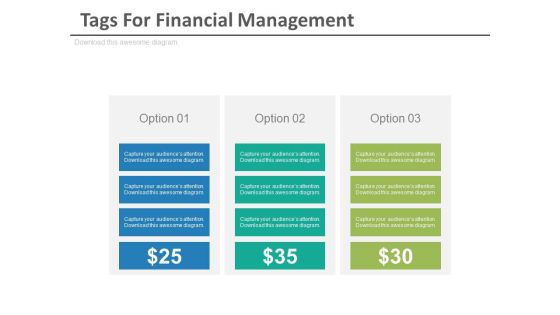
Three Options Tags For Financial Management Powerpoint Slides
Create dynamic presentations with our professional template containing three options tags. Use this diagram to exhibit financial management. Download this template to leave permanent impression on your audience.

Dashboards For Profit Growth Analysis Powerpoint Slides
This PowerPoint template has been designed with graphics of dashboard. You may use this dashboard slide design to exhibit profit growth analysis. This PPT slide is powerful tool to describe your ideas.
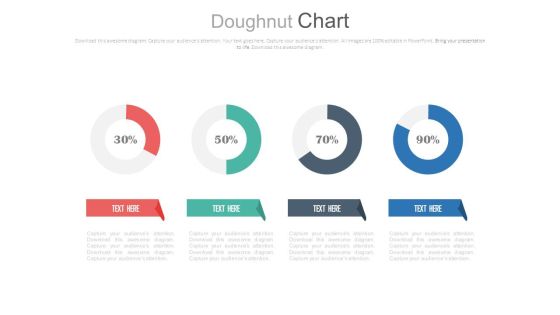
Four Circle Chart With Percentage Ratios Powerpoint Slides
This PowerPoint template has been designed with graphics of four circles and percentage ratios. You may use this dashboard slide design for topics like profit growth and financial planning. This PPT slide is powerful tool to describe your ideas.

Linear Circles Percentage Analysis Charts Powerpoint Slides
This PowerPoint template has been designed with graphics of three circles and percentage ratios. You may use this dashboard slide design for topics like profit growth and financial planning. This PPT slide is powerful tool to describe your ideas.
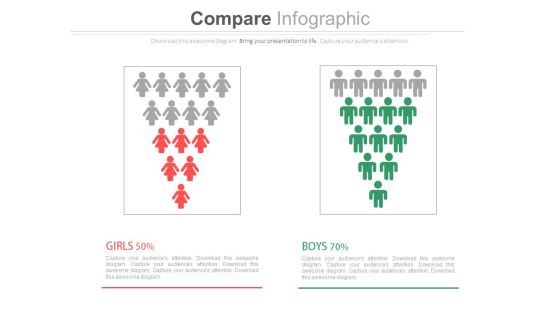
Male Female Gender Ratio Analysis Comparison Chart Powerpoint Slides
This PowerPoint template has been designed with graphics of male and female icons. Download this PPT slide to depict gender ratio analysis. Grab the attention of your team with this eye catching template.
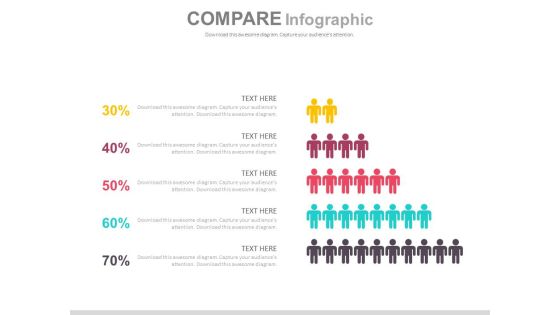
Pyramid Design For Employees Performance Powerpoint Slides
This PPT slide contains graphics of pyramid diagram. Download this PowerPoint template to depict employee?s performance and analysis. Deliver amazing presentations to mesmerize your audience by using this slide design.

Two Teams Performance Analysis Chart Powerpoint Slides
This PowerPoint template has been designed with icons of two teams with percentage values. Download this PPT slide to depict team?s performance analysis. Deliver amazing presentations to mesmerize your audience by using this PPT slide design.

Bar Graph With Financial Ratio And Icons Powerpoint Template
Visually support your presentation with our above template containing bar graph with icons. This diagram slide helps to exhibit financial ratio analysis. Etch your views in the brains of your audience with this diagram slide.

Net Promoter Score Measurement Ppt Powerpoint Idea
This is a net promoter score measurement ppt powerpoint idea. This is a three stage process. The stages in this process are promoters, passives, detractors, promoters, net promoter score.
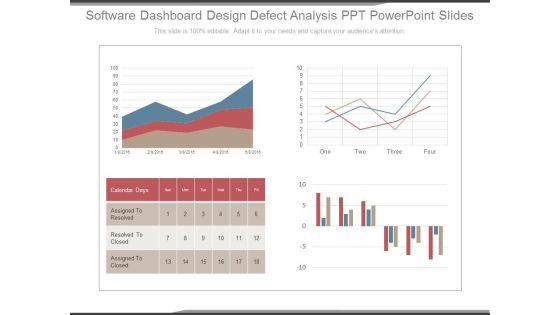
Software Dashboard Design Defect Analysis Ppt Powerpoint Slides
This is a software dashboard design defect analysis ppt powerpoint slides. This is a four stage process. The stages in this process are calendar days, assigned to resolved, resolved to closed, assigned to closed.
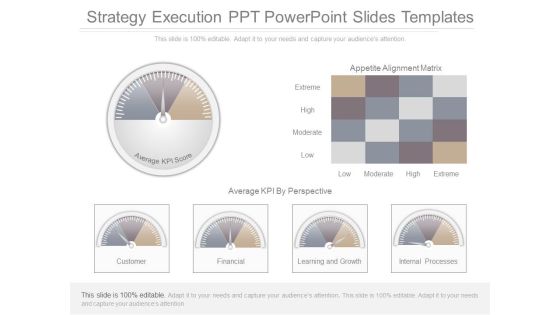
Strategy Execution Ppt Powerpoint Slides Templates
This is a strategy execution ppt powerpoint slides templates. This is a six stage process. The stages in this process are appetite alignment matrix, extreme, high, moderate, low, average kpi by prospective, customer, financial, learning and growth, internal processes, average kpi score.
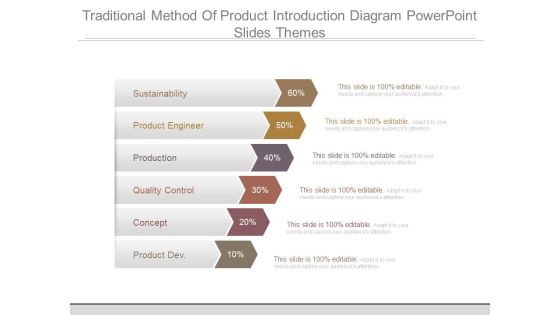
Traditional Method Of Product Introduction Diagram Powerpoint Slides Themes
This is a traditional method of product introduction diagram powerpoint slides themes. This is a six stage process. The stages in this process are sustainability, product engineer, production, quality control, concept, product dev.

Cellular Media Networking Diagram Ppt Infographics
This is a cellular media networking diagram ppt infographics. This is a four stage process. The stages in this process are communities, mashups, respect privacy, entertain.
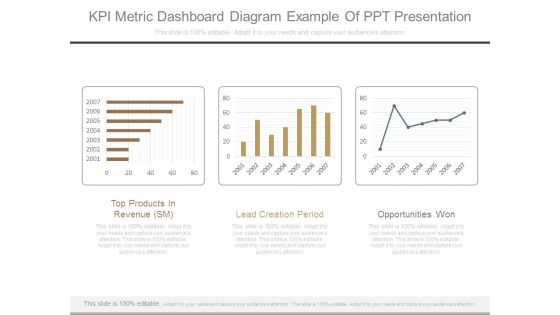
Kpi Metric Dashboard Diagram Example Of Ppt Presentation
This is a kpi metric dashboard diagram example of ppt presentation. This is a three stage process. The stages in this process are top products in revenue sm, lead creation period, opportunities won.
Human Performance Improvement Technologies Ppt Icon
This is a human performance improvement technologies ppt icon. This is a four stage process. The stages in this process are score, overall territory performance, weight.

Win Loss Insights Ppt Background Images
This is a win loss insights ppt background image. This is a two stage process. The stages in this process are why you lose, why you win.
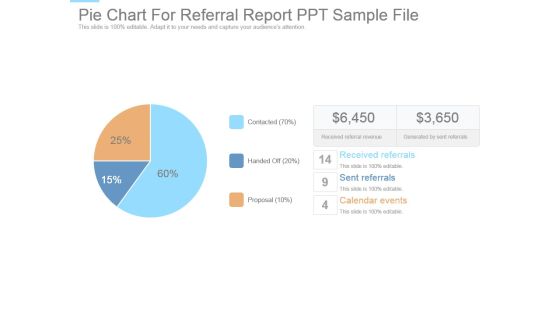
Pie Chart For Referral Report Ppt Sample File
This is a pie chart for referral report ppt sample file. This is a three stage process. The stages in this process are received referrals, sent referrals, calendar events, proposal, handed off, contacted, received referral revenue, generated by sent referrals.
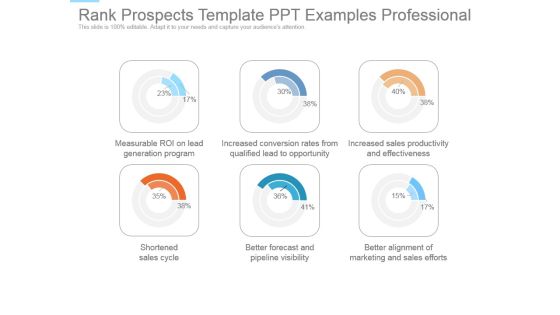
Rank Prospects Template Ppt Examples Professional
This is a rank prospects template ppt examples professional. This is a six stage process. The stages in this process are measurable roi on lead generation program, increased conversion rates from qualified lead to opportunity, increased sales productivity and effectiveness, shortened sales cycle, better forecast and pipeline visibility, better alignment of marketing and sales efforts.

Sales Breakdown Pie Chart Dashboard Powerpoint Slide Influencers
This is a sales breakdown pie chart dashboard powerpoint slide influencers. This is a four stage process. The stages in this process are railway stations and other, downtown hotel and resorts, cruise liners and seaports, airports, north america, south america, central america and caribbean, eurasia and asia, africa, europe.
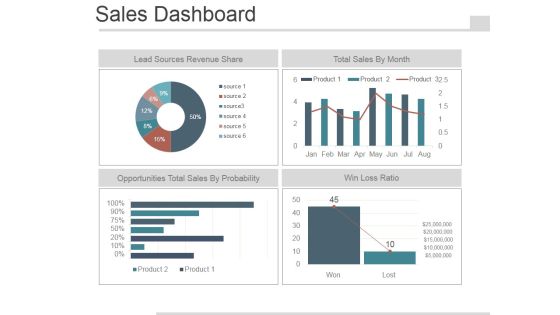
Sales Dashboard Slide Template 2 Ppt PowerPoint Presentation Images
This is a sales dashboard slide template 2 ppt powerpoint presentation images. This is a four stage process. The stages in this process are lead sources revenue share, total sales by month, opportunities total sales by probability, win loss ratio.
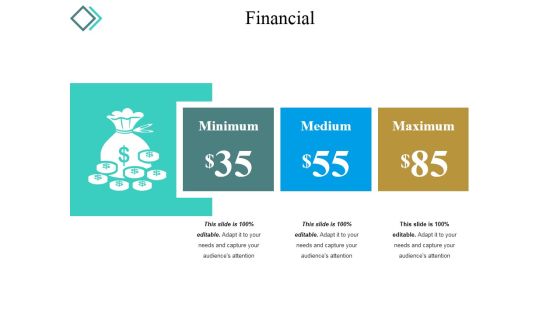
Financial Ppt PowerPoint Presentation Gallery Aids
This is a financial ppt powerpoint presentation gallery aids. This is a three stage process. The stages in this process are minimum, medium, maximum.

Stock Chart Ppt PowerPoint Presentation Gallery Graphic Images
This is a stock chart ppt powerpoint presentation gallery graphic images. This is a five stage process. The stages in this process are close, high, volume, low, open.
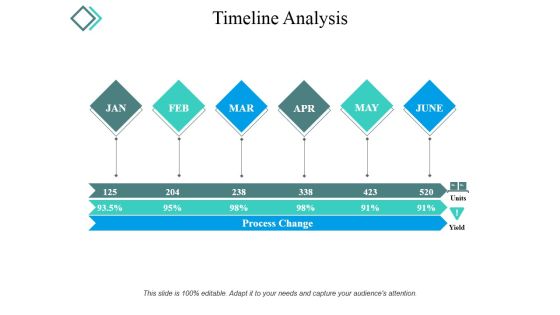
Timeline Analysis Ppt PowerPoint Presentation Outline Clipart
This is a timeline analysis ppt powerpoint presentation outline clipart. This is a six stage process. The stages in this process are process change, units, yield, months, percentage.

High Low Close Chart Template 1 Ppt PowerPoint Presentation Infographics Graphics Design
This is a high low close chart template 1 ppt powerpoint presentation infographics graphics design. This is a five stage process. The stages in this process are close, high, volume, low, open, product.
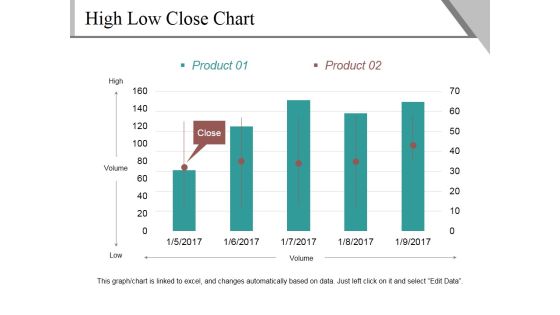
High Low Close Chart Template 2 Ppt PowerPoint Presentation Outline Show
This is a high low close chart template 2 ppt powerpoint presentation outline show. This is a five stage process. The stages in this process are high, volume, low, close, product.

Bar Chart Ppt PowerPoint Presentation Icon Demonstration
This is a bar chart ppt powerpoint presentation icon demonstration. This is a seven stage process. The stages in this process are product, sales in percentage, financial year, graph.

Financial Ppt PowerPoint Presentation Gallery Background Images
This is a financial ppt powerpoint presentation gallery background images. This is a three stage process. The stages in this process are minimum, medium, maximum, dollar, symbol.

Comparison Ppt PowerPoint Presentation Slides Slideshow
This is a comparison ppt powerpoint presentation slides slideshow. This is a two stage process. The stages in this process are female, male, percentage, compare.

Executive Summary Ppt PowerPoint Presentation Summary Good
This is a executive summary ppt powerpoint presentation summary good. This is a seven stage process. The stages in this process are companys vision, companys mission, background, capabilities, accreditation.

Stock Chart Ppt PowerPoint Presentation Professional Objects
This is a stock chart ppt powerpoint presentation professional objects. This is a five stage process. The stages in this process are product, high, volume, low, open, close.

Product Life Cycle Ppt PowerPoint Presentation Summary Deck
This is a product life cycle ppt powerpoint presentation summary deck. This is a four stage process. The stages in this process are introduction, growth, maturity, decline.
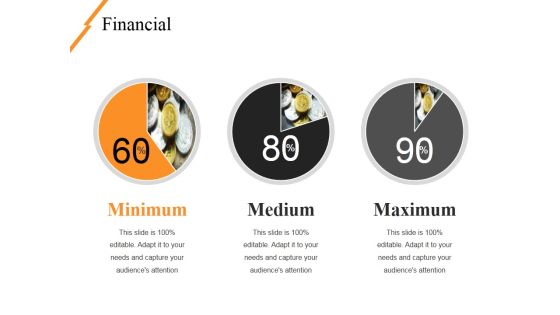
Financial Ppt PowerPoint Presentation Professional Infographic Template
This is a financial ppt powerpoint presentation professional infographic template. This is a three stage process. The stages in this process are minimum, medium, maximum, financial.
Financials Ppt PowerPoint Presentation Icon Deck
This is a financials ppt powerpoint presentation icon deck. This is a two stage process. The stages in this process are minimum, maximum, financial, percentage, icons.

Brand Tracking Info Graphics Ppt PowerPoint Presentation Infographics Slides
This is a brand tracking info graphics ppt powerpoint presentation infographics slides. This is a four stage process. The stages in this process are of consumers read, trust online reviews, user generated, look to online.
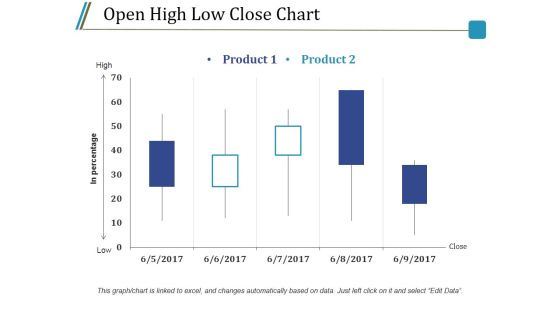
Open High Low Close Chart Ppt PowerPoint Presentation Styles Model
This is a open high low close chart ppt powerpoint presentation styles model. This is a five stage process. The stages in this process are product, high, low, in percentage, close.

Volume Open High Low Close Chart Ppt PowerPoint Presentation Infographics Guide
This is a volume open high low close chart ppt powerpoint presentation infographics guide. This is a two stage process. The stages in this process are close, high, volume, low, open, product.
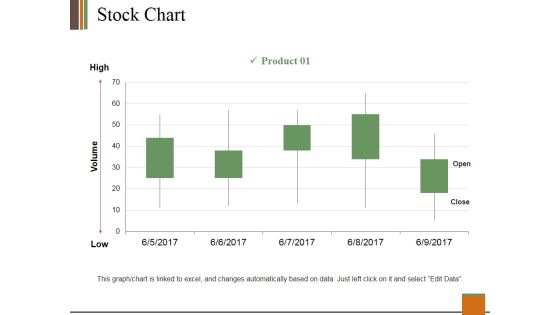
Stock Chart Ppt PowerPoint Presentation Slides Clipart
This is a stock chart ppt powerpoint presentation slides clipart. This is a one stage process. The stages in this process are product, high, volume, low, open, close.

Bridge Transition Model Ppt PowerPoint Presentation Gallery Infographics
This is a bridge transition model ppt powerpoint presentation gallery infographics. This is a four stage process. The stages in this process are ending, transitions, new beginning, commitment, exploration.

Change Management Experience Ppt PowerPoint Presentation Gallery Styles
This is a change management experience ppt powerpoint presentation gallery styles. This is a four stage process. The stages in this process are poor, fair, good, excellent, percentage.
Financial Ppt PowerPoint Presentation Icon Smartart
This is a financial ppt powerpoint presentation icon smartart. This is a two stage process. The stages in this process are silver, gold, dollar, symbol, feature.

Stock Chart Template 2 Ppt PowerPoint Presentation Infographic Template Styles
This is a stock chart template 2 ppt powerpoint presentation infographic template styles. This is a one stage process. The stages in this process are high, volume, low, product, volume.
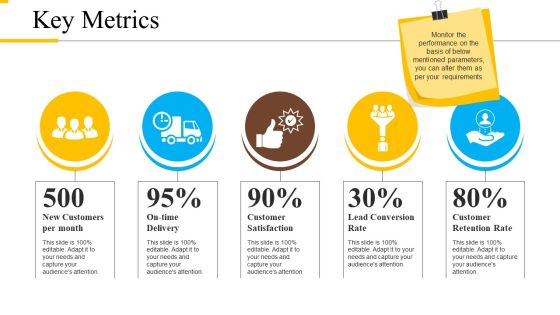
Key Metrics Ppt PowerPoint Presentation Professional Slideshow
This is a key metrics ppt powerpoint presentation professional slideshow. This is a five stage process. The stages in this process are new customers per month, on time delivery, customer satisfaction, lead conversion rate, customer retention rate.
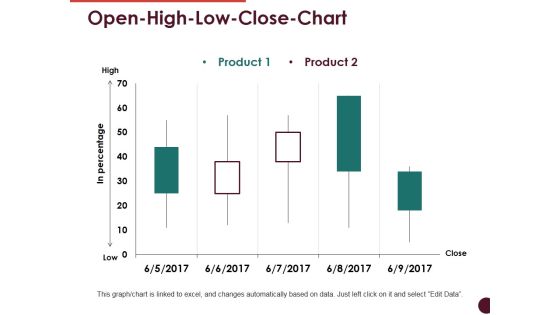
Open High Low Close Chart Ppt PowerPoint Presentation Professional Visuals
This is a open high low close chart ppt powerpoint presentation professional visuals. This is a two stage process. The stages in this process are high, low, in percentage, product, close.

Comparison Ppt PowerPoint Presentation Model Clipart Images
This is a comparison ppt powerpoint presentation model clipart images. This is a two stage process. The stages in this process are male, female, comparison, percentage, icons.

Nurturing Ppt PowerPoint Presentation Summary Images
This is a nurturing ppt powerpoint presentation summary images. This is a seven stage process. The stages in this process are segmenting lead data, creating relevant content, personalizing campaigns.

Key Financial Ratios Ppt PowerPoint Presentation Portfolio Background Image
This is a key financial ratios ppt powerpoint presentation portfolio background image. This is a four stage process. The stages in this process are debt to equity ratio, current ratio, return on assets, ratio, return.

Social Media Facts Ppt PowerPoint Presentation Design Templates
This is a social media facts ppt powerpoint presentation design templates. This is a three stage process. The stages in this process are facebook, sound cloud, google plus.

Some Quick Facts Ppt PowerPoint Presentation Summary Example
This is a some quick facts ppt powerpoint presentation summary example. This is a three stage process. The stages in this process are customers, sales growth, staff works weekly.

Volume High Low Close Chart Ppt PowerPoint Presentation Infographics Good
This is a volume high low close chart ppt powerpoint presentation infographics good. This is a two stage process. The stages in this process are high, volume, low, product, close.
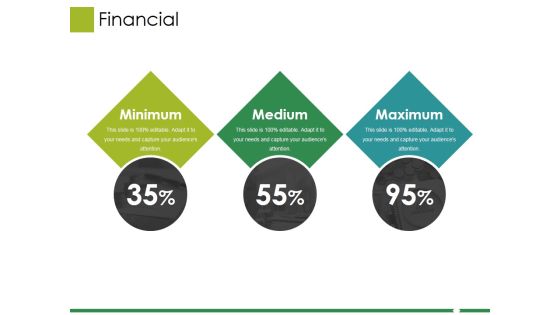
Financial Ppt PowerPoint Presentation Gallery Graphics Download
This is a financial ppt powerpoint presentation gallery graphics download. This is a three stage process. The stages in this process are minimum, medium, maximum.
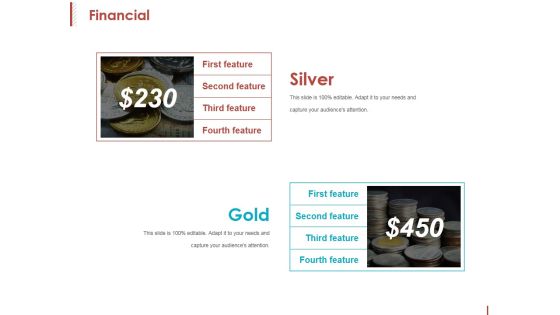
Financial Ppt PowerPoint Presentation File Templates
This is a financial ppt powerpoint presentation file templates. This is a two stage process. The stages in this process are silver, gold, first feature, dollar, symbol.
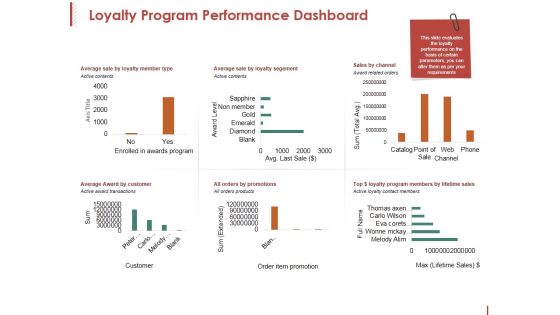
Loyalty Program Performance Dashboard Ppt PowerPoint Presentation Pictures Clipart
This is a loyalty program performance dashboard ppt powerpoint presentation pictures clipart. This is a six stage process. The stages in this process are axis title, award level, sum, active contents, channel.
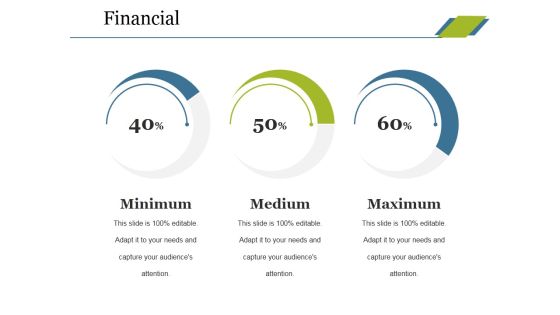
Financial Ppt PowerPoint Presentation Inspiration Examples
This is a financial ppt powerpoint presentation inspiration examples. This is a three stage process. The stages in this process are minimum, medium, maximum, financial, percentage.
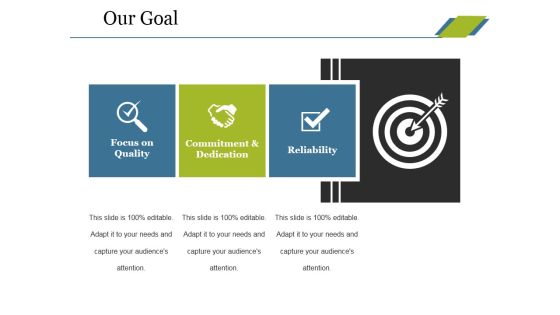
Our Goal Ppt PowerPoint Presentation Outline Visual Aids
This is a our goal ppt powerpoint presentation outline visual aids. This is a three stage process. The stages in this process are focus on quality, commitment and dedication, reliability, icons, strategy.

Competitor Analysis Ppt PowerPoint Presentation Inspiration Ideas
This is a competitor analysis ppt powerpoint presentation inspiration ideas. This is a four stage process. The stages in this process are sales development, performance indicators, revenue, sales, sales development of industry.
Sales Kpi Tracker Ppt PowerPoint Presentation Layout
This is a sales kpi tracker ppt powerpoint presentation layout. This is a six stage process. The stages in this process are leads created, sales ratio, opportunities won, top products in revenue, actual.
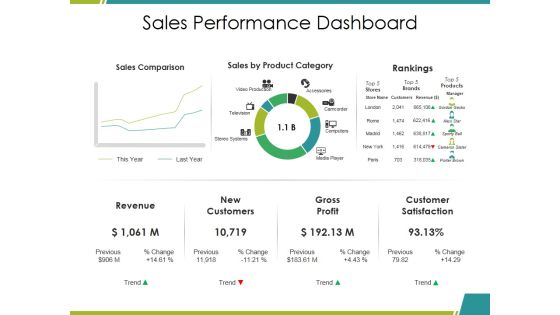
Sales Performance Dashboard Ppt PowerPoint Presentation Infographics Mockup
This is a sales performance dashboard ppt powerpoint presentation infographics mockup. This is a three stage process. The stages in this process are sales comparison, sales by product category, rankings, revenue, gross profit.

Competitor Analysis Ppt PowerPoint Presentation Pictures Visuals
This is a competitor analysis ppt powerpoint presentation pictures visuals. This is a four stage process. The stages in this process are sales development, performance indicators, sales development of industry, sales, revenue.
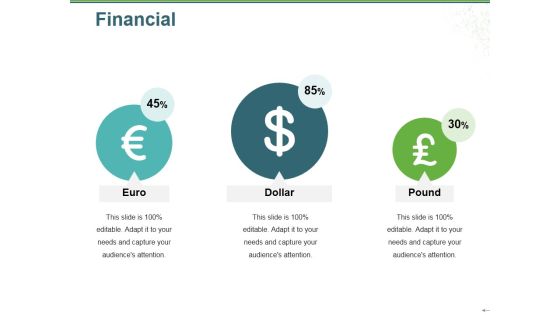
Financial Ppt PowerPoint Presentation Pictures Mockup
This is a financial ppt powerpoint presentation pictures mockup. This is a three stage process. The stages in this process are euro, dollar, pound, financial, symbol.
Highlights Ppt PowerPoint Presentation Icon Infographics
This is a highlights ppt powerpoint presentation icon infographics. This is a five stage process. The stages in this process are countries, stores worldwide, total revenue, associates, monthly website visitors.
Sales Kpi Tracker Ppt PowerPoint Presentation Gallery Shapes
This is a sales kpi tracker ppt powerpoint presentation gallery shapes. This is a six stage process. The stages in this process are target growth, leads created, sales ratio, last year, stretched growth.
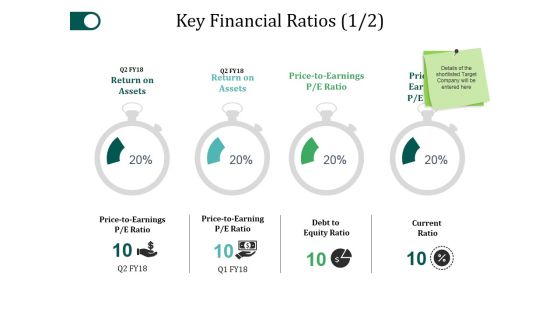
Key Financial Ratios Template 1 Ppt PowerPoint Presentation Layouts Pictures
This is a key financial ratios template 1 ppt powerpoint presentation layouts pictures. This is a four stage process. The stages in this process are return on assets, debt to equity ratio, current ratio, price to earnings.

Capital Expenditure Valuation Methods Ppt PowerPoint Presentation File Background Images
This is a capital expenditure valuation methods ppt powerpoint presentation file background images. This is a three stage process. The stages in this process are discounted payback period, net present value method, internal rate of return.
Stock Chart Ppt PowerPoint Presentation Inspiration Icon
This is a stock chart ppt powerpoint presentation inspiration icon. This is a two stage process. The stages in this process are high, volume, low, product, close.

Competitor Analysis Ppt PowerPoint Presentation File Influencers
This is a competitor analysis ppt powerpoint presentation file influencers. This is a four stage process. The stages in this process are revenue, sales, placeholder, performance indicators, sales development.

Competitor Analysis Ppt PowerPoint Presentation File Graphics Example
This is a competitor analysis ppt powerpoint presentation file graphics example. This is a four stage process. The stages in this process are revenue, sales development of industry, own company, placeholder, competitor.

Social Media Analysis Ppt PowerPoint Presentation Infographics Samples
This is a social media analysis ppt powerpoint presentation infographics samples. This is a four stage process. The stages in this process are facebook, linkedin, twitter, you tube, social media.
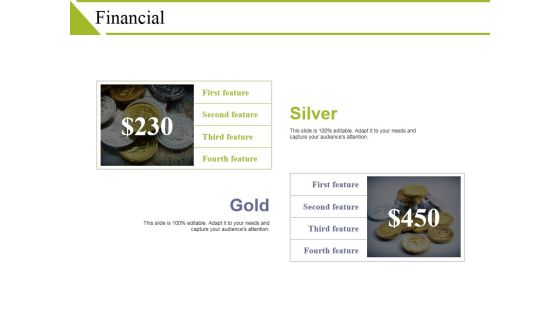
Financial Ppt PowerPoint Presentation Infographics Picture
This is a financial ppt powerpoint presentation infographics picture. This is a two stage process. The stages in this process are silver, gold, feature, symbol, currency.


