Corporate Banking

COVID Impact Analysis On Freight And Transportation Sector Ppt Outline Graphics Tutorials PDF
This slide covers impact of COVID-19 on freight, transportation equipment and travel industry. It includes impact on demand, insights on global GDP growth, impact on supply chain, supply bottlenecks, short-term pricing outlook, etc. Pitch your topic with ease and precision using this COVID Impact Analysis On Freight And Transportation Sector Ppt Outline Graphics Tutorials PDF. This layout presents information on Freight And Logistics, Transportation Equipment, Deflationary. It is also available for immediate download and adjustment. So, changes can be made in the color, design, graphics or any other component to create a unique layout.
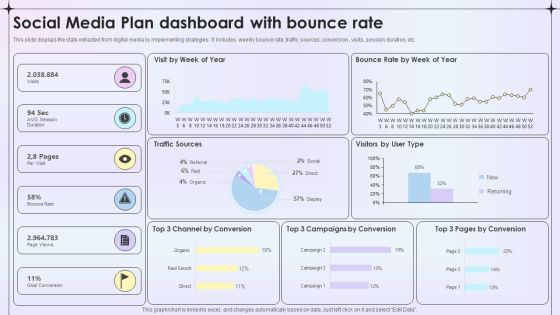
Social Media Plan Dashboard With Bounce Rate Ppt Ideas Graphics Template PDF
This slide displays the stats extracted from digital media by implementing strategies . It includes weekly bounce rate, traffic sources, conversion , visits, session duration, etc. Pitch your topic with ease and precision using this Social Media Plan Dashboard With Bounce Rate Ppt Ideas Graphics Template PDF. This layout presents information on Traffic Sources, Visitors User Type, Goal Conversion. It is also available for immediate download and adjustment. So, changes can be made in the color, design, graphics or any other component to create a unique layout.
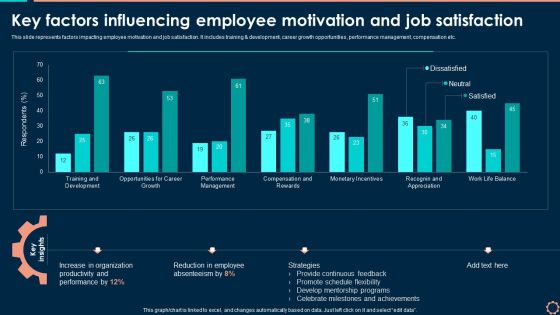
Key Factors Influencing Employee Motivation And Job Satisfaction Mockup PDF
This slide represents factors impacting employee motivation and job satisfaction. It includes training and development, career growth opportunities, performance management, compensation etc. There are so many reasons you need a Key Factors Influencing Employee Motivation And Job Satisfaction Mockup PDF. The first reason is you can not spend time making everything from scratch, Thus, Slidegeeks has made presentation templates for you too. You can easily download these templates from our website easily.

Key Impacts Of Talent Management System Information PDF
This slide represents impact of talent management system. It covers employee productivity rate, employee turnover rate, employee acquisition, training program etc. Do you have to make sure that everyone on your team knows about any specific topic I yes, then you should give Key Impacts Of Talent Management System Information PDF a try. Our experts have put a lot of knowledge and effort into creating this impeccable Key Impacts Of Talent Management System Information PDF. You can use this template for your upcoming presentations, as the slides are perfect to represent even the tiniest detail. You can download these templates from the Slidegeeks website and these are easy to edit. So grab these today.

KPI Dashboard To Measure Performance Of B2B Promotional Communication Strategy Mockup PDF
The following slides outline the key performance indicator dashboard to track performance of B2B marketing communication approach. It covers information about pipeline deals, revenue by campaign, email engagement and landing page completion. Pitch your topic with ease and precision using this KPI Dashboard To Measure Performance Of B2B Promotional Communication Strategy Mockup PDF. This layout presents information on Pipeline Deals, Engagement Health, Email Engagement. It is also available for immediate download and adjustment. So, changes can be made in the color, design, graphics or any other component to create a unique layout.
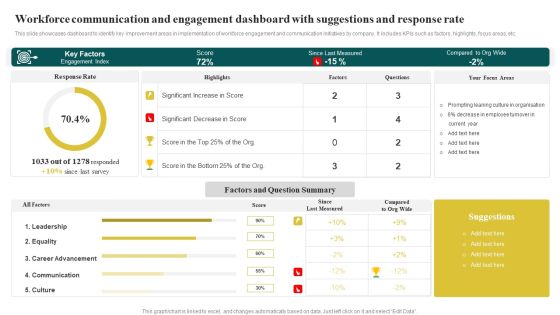
Workforce Communication And Engagement Dashboard With Suggestions And Response Rate Microsoft PDF
This slide showcases dashboard to identify key improvement areas in implementation of workforce engagement and communication initiatives by company. It includes KPIs such as factors, highlights, focus areas, etc. Pitch your topic with ease and precision using this Workforce Communication And Engagement Dashboard With Suggestions And Response Rate Microsoft PDF. This layout presents information on Key Factors, Since Last Measured, Factors And Que. It is also available for immediate download and adjustment. So, changes can be made in the color, design, graphics or any other component to create a unique layout.

Company Event Communication Dashboard For Tracking Event Gross Revenue Themes PDF
This slide covers metrics for analyzing gross revenue generated throughout the event. It includes a graphical and tabular representation of revenue generated via promo codes and tracking links. Want to ace your presentation in front of a live audience Our Company Event Communication Dashboard For Tracking Event Gross Revenue Themes PDF can help you do that by engaging all the users towards you.. Slidegeeks experts have put their efforts and expertise into creating these impeccable powerpoint presentations so that you can communicate your ideas clearly. Moreover, all the templates are customizable, and easy-to-edit and downloadable. Use these for both personal and commercial use.

Competitor Analysis Based On Top Performing Skus Competitor Vs Our Company Brochure PDF
This slide covers the comparison of competitors top selling categories. It also includes key insights such as consumers likeness to purchase dressier items from our company. Want to ace your presentation in front of a live audience Our Competitor Analysis Based On Top Performing Skus Competitor Vs Our Company Brochure PDF can help you do that by engaging all the users towards you.. Slidegeeks experts have put their efforts and expertise into creating these impeccable powerpoint presentations so that you can communicate your ideas clearly. Moreover, all the templates are customizable, and easy-to-edit and downloadable. Use these for both personal and commercial use.
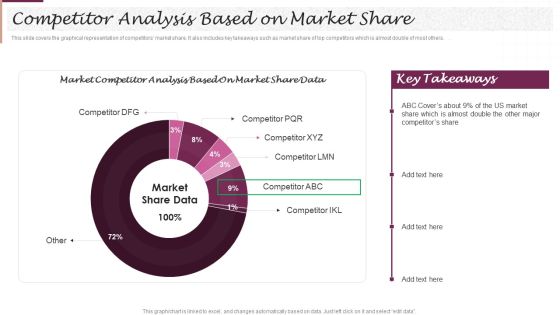
New Market Segment Entry Plan Competitor Analysis Based On Market Share Demonstration PDF
This slide covers the graphical representation of competitors market share. It also includes key takeaways such as market share of top competitors which is almost double of most others. . If your project calls for a presentation, then Slidegeeks is your go-to partner because we have professionally designed, easy-to-edit templates that are perfect for any presentation. After downloading, you can easily edit New Market Segment Entry Plan Competitor Analysis Based On Market Share Demonstration PDF and make the changes accordingly. You can rearrange slides or fill them with different images. Check out all the handy templates.

Product And Service Offerings Segment Analysis Competitor Vs Our Company Inspiration PDF
This slide covers comparison of various segments offered by competitors and our company. It also includes segments such as childrenswear, menswear, and womenswear. This modern and well-arranged Product And Service Offerings Segment Analysis Competitor Vs Our Company Inspiration PDF provides lots of creative possibilities. It is very simple to customize and edit with the Powerpoint Software. Just drag and drop your pictures into the shapes. All facets of this template can be edited with Powerpoint no extra software is necessary. Add your own material, put your images in the places assigned for them, adjust the colors, and then you can show your slides to the world, with an animated slide included.
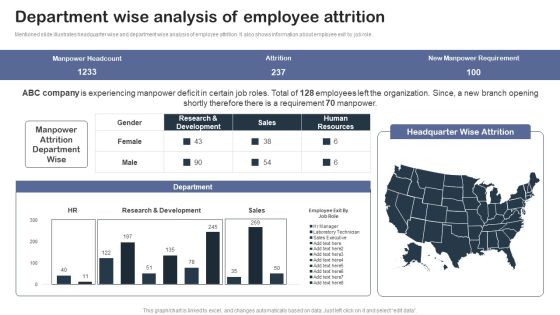
Staff Succession Planning And Development Department Wise Analysis Of Employee Attrition Download PDF
Mentioned slide illustrates headquarter wise and department wise analysis of employee attrition. It also shows information about employee exit by job role.Do you have to make sure that everyone on your team knows about any specific topic I yes, then you should give Staff Succession Planning And Development Department Wise Analysis Of Employee Attrition Download PDF a try. Our experts have put a lot of knowledge and effort into creating this impeccable Staff Succession Planning And Development Department Wise Analysis Of Employee Attrition Download PDF. You can use this template for your upcoming presentations, as the slides are perfect to represent even the tiniest detail. You can download these templates from the Slidegeeks website and these are easy to edit. So grab these today.
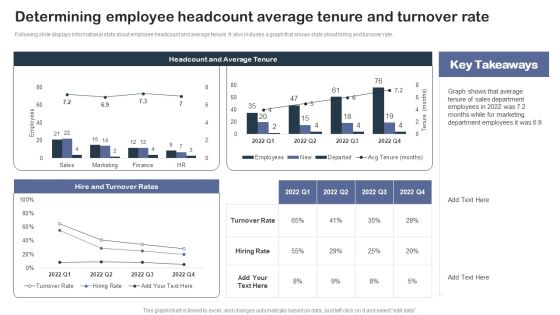
Staff Succession Planning And Development Determining Employee Headcount Average Elements PDF
Following slide displays informational stats about employee headcount and average tenure. It also includes a graph that shows stats about hiring and turnover rate.Get a simple yet stunning designed Staff Succession Planning And Development Determining Employee Headcount Average Elements PDF. It is the best one to establish the tone in your meetings. It is an excellent way to make your presentations highly effective. So, download this PPT today from Slidegeeks and see the positive impacts. Our easy-to-edit Staff Succession Planning And Development Determining Employee Headcount Average Elements PDF can be your go-to option for all upcoming conferences and meetings. So, what are you waiting for Grab this template today.
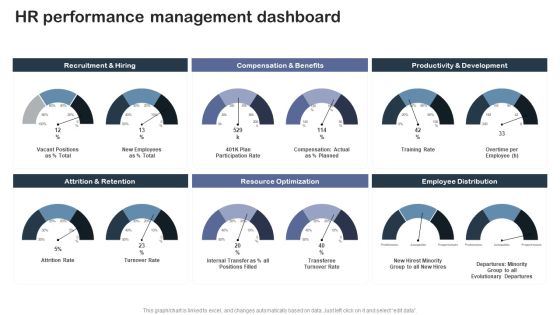
Staff Succession Planning And Development Hr Performance Management Dashboard Structure PDF
Do you have an important presentation coming up Are you looking for something that will make your presentation stand out from the rest Look no further than Staff Succession Planning And Development Hr Performance Management Dashboard Structure PDF. With our professional designs, you can trust that your presentation will pop and make delivering it a smooth process. And with Slidegeeks, you can trust that your presentation will be unique and memorable. So why wait Grab Staff Succession Planning And Development Hr Performance Management Dashboard Structure PDF today and make your presentation stand out from the rest.
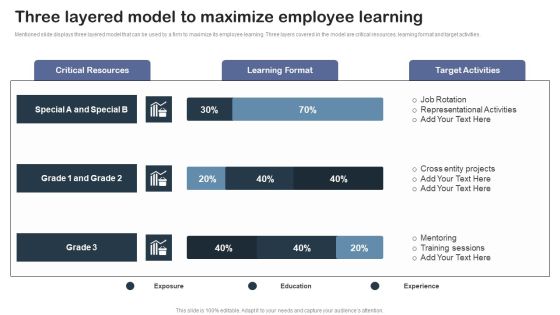
Three Layered Model To Maximize Employee Learning Background PDF
There are so many reasons you need a Three Layered Model To Maximize Employee Learning Background PDF. The first reason is you can not spend time making everything from scratch, Thus, Slidegeeks has made presentation templates for you too. You can easily download these templates from our website easily.

Strategic Sourcing And Supplier Quality Dashboard To Track Supplier Quality Performance Microsoft PDF
This slide indicates the dashboard to track supplier performance with multiple metrices such as supplier with least and most complaints, month wise product defects and late deliveries, complaints categorization along with details of amount spend by suppliers.Slidegeeks has constructed Strategic Sourcing And Supplier Quality Dashboard To Track Supplier Quality Performance Microsoft PDF after conducting extensive research and examination. These presentation templates are constantly being generated and modified based on user preferences and critiques from editors. Here, you will find the most attractive templates for a range of purposes while taking into account ratings and remarks from users regarding the content. This is an excellent jumping-off point to explore our content and will give new users an insight into our top-notch PowerPoint Templates.

5G Technology Development For Digital Transformation 5G Emerging As Network Of Opportunity Portrait PDF
This slide provides details regarding 5G as next generation mobile technology and emerging as network of opportunity catering various need of users, telecom operators, etc. Find a pre designed and impeccable 5G Technology Development For Digital Transformation 5G Emerging As Network Of Opportunity Portrait PDF. The templates can ace your presentation without additional effort. You can download these easy to edit presentation templates to make your presentation stand out from others. So, what are you waiting for Download the template from Slidegeeks today and give a unique touch to your presentation.
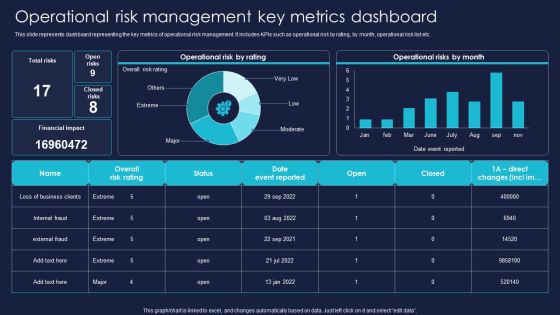
Operational Risk Management Key Metrics Dashboard Professional PDF
This slide represents dashboard representing the key metrics of operational risk management. It includes KPIs such as operational risk by rating, by month, operational risk list etc. Get a simple yet stunning designed Operational Risk Management Key Metrics Dashboard Professional PDF. It is the best one to establish the tone in your meetings. It is an excellent way to make your presentations highly effective. So, download this PPT today from Slidegeeks and see the positive impacts. Our easy to edit Operational Risk Management Key Metrics Dashboard Professional PDF can be your go-to option for all upcoming conferences and meetings. So, what are you waiting for Grab this template today.

Global Automotive Industry Analysis Electric Vehicle Sales Growth In EU Pictures PDF
This slide covers a graphical representation of EV year over year sales in Europe. It also includes key insights into plug-in electric registrations, market share, etc. Formulating a presentation can take up a lot of effort and time, so the content and message should always be the primary focus. The visuals of the PowerPoint can enhance the presenters message, so our Global Automotive Industry Analysis Electric Vehicle Sales Growth In EU Pictures PDF was created to help save time. Instead of worrying about the design, the presenter can concentrate on the message while our designers work on creating the ideal templates for whatever situation is needed. Slidegeeks has experts for everything from amazing designs to valuable content, we have put everything into Global Automotive Industry Analysis Electric Vehicle Sales Growth In EU Pictures PDF.

Global Automotive Industry Analysis Estimated Global Motor Vehicle Production By Type Graphics PDF
This slide covers a graphical representation of worldwide automobile manufacturing forecasts. It also includes key insights about as passenger cars, Chinese motorists, etc. Coming up with a presentation necessitates that the majority of the effort goes into the content and the message you intend to convey. The visuals of a PowerPoint presentation can only be effective if it supplements and supports the story that is being told. Keeping this in mind our experts created Global Automotive Industry Analysis Estimated Global Motor Vehicle Production By Type Graphics PDF to reduce the time that goes into designing the presentation. This way, you can concentrate on the message while our designers take care of providing you with the right template for the situation.

Global Automotive Industry Analysis Estimated Passenger Car Production By Selected Countries Professional PDF
This slide covers a graphical representation of forecasted passenger car manufacturing. It also includes key insights about China, Japan, Germany, India, South Korea, etc. This modern and well arranged Global Automotive Industry Analysis Estimated Passenger Car Production By Selected Countries Professional PDF provides lots of creative possibilities. It is very simple to customize and edit with the Powerpoint Software. Just drag and drop your pictures into the shapes. All facets of this template can be edited with Powerpoint no extra software is necessary. Add your own material, put your images in the places assigned for them, adjust the colors, and then you can show your slides to the world, with an animated slide included.

Global Automotive Industry Analysis Global Electric Vehicle Sales With Market Share In 2022 Topics PDF
This slide covers the graphical representation of the global EV market share along with BEV and PHEV sales. It also includes key insights about the global plugin electric car sales, chinas share in global EV sales, etc. Explore a selection of the finest Global Automotive Industry Analysis Global Electric Vehicle Sales With Market Share In 2022 Topics PDF here. With a plethora of professionally designed and pre made slide templates, you can quickly and easily find the right one for your upcoming presentation. You can use our Global Automotive Industry Analysis Global Electric Vehicle Sales With Market Share In 2022 Topics PDF to effectively convey your message to a wider audience. Slidegeeks has done a lot of research before preparing these presentation templates. The content can be personalized and the slides are highly editable. Grab templates today from Slidegeeks.
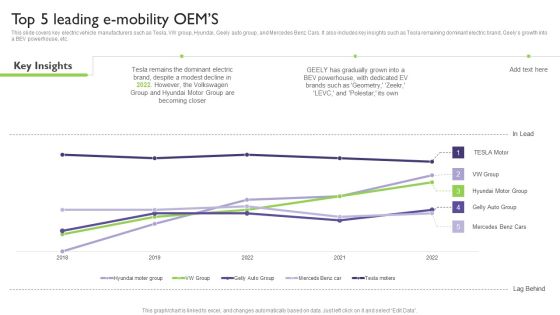
Global Automotive Industry Analysis Top 5 Leading E Mobility Oems Template PDF
This slide covers key electric vehicle manufacturers such as Tesla, VW group, Hyundai, Geely auto group, and Mercedes Benz Cars. It also includes key insights such as Tesla remaining dominant electric brand, Geelys growth into a BEV powerhouse, etc. Slidegeeks has constructed Global Automotive Industry Analysis Top 5 Leading E Mobility Oems Template PDF after conducting extensive research and examination. These presentation templates are constantly being generated and modified based on user preferences and critiques from editors. Here, you will find the most attractive templates for a range of purposes while taking into account ratings and remarks from users regarding the content. This is an excellent jumping off point to explore our content and will give new users an insight into our top notch PowerPoint Templates.
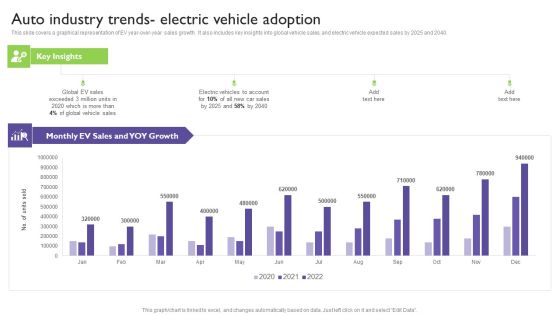
Global Automotive Industry Analysis Auto Industry Trends Electric Vehicle Adoption Rules PDF
This slide covers a graphical representation of EV year over year sales growth. It also includes key insights into global vehicle sales, and electric vehicle expected sales by 2025 and 2040. This Global Automotive Industry Analysis Auto Industry Trends Electric Vehicle Adoption Rules PDF from Slidegeeks makes it easy to present information on your topic with precision. It provides customization options, so you can make changes to the colors, design, graphics, or any other component to create a unique layout. It is also available for immediate download, so you can begin using it right away. Slidegeeks has done good research to ensure that you have everything you need to make your presentation stand out. Make a name out there for a brilliant performance.

KPI Dashboard To Track Process Products Sold By Insurance Topics PDF
This slide shows dashboard which can be used to compare insurance sales of current and previous year. It includes metrics such as monthly policy status, quarterly premium revenue, overall policy status, etc. Pitch your topic with ease and precision using this KPI Dashboard To Track Process Products Sold By Insurance Topics PDF. This layout presents information on Overall Policy Status, Quarterly Premium Revenue, Monthly Policy Status. It is also available for immediate download and adjustment. So, changes can be made in the color, design, graphics or any other component to create a unique layout.
Stock Performance Dashboard For Metrics Team Management Ppt Outline Icons PDF
This slide represents the dashboard for tracking the management team member, manager, and teams ability to ensure inventory accuracy over time. It includes KPIs such as inventory, average result area scores and result areas. Pitch your topic with ease and precision using this Stock Performance Dashboard For Metrics Team Management Ppt Outline Icons PDF. This layout presents information on Result areas, Metrics Team, Needs Help. It is also available for immediate download and adjustment. So, changes can be made in the color, design, graphics or any other component to create a unique layout.

Customer Service KPI Dashboard For Technical Support Ppt Model Vector PDF
This slide covers customer service KPI dashboard for technical support. It involves details such as total number of issues arise daily, overall average response time, number of issues by channel and top performing technical engineers. Pitch your topic with ease and precision using this Customer Service KPI Dashboard For Technical Support Ppt Model Vector PDF. This layout presents information on Overall Average, Response Time, Total Number, Issues Arise Daily. It is also available for immediate download and adjustment. So, changes can be made in the color, design, graphics or any other component to create a unique layout.

Human Capital Metrics For New Hire Ppt Pictures Brochure PDF
This graph or chart is linked to excel, and changes automatically based on data. Just left click on it and select Edit Data. Pitch your topic with ease and precision using this Human Capital Metrics For New Hire Ppt Pictures Brochure PDF. This layout presents information on Active Employee Count, New Hire Count, New Hire. It is also available for immediate download and adjustment. So, changes can be made in the color, design, graphics or any other component to create a unique layout.

Human Capital Metrics With Absenteeism Rate Ppt Infographic Template Ideas PDF
This graph or chart is linked to excel, and changes automatically based on data. Just left click on it and select Edit Data. Pitch your topic with ease and precision using this Human Capital Metrics With Absenteeism Rate Ppt Infographic Template Ideas PDF. This layout presents information on Overall Labor Effectiveness, OLE Department, Absenteeism. It is also available for immediate download and adjustment. So, changes can be made in the color, design, graphics or any other component to create a unique layout.
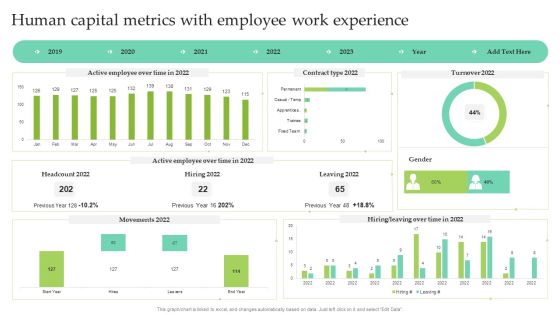
Human Capital Metrics With Employee Work Experience Ppt Show Images PDF
This graph or chart is linked to excel, and changes automatically based on data. Just left click on it and select Edit Data. Pitch your topic with ease and precision using this Human Capital Metrics With Employee Work Experience Ppt Show Images PDF. This layout presents information on Active Employee, Over Time, Contract Type 2022, Leaving 2022. It is also available for immediate download and adjustment. So, changes can be made in the color, design, graphics or any other component to create a unique layout.
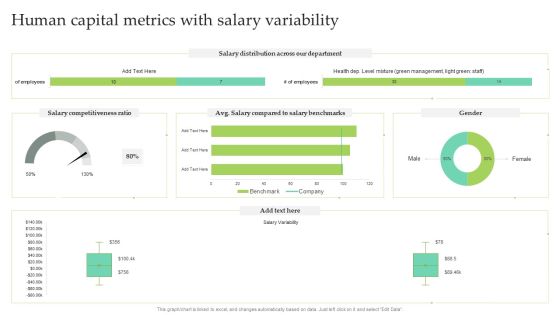
Human Capital Metrics With Salary Variability Ppt Infographic Template Designs PDF
This graph or chart is linked to excel, and changes automatically based on data. Just left click on it and select Edit Data. Pitch your topic with ease and precision using this Human Capital Metrics With Salary Variability Ppt Infographic Template Designs PDF. This layout presents information on Salary Distribution, Salary Competitiveness Ratio, Male. It is also available for immediate download and adjustment. So, changes can be made in the color, design, graphics or any other component to create a unique layout.
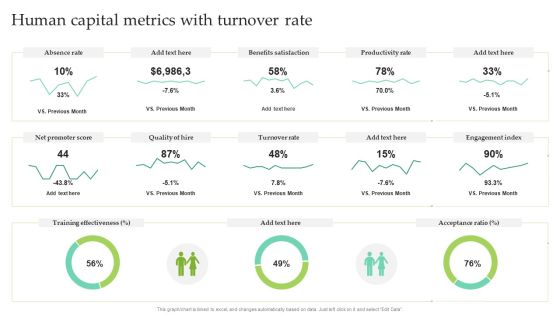
Human Capital Metrics With Turnover Rate Ppt Pictures Outline PDF
This graph or chart is linked to excel, and changes automatically based on data. Just left click on it and select Edit Data. Pitch your topic with ease and precision using this Human Capital Metrics With Turnover Rate Ppt Pictures Outline PDF. This layout presents information on Absence Rate, Benefits Satisfaction, Productivity Rate. It is also available for immediate download and adjustment. So, changes can be made in the color, design, graphics or any other component to create a unique layout.

Centralized Repository Data Lake Reporting Dashboard Icons PDF
This slide represents the data lake reporting dashboard by covering the total number of users, total lake size, trusted zone size, conversion rate, and retention. Find a pre designed and impeccable Centralized Repository Data Lake Reporting Dashboard Icons PDF. The templates can ace your presentation without additional effort. You can download these easy to edit presentation templates to make your presentation stand out from others. So, what are you waiting for Download the template from Slidegeeks today and give a unique touch to your presentation.

Buy Side Advisory Services In M And A Management Vs Consensus Revenue Forecast Ideas PDF
The graph depicts a revenue comparison between management and consensus. It shows historical 2015 to 2020 and projected revenue 2021 to 2024.Want to ace your presentation in front of a live audience Our Buy Side Advisory Services In M And A Management Vs Consensus Revenue Forecast Ideas PDF can help you do that by engaging all the users towards you. Slidegeeks experts have put their efforts and expertise into creating these impeccable powerpoint presentations so that you can communicate your ideas clearly. Moreover, all the templates are customizable, and easy-to-edit and downloadable. Use these for both personal and commercial use.

Buy Side Advisory Services In M And A Mergers And Acquisitions By Sector Introduction PDF
The slide illustrates the graph of number of merger and acquisition deals by sector that the company has completed in last five years. It also covers key facts CAGR growth, deal value etc. related to merger and acquisition deals of the company.There are so many reasons you need a Buy Side Advisory Services In M And A Mergers And Acquisitions By Sector Introduction PDF. The first reason is you can not spend time making everything from scratch, Thus, Slidegeeks has made presentation templates for you too. You can easily download these templates from our website easily.

Buy Side Advisory Services In M And A Other Sectors Top Clients And Total Revenue Brochure PDF
The slide identifies a list of companys clients in various other sectors manufacturing, construction, financials services, energy. Mining, automobile etc. along with the total revenue from each sector for the year 2021.Get a simple yet stunning designed Buy Side Advisory Services In M And A Other Sectors Top Clients And Total Revenue Brochure PDF. It is the best one to establish the tone in your meetings. It is an excellent way to make your presentations highly effective. So, download this PPT today from Slidegeeks and see the positive impacts. Our easy-to-edit Buy Side Advisory Services In M And A Other Sectors Top Clients And Total Revenue Brochure PDF can be your go-to option for all upcoming conferences and meetings. So, what are you waiting for Grab this template today.

Buy Side Advisory Services In M And A Overview Of The Industry And Market Share Download PDF
The slide includes an overview of the industry as well as key facts market trends. Additionally, it provides market size for the year 2014 to 2023 and market share 2020 of the industry. Present like a pro with Buy Side Advisory Services In M And A Overview Of The Industry And Market Share Download PDF Create beautiful presentations together with your team, using our easy-to-use presentation slides. Share your ideas in real-time and make changes on the fly by downloading our templates. So whether you are in the office, on the go, or in a remote location, you can stay in sync with your team and present your ideas with confidence. With Slidegeeks presentation got a whole lot easier. Grab these presentations today.

Buy Side Advisory Services In M And A Top Deals Count Split By Sectors Summary PDF
The slide covers the name and designation of the team executivesCEO, CFO, Department head etc. of the company. It also provides the Major Transaction Experience work experience of the executives. If your project calls for a presentation, then Slidegeeks is your go-to partner because we have professionally designed, easy-to-edit templates that are perfect for any presentation. After downloading, you can easily edit Buy Side Advisory Services In M And A Top Deals Count Split By Sectors Summary PDF and make the changes accordingly. You can rearrange slides or fill them with different images. Check out all the handy templates.
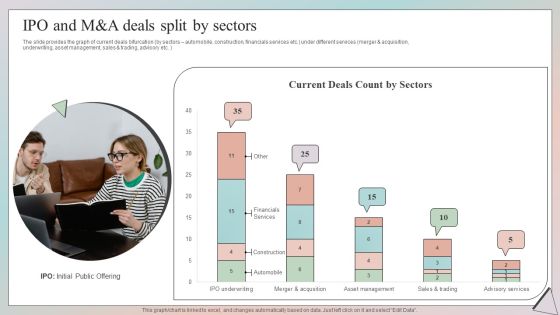
Grow Capital Through Equity Debt IPO And M And A Deals Split By Sectors Template PDF
The slide covers the fee structure of the company for its services. The company charges, retainer fee, success fee and other fee minimum fee, ancillary fee, non-cash payments etc. as per the transaction value of the deal.There are so many reasons you need a Grow Capital Through Equity Debt IPO And M And A Deals Split By Sectors Template PDF. The first reason is you can not spend time making everything from scratch, Thus, Slidegeeks has made presentation templates for you too. You can easily download these templates from our website easily.

Grow Capital Through Equity Debt Major Client And Total Revenue In Other Sectors Microsoft PDF
The slide provides a list of companys clients in different sectors manufacturing, construction, financials services, energy. Mining, automobile etc. along with the total revenue from each sector.Do you have an important presentation coming up Are you looking for something that will make your presentation stand out from the rest Look no further than Grow Capital Through Equity Debt Major Client And Total Revenue In Other Sectors Microsoft PDF. With our professional designs, you can trust that your presentation will pop and make delivering it a smooth process. And with Slidegeeks, you can trust that your presentation will be unique and memorable. So why wait Grab Grow Capital Through Equity Debt Major Client And Total Revenue In Other Sectors Microsoft PDF today and make your presentation stand out from the rest.

Application Of SDLC Models In Different Sectors Phases Of Software Development Procedure Clipart PDF
This slide represents the application of software development life cycle models in different sectors, such as software houses, software solution providers, government, and telecom.From laying roadmaps to briefing everything in detail, our templates are perfect for you. You can set the stage with your presentation slides. All you have to do is download these easy-to-edit and customizable templates. Application Of SDLC Models In Different Sectors Phases Of Software Development Procedure Clipart PDF will help you deliver an outstanding performance that everyone would remember and praise you for. Do download this presentation today.
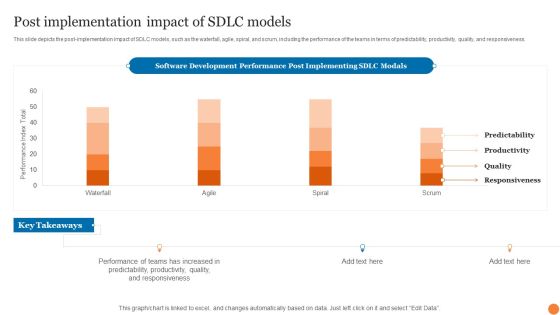
Post Implementation Impact Of SDLC Models Phases Of Software Development Procedure Portrait PDF
This slide shows the waterfall model phases, including requirement gathering analysis, system design, implementation, integration testing, Deployment, and maintenance.Present like a pro with Post Implementation Impact Of SDLC Models Phases Of Software Development Procedure Portrait PDF Create beautiful presentations together with your team, using our easy-to-use presentation slides. Share your ideas in real-time and make changes on the fly by downloading our templates. So whether you are in the office, on the go, or in a remote location, you can stay in sync with your team and present your ideas with confidence. With Slidegeeks presentation got a whole lot easier. Grab these presentations today.
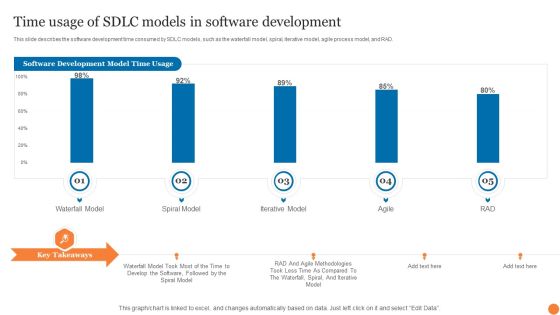
Time Usage Of SDLC Models In Software Development Phases Of Software Development Procedure Brochure PDF
This slide describes the software development time consumed by SDLC models, such as the waterfall model, spiral, iterative model, agile process model, and RAD.Slidegeeks has constructed Time Usage Of SDLC Models In Software Development Phases Of Software Development Procedure Brochure PDF after conducting extensive research and examination. These presentation templates are constantly being generated and modified based on user preferences and critiques from editors. Here, you will find the most attractive templates for a range of purposes while taking into account ratings and remarks from users regarding the content. This is an excellent jumping-off point to explore our content and will give new users an insight into our top-notch PowerPoint Templates.
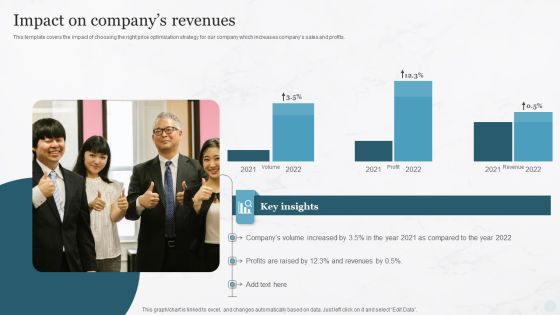
Impact On Companys Revenues Pricing Strategies For New Product In Market Information PDF
This template covers the impact of choosing the right price optimization strategy for our company which increases companys sales and profits.From laying roadmaps to briefing everything in detail, our templates are perfect for you. You can set the stage with your presentation slides. All you have to do is download these easy-to-edit and customizable templates. Impact On Companys Revenues Pricing Strategies For New Product In Market Information PDF will help you deliver an outstanding performance that everyone would remember and praise you for. Do download this presentation today.
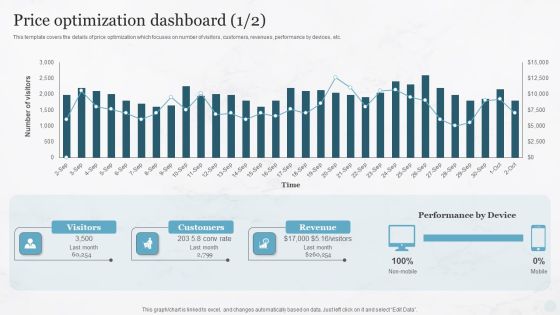
Price Optimization Dashboard Pricing Strategies For New Product In Market Infographics PDF
This template covers the details of price optimization which focuses on number of visitors, customers, revenues, performance by devices, etc.Find highly impressive Price Optimization Dashboard Pricing Strategies For New Product In Market Infographics PDF on Slidegeeks to deliver a meaningful presentation. You can save an ample amount of time using these presentation templates. No need to worry to prepare everything from scratch because Slidegeeks experts have already done a huge research and work for you. You need to download Price Optimization Dashboard Pricing Strategies For New Product In Market Infographics PDF for your upcoming presentation. All the presentation templates are 100precent editable and you can change the color and personalize the content accordingly. Download now.
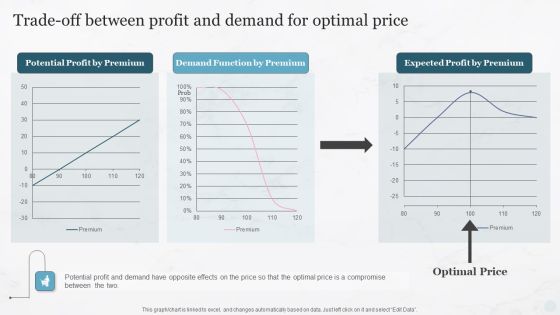
Trade Off Between Profit And Demand For Optimal Price Pricing Strategies Structure PDF
Coming up with a presentation necessitates that the majority of the effort goes into the content and the message you intend to convey. The visuals of a PowerPoint presentation can only be effective if it supplements and supports the story that is being told. Keeping this in mind our experts created Trade Off Between Profit And Demand For Optimal Price Pricing Strategies Structure PDF to reduce the time that goes into designing the presentation. This way, you can concentrate on the message while our designers take care of providing you with the right template for the situation.
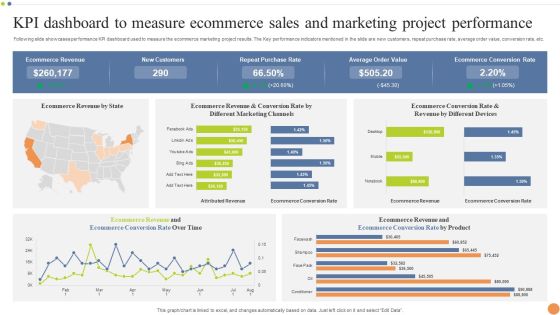
KPI Dashboard To Measure Ecommerce Sales And Marketing Project Performance Portrait PDF
Following slide showcases performance KPI dashboard used to measure the ecommerce marketing project results. The Key performance indicators mentioned in the slide are new customers, repeat purchase rate, average order value, conversion rate, etc. Pitch your topic with ease and precision using this KPI Dashboard To Measure Ecommerce Sales And Marketing Project Performance Portrait PDF. This layout presents information on Purchase Rate, Average Order Value, Ecommerce Conversion Rate. It is also available for immediate download and adjustment. So, changes can be made in the color, design, graphics or any other component to create a unique layout.
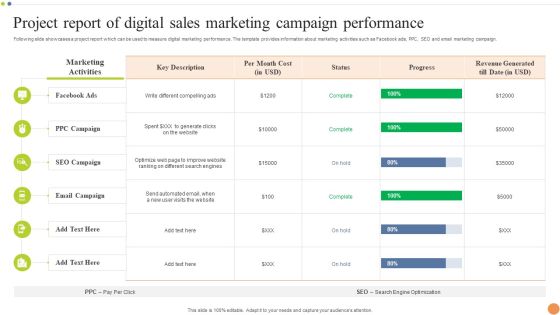
Project Report Of Digital Sales Marketing Campaign Performance Professional PDF
Following slide showcases a project report which can be used to measure digital marketing performance. The template provides information about marketing activities such as Facebook ads, PPC, SEO and email marketing campaign. Pitch your topic with ease and precision using this Project Report Of Digital Sales Marketing Campaign Performance Professional PDF. This layout presents information on Email Campaign, SEO Campaign, Marketing Activities. It is also available for immediate download and adjustment. So, changes can be made in the color, design, graphics or any other component to create a unique layout.
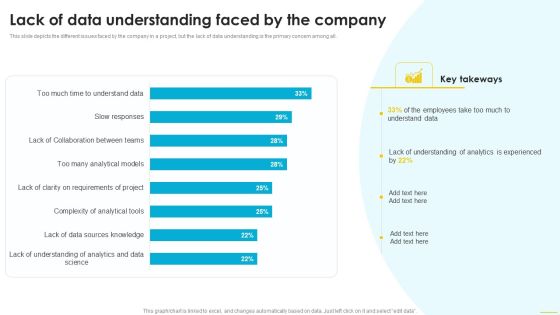
Lack Of Data Understanding Faced By The Company Diagrams PDF
This slide depicts the different issues faced by the company in a project, but the lack of data understanding is the primary concern among all. This modern and well arranged Lack Of Data Understanding Faced By The Company Diagrams PDF provides lots of creative possibilities. It is very simple to customize and edit with the Powerpoint Software. Just drag and drop your pictures into the shapes. All facets of this template can be edited with Powerpoint no extra software is necessary. Add your own material, put your images in the places assigned for them, adjust the colors, and then you can show your slides to the world, with an animated slide included.
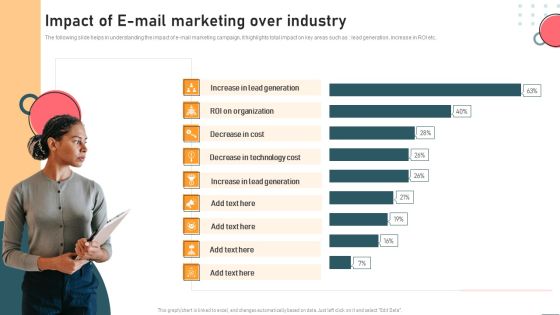
Impact Of E Mail Marketing Over Industry Information PDF
The following slide helps in understanding the impact of e mail marketing campaign, it highlights total impact on key areas such as lead generation, increase in ROI etc. From laying roadmaps to briefing everything in detail, our templates are perfect for you. You can set the stage with your presentation slides. All you have to do is download these easy to edit and customizable templates. Impact Of E Mail Marketing Over Industry Information PDF will help you deliver an outstanding performance that everyone would remember and praise you for. Do download this presentation today.

Average Transactional Value Per User In Fintech Market Guidelines PDF
This slide portrays informational stats on average transactional value per user in FinTech market. Here the graph shows that digital payment segment will record a an average transaction of dollar 3,556 per user. Here you can discover an assortment of the finest PowerPoint and Google Slides templates. With these templates, you can create presentations for a variety of purposes while simultaneously providing your audience with an eye-catching visual experience. Download Average Transactional Value Per User In Fintech Market Guidelines PDF to deliver an impeccable presentation. These templates will make your job of preparing presentations much quicker, yet still, maintain a high level of quality. Slidegeeks has experienced researchers who prepare these templates and write high quality content for you. Later on, you can personalize the content by editing the Average Transactional Value Per User In Fintech Market Guidelines PDF.

Determining Current And Future Qualification Demand Of Employees Slides PDF
Following slide shows informational stats on employees current and future qualification demand. Here the graph shows that there will be a huge increase in the demand for employees having qualification in data science after five years. This Determining Current And Future Qualification Demand Of Employees Slides PDF from Slidegeeks makes it easy to present information on your topic with precision. It provides customization options, so you can make changes to the colors, design, graphics, or any other component to create a unique layout. It is also available for immediate download, so you can begin using it right away. Slidegeeks has done good research to ensure that you have everything you need to make your presentation stand out. Make a name out there for a brilliant performance.
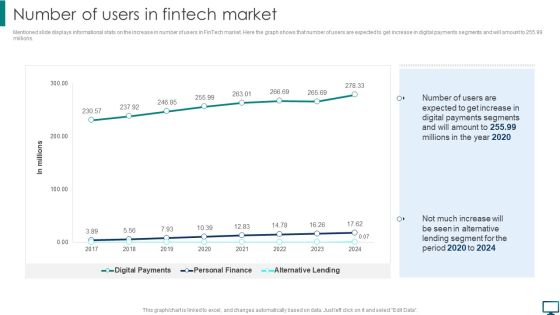
Optimizing Advanced Technology To Gain Competitive Edge Number Of Users In Fintech Market Elements PDF
Mentioned slide displays informational stats on the increase in number of users in FinTech market. Here the graph shows that number of users are expected to get increase in digital payments segments and will amount to 255.99 millions. Find a pre designed and impeccable Optimizing Advanced Technology To Gain Competitive Edge Number Of Users In Fintech Market Elements PDF. The templates can ace your presentation without additional effort. You can download these easy to edit presentation templates to make your presentation stand out from others. So, what are you waiting for Download the template from Slidegeeks today and give a unique touch to your presentation.
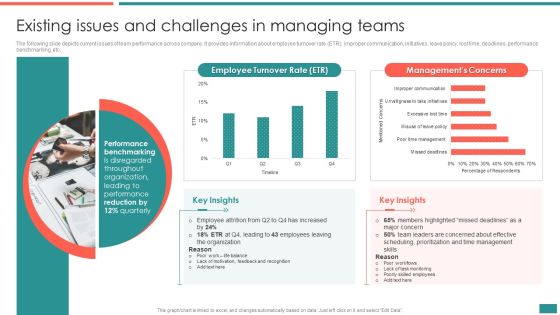
Existing Issues And Challenges In Managing Teams Building Efficient Workplace Performance Information PDF
The following slide depicts current issues of team performance across company. It provides information about employee turnover rate ETR, improper communication, initiatives, leave policy, lost time, deadlines, performance benchmarking, etc.Find a pre-designed and impeccable Existing Issues And Challenges In Managing Teams Building Efficient Workplace Performance Information PDF. The templates can ace your presentation without additional effort. You can download these easy-to-edit presentation templates to make your presentation stand out from others. So, what are you waiting for Download the template from Slidegeeks today and give a unique touch to your presentation.
Sales Team Performance Management And Tracking Dashboard Building Efficient Workplace Performance Summary PDF
This slide showcases evaluating teams through 360 degree feedback method. It provides information about reliability, loyalty, initiatives, participitative, communication skills, writing skills, feedback, decision making, quick grasping, etc.Crafting an eye-catching presentation has never been more straightforward. Let your presentation shine with this tasteful yet straightforward Sales Team Performance Management And Tracking Dashboard Building Efficient Workplace Performance Summary PDF template. It offers a minimalistic and classy look that is great for making a statement. The colors have been employed intelligently to add a bit of playfulness while still remaining professional. Construct the ideal Sales Team Performance Management And Tracking Dashboard Building Efficient Workplace Performance Summary PDF that effortlessly grabs the attention of your audience Begin now and be certain to wow your customers.

Dashboard To Evaluate Marketing Campaign Performance Ecommerce Marketing Plan To Enhance Microsoft PDF
This slide represents dashboard to evaluate marketing campaign performance. It includes revenue, sales, total orders, order value, conversion rate etc.Do you have to make sure that everyone on your team knows about any specific topic I yes, then you should give Dashboard To Evaluate Marketing Campaign Performance Ecommerce Marketing Plan To Enhance Microsoft PDF a try. Our experts have put a lot of knowledge and effort into creating this impeccable Dashboard To Evaluate Marketing Campaign Performance Ecommerce Marketing Plan To Enhance Microsoft PDF. You can use this template for your upcoming presentations, as the slides are perfect to represent even the tiniest detail. You can download these templates from the Slidegeeks website and these are easy to edit. So grab these today.

Key Reasons For Shopping Cart Abandonment Ecommerce Marketing Plan To Enhance Structure PDF
This slide represents key reasons for shopping cart abandonment. It showcase reasons such as lack of express shipping, no coupon code, long and confusing checkout etc.Find highly impressive Key Reasons For Shopping Cart Abandonment Ecommerce Marketing Plan To Enhance Structure PDF on Slidegeeks to deliver a meaningful presentation. You can save an ample amount of time using these presentation templates. No need to worry to prepare everything from scratch because Slidegeeks experts have already done a huge research and work for you. You need to download Key Reasons For Shopping Cart Abandonment Ecommerce Marketing Plan To Enhance Structure PDF for your upcoming presentation. All the presentation templates are 100precent editable and you can change the color and personalize the content accordingly. Download now.
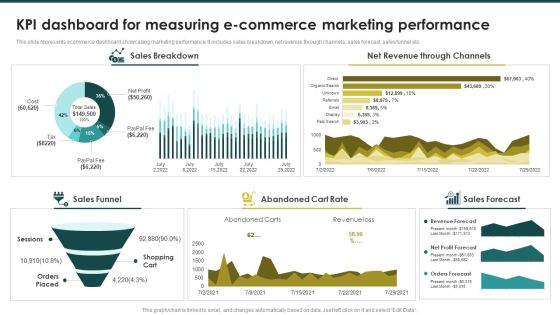
KPI Dashboard For Measuring Ecommerce Marketing Ecommerce Marketing Plan To Enhance Brochure PDF
This slide represents ecommerce dashboard showcasing marketing performance. It includes sales breakdown, net revenue through channels, sales forecast, sales funnel etc.Find highly impressive KPI Dashboard For Measuring Ecommerce Marketing Ecommerce Marketing Plan To Enhance Brochure PDF on Slidegeeks to deliver a meaningful presentation. You can save an ample amount of time using these presentation templates. No need to worry to prepare everything from scratch because Slidegeeks experts have already done a huge research and work for you. You need to download KPI Dashboard For Measuring Ecommerce Marketing Ecommerce Marketing Plan To Enhance Brochure PDF for your upcoming presentation. All the presentation templates are 100precent editable and you can change the color and personalize the content accordingly. Download now.

Cloud Performance Tracking Dashboard Managing Complexity Of Multiple Cloud Platforms Download PDF
This slide covers the key performance indicators for tracking performance of the cloud such as violations break down, sources, rules and severity.Presenting this PowerPoint presentation, titled Cloud Performance Tracking Dashboard Managing Complexity Of Multiple Cloud Platforms Download PDF, with topics curated by our researchers after extensive research. This editable presentation is available for immediate download and provides attractive features when used. Download now and captivate your audience. Presenting this Cloud Performance Tracking Dashboard Managing Complexity Of Multiple Cloud Platforms Download PDF. Our researchers have carefully researched and created these slides with all aspects taken into consideration. This is a completely customizable Cloud Performance Tracking Dashboard Managing Complexity Of Multiple Cloud Platforms Download PDF that is available for immediate downloading. Download now and make an impact on your audience. Highlight the attractive features available with our PPTs.
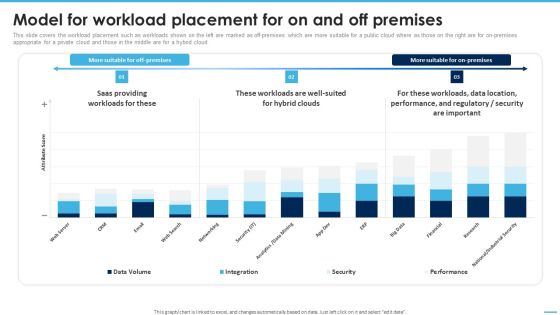
Model For Workload Placement For On And Off Premises Managing Complexity Of Multiple Cloud Platforms Demonstration PDF
This slide covers the workload placement such as workloads shown on the left are marked as off-premises which are more suitable for a public cloud where as those on the right are for on-premises appropriate for a private cloud and those in the middle are for a hybrid cloud.There are so many reasons you need a Model For Workload Placement For On And Off Premises Managing Complexity Of Multiple Cloud Platforms Demonstration PDF. The first reason is you can not spend time making everything from scratch, Thus, Slidegeeks has made presentation templates for you too. You can easily download these templates from our website easily.

Problems Faced By Company Due To Unmanaged Multicloud Managing Complexity Of Multiple Cloud Platforms Brochure PDF
This slide covers the problems faced by the company due to complex multi cloud services such as no decision making power regarding it services, large amount spend in cloud services, leaky cybersecurity defence and many more. Find highly impressive Problems Faced By Company Due To Unmanaged Multicloud Managing Complexity Of Multiple Cloud Platforms Brochure PDF on Slidegeeks to deliver a meaningful presentation. You can save an ample amount of time using these presentation templates. No need to worry to prepare everything from scratch because Slidegeeks experts have already done a huge research and work for you. You need to download Problems Faced By Company Due To Unmanaged Multicloud Managing Complexity Of Multiple Cloud Platforms Brochure PDF for your upcoming presentation. All the presentation templates are 100precent editable and you can change the color and personalize the content accordingly. Download now.
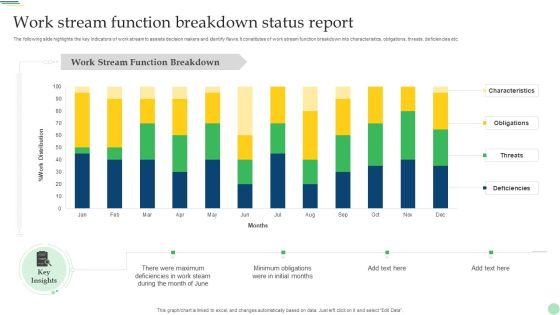
Work Stream Function Breakdown Status Report Demonstration PDF
The following slide highlights the key indicators of work stream to assists decision makers and identify flaws. It constitutes of work stream function breakdown into characteristics, obligations, threats, deficiencies etc. Pitch your topic with ease and precision using this Work Stream Function Breakdown Status Report Demonstration PDF. This layout presents information on Characteristics, Obligations, Threats, Deficiencies. It is also available for immediate download and adjustment. So, changes can be made in the color, design, graphics or any other component to create a unique layout.

Analysis Of Grains Fruits And Vegetables Segment In Food Manufacturing Industry Industry Analysis Of Food Demonstration PDF
This slide showcase the market analysis of grains fruits and vegetables in food manufacturing industry providing information regarding top states, total production both weight and value wise, key export destinations and innovations in processing equipment.Formulating a presentation can take up a lot of effort and time, so the content and message should always be the primary focus. The visuals of the PowerPoint can enhance the presenters message, so our Analysis Of Grains Fruits And Vegetables Segment In Food Manufacturing Industry Industry Analysis Of Food Demonstration PDF was created to help save time. Instead of worrying about the design, the presenter can concentrate on the message while our designers work on creating the ideal templates for whatever situation is needed. Slidegeeks has experts for everything from amazing designs to valuable content, we have put everything into Analysis Of Grains Fruits And Vegetables Segment In Food Manufacturing Industry Industry Analysis Of Food Demonstration PDF.

Overview Of Food Manufacturing Industry Industry Analysis Of Food Sample PDF
This slide provides an overview of food manufacturing industry in terms of contribution towards GDP, estimated revenues, expected compound annual growth rate along with few key stats.Want to ace your presentation in front of a live audience Our Overview Of Food Manufacturing Industry Industry Analysis Of Food Sample PDF can help you do that by engaging all the users towards you.. Slidegeeks experts have put their efforts and expertise into creating these impeccable powerpoint presentations so that you can communicate your ideas clearly. Moreover, all the templates are customizable, and easy-to-edit and downloadable. Use these for both personal and commercial use.

Performance Monitoring Dashboard For Consumer Goods Industry Analysis Of Food Infographics PDF
This slide showcase the performance monitoring dashboard for consumer goods providing information regarding the overview of food and beverages sales, top selling products and on shelf availability.There are so many reasons you need a Performance Monitoring Dashboard For Consumer Goods Industry Analysis Of Food Infographics PDF. The first reason is you can not spend time making everything from scratch, Thus, Slidegeeks has made presentation templates for you too. You can easily download these templates from our website easily.

Retail Store Data Map Dashboard Ppt PowerPoint Presentation Gallery Display PDF
This slide shows retail store data inventory dashboard. It provides information such as units sold, on hand, stock availability, top selling items, average inventory value by product category, etc. Pitch your topic with ease and precision using this Retail Store Data Map Dashboard Ppt PowerPoint Presentation Gallery Display PDF. This layout presents information on Inventory Turn, Over Ratio, Gross Margin ROI. It is also available for immediate download and adjustment. So, changes can be made in the color, design, graphics or any other component to create a unique layout.
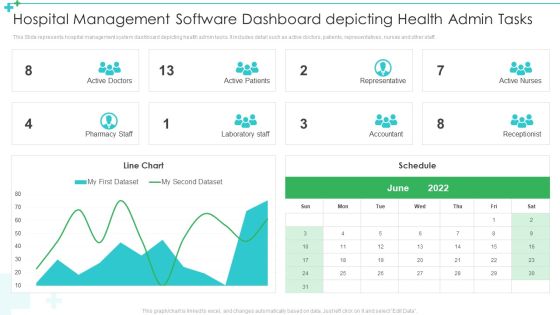
Hospital Management Software Dashboard Depicting Health Admin Tasks Ppt Pictures Inspiration PDF
This Slide represents hospital management system dashboard depicting health admin tasks. It includes detail such as active doctors, patients, representatives, nurses and other staff. Pitch your topic with ease and precision using this Hospital Management Software Dashboard Depicting Health Admin Tasks Ppt Pictures Inspiration PDF. This layout presents information on Active Doctors, Active Patients, Representative. It is also available for immediate download and adjustment. So, changes can be made in the color, design, graphics or any other component to create a unique layout.

Hospital Management Software Dashboard To Track Covid 19 Cases Ppt Professional Inspiration PDF
This slide shows hospital management system dashboard for tracking details of COVID-19 cases. It includes information about confirmed cases, recovered, deaths, death rate, etc. Pitch your topic with ease and precision using this Hospital Management Software Dashboard To Track Covid 19 Cases Ppt Professional Inspiration PDF. This layout presents information on Recovered Cases, Deaths, Mortality. It is also available for immediate download and adjustment. So, changes can be made in the color, design, graphics or any other component to create a unique layout.

Managing Cyber Security Incident Response KPI Dashboard Ppt Layouts Shapes PDF
This slide covers cyber security incident response KPI dashboard. It involves details such as intent alarm, event trend sources, event trend, sensor activity, major operating systems and asset information. Pitch your topic with ease and precision using this Managing Cyber Security Incident Response KPI Dashboard Ppt Layouts Shapes PDF. This layout presents information on Top Alarms Method, Alarms Intent, Timely Event Trend. It is also available for immediate download and adjustment. So, changes can be made in the color, design, graphics or any other component to create a unique layout.

Change Order Administration Dashboard With Priority Assessment Ppt Portfolio Inspiration PDF
This slide showcases change order management dashboard with priority assessment. It provides information about order stats, summary, latest change orders and priority according to rank. Pitch your topic with ease and precision using this Change Order Administration Dashboard With Priority Assessment Ppt Portfolio Inspiration PDF. This layout presents information on Change Orders Priority, Change Order Stats, Change Orders Summary. It is also available for immediate download and adjustment. So, changes can be made in the color, design, graphics or any other component to create a unique layout.

Agile Performance Evaluation Metrics Agile IT Methodology In Project Management Brochure PDF
This slide covers the metrics used by the organisation to measure agile capability on the basis of product performance, security level and user satisfaction.Find highly impressive Agile Performance Evaluation Metrics Agile IT Methodology In Project Management Brochure PDF on Slidegeeks to deliver a meaningful presentation. You can save an ample amount of time using these presentation templates. No need to worry to prepare everything from scratch because Slidegeeks experts have already done a huge research and work for you. You need to download Agile Performance Evaluation Metrics Agile IT Methodology In Project Management Brochure PDF for your upcoming presentation. All the presentation templates are 100precent editable and you can change the color and personalize the content accordingly. Download now.

Most Used Agile Methodologies And Approaches Agile IT Methodology In Project Management Template PDF
This slide covers agile most used methodologies to be used by company and scrum approaches. Explore a selection of the finest Most Used Agile Methodologies And Approaches Agile IT Methodology In Project Management Template PDF here. With a plethora of professionally designed and pre-made slide templates, you can quickly and easily find the right one for your upcoming presentation. You can use our Most Used Agile Methodologies And Approaches Agile IT Methodology In Project Management Template PDF to effectively convey your message to a wider audience. Slidegeeks has done a lot of research before preparing these presentation templates. The content can be personalized and the slides are highly editable. Grab templates today from Slidegeeks.

Survey Of Issues Faced By IT Employees Agile IT Methodology In Project Management Diagrams PDF
This slide covers a graph that depicts the problems what IT employees are facing in organisation while choosing software development methods by conducting a survey also showing key takeaways for the same.Get a simple yet stunning designed Survey Of Issues Faced By IT Employees Agile IT Methodology In Project Management Diagrams PDF. It is the best one to establish the tone in your meetings. It is an excellent way to make your presentations highly effective. So, download this PPT today from Slidegeeks and see the positive impacts. Our easy-to-edit Survey Of Issues Faced By IT Employees Agile IT Methodology In Project Management Diagrams PDF can be your go-to option for all upcoming conferences and meetings. So, what are you waiting for Grab this template today.
Performance Tracking Dashboard For 5G Technology Difference Between 4G And 5G Network Introduction PDF
This slide describes the performance tracking dashboard for 5G technology by covering the details of subscribers, qoe, consumption, customer support, coverage, devices, and dimensions.Find a pre-designed and impeccable Performance Tracking Dashboard For 5G Technology Difference Between 4G And 5G Network Introduction PDF. The templates can ace your presentation without additional effort. You can download these easy-to-edit presentation templates to make your presentation stand out from others. So, what are you waiting for Download the template from Slidegeeks today and give a unique touch to your presentation.

Social Media Channels Used By Recruiters Tactical Plan To Enhance Social Media Hiring Process Summary PDF
This slide covers social media channels used by recruiters which shows twitter, facebook, youtube, blog, instagram and linkedin having main focus on recruiting high-quality candidates. Do you have an important presentation coming up Are you looking for something that will make your presentation stand out from the rest Look no further than Social Media Channels Used By Recruiters Tactical Plan To Enhance Social Media Hiring Process Summary PDF. With our professional designs, you can trust that your presentation will pop and make delivering it a smooth process. And with Slidegeeks, you can trust that your presentation will be unique and memorable. So why wait Grab Social Media Channels Used By Recruiters Tactical Plan To Enhance Social Media Hiring Process Summary PDF today and make your presentation stand out from the rest.
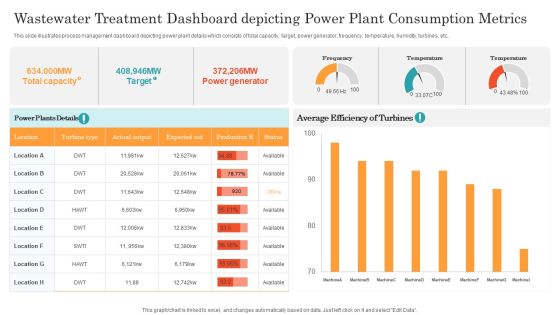
Wastewater Treatment Dashboard Depicting Power Plant Consumption Metrics Ppt Slides Tips PDF
This slide illustrates process management dashboard depicting power plant details which consists of total capacity, target, power generator, frequency, temperature, humidity, turbines, etc. Pitch your topic with ease and precision using this Wastewater Treatment Dashboard Depicting Power Plant Consumption Metrics Ppt Slides Tips PDF. This layout presents information on Power Generator, Target, Actual Output. It is also available for immediate download and adjustment. So, changes can be made in the color, design, graphics or any other component to create a unique layout.

Market Chart Showing Revenue Breakdown Of IT Products Ppt File Elements PDF
This slide shows the revenue comparison graph of IT products over last six months. IT products covered in the slide are hardware and software. Pitch your topic with ease and precision using this Market Chart Showing Revenue Breakdown Of IT Products Ppt File Elements PDF. This layout presents information on Hardware, Software, Key Insights. It is also available for immediate download and adjustment. So, changes can be made in the color, design, graphics or any other component to create a unique layout.

Product Market Share Chart Of Electronic Company Ppt Gallery Graphic Tips PDF
This slide shows the percentage of market share graph of electronic company products. It includes mobile phone, laptop, tablet, computer and others devices. Pitch your topic with ease and precision using this Product Market Share Chart Of Electronic Company Ppt Gallery Graphic Tips PDF. This layout presents information on Mobile Phone, Computer, Laptop, Tablet. It is also available for immediate download and adjustment. So, changes can be made in the color, design, graphics or any other component to create a unique layout.

Usage Trend Chart Of Skincare Product Market Ppt Slides Graphics Download PDF
This slide shows market trend graph of skincare product usage in four quarters. It also indicates that product A is most preferred by the customers. Pitch your topic with ease and precision using this Usage Trend Chart Of Skincare Product Market Ppt Slides Graphics Download PDF. This layout presents information on Trend Product, Skincare Product, Quarter Due. It is also available for immediate download and adjustment. So, changes can be made in the color, design, graphics or any other component to create a unique layout.

Impact Of Effective HR Communication On Employees Demonstration PDF
This slide showcases positive impact of HR communication on workforce. The slide depicts increased productivity and decreased employee turnover. There are so many reasons you need a Impact Of Effective HR Communication On Employees Demonstration PDF. The first reason is you can not spend time making everything from scratch, Thus, Slidegeeks has made presentation templates for you too. You can easily download these templates from our website easily.

IT System Risk Management Guide Top IT Risks Reported At The Workplace Infographics PDF
This slide highlights the top IT risks reported at workplace which includes cyber threats, data loss, social engineering attacks, regulatory incidents, domain based threats and denial of service. Do you have to make sure that everyone on your team knows about any specific topic I yes, then you should give IT System Risk Management Guide Top IT Risks Reported At The Workplace Infographics PDF a try. Our experts have put a lot of knowledge and effort into creating this impeccable IT System Risk Management Guide Top IT Risks Reported At The Workplace Infographics PDF. You can use this template for your upcoming presentations, as the slides are perfect to represent even the tiniest detail. You can download these templates from the Slidegeeks website and these are easy to edit. So grab these today.

Ineffective Product Marketing Impact On Customer Retention Rate Sample PDF
This slide shows graphical presentation of impact of ineffective marketing on customer retention rate. Additionally, it provides the impact and reason behind the decline in retention rate. Here you can discover an assortment of the finest PowerPoint and Google Slides templates. With these templates, you can create presentations for a variety of purposes while simultaneously providing your audience with an eye catching visual experience. Download Ineffective Product Marketing Impact On Customer Retention Rate Sample PDF to deliver an impeccable presentation. These templates will make your job of preparing presentations much quicker, yet still, maintain a high level of quality. Slidegeeks has experienced researchers who prepare these templates and write high quality content for you. Later on, you can personalize the content by editing the Ineffective Product Marketing Impact On Customer Retention Rate Sample PDF.
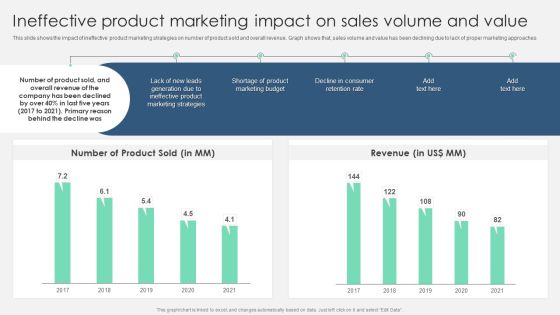
Ineffective Product Marketing Impact On Sales Volume And Value Graphics PDF
This slide shows the impact of ineffective product marketing strategies on number of product sold and overall revenue. Graph shows that, sales volume and value has been declining due to lack of proper marketing approaches. This Ineffective Product Marketing Impact On Sales Volume And Value Graphics PDF from Slidegeeks makes it easy to present information on your topic with precision. It provides customization options, so you can make changes to the colors, design, graphics, or any other component to create a unique layout. It is also available for immediate download, so you can begin using it right away. Slidegeeks has done good research to ensure that you have everything you need to make your presentation stand out. Make a name out there for a brilliant performance.

Information Technology Due Diligence Checklist Guide For Successful Merger And Acquisition Pictures PDF
Mentioned slide showcases due diligence checklist to measure IT infrastructure health of the target company. Here the health is monitored based on infrastructure availability, telecom system, data analytics, security and compliance.Slidegeeks has constructed Information Technology Due Diligence Checklist Guide For Successful Merger And Acquisition Pictures PDF after conducting extensive research and examination. These presentation templates are constantly being generated and modified based on user preferences and critiques from editors. Here, you will find the most attractive templates for a range of purposes while taking into account ratings and remarks from users regarding the content. This is an excellent jumping-off point to explore our content and will give new users an insight into our top-notch PowerPoint Templates.

Dashboard For Tracking Impact Of Supply Chain Automation Inspiration PDF
This slide covers the dashboard for back-end tracking of overall impact automation. It include KPIs such as retailer capacity, warehouse capacity, truck efficiency, time to reach warehouse, sustainability, etc. Do you have an important presentation coming up Are you looking for something that will make your presentation stand out from the rest Look no further than Dashboard For Tracking Impact Of Supply Chain Automation Inspiration PDF. With our professional designs, you can trust that your presentation will pop and make delivering it a smooth process. And with Slidegeeks, you can trust that your presentation will be unique and memorable. So why wait Grab Dashboard For Tracking Impact Of Supply Chain Automation Inspiration PDF today and make your presentation stand out from the rest.

Dashboard For Tracking Impact Of Warehouse House Automation Pictures PDF
This slide covers the dashboard with after automation warehouse overview. It include KPIs such as autonomous robots status, robotic arms status, battery level, performance, time to return, etc. Find highly impressive Dashboard For Tracking Impact Of Warehouse House Automation Pictures PDF on Slidegeeks to deliver a meaningful presentation. You can save an ample amount of time using these presentation templates. No need to worry to prepare everything from scratch because Slidegeeks experts have already done a huge research and work for you. You need to download Dashboard For Tracking Impact Of Warehouse House Automation Pictures PDF for your upcoming presentation. All the presentation templates are 100precent editable and you can change the color and personalize the content accordingly. Download now.

Depicting Impact On Project Success Rate Strategies To Enhance Project Lifecycle Infographics PDF
This slide focuses on impact of project management plan on success rate which compares project success due to efficient scheduling, capable project team, etc.This Depicting Impact On Project Success Rate Strategies To Enhance Project Lifecycle Infographics PDF from Slidegeeks makes it easy to present information on your topic with precision. It provides customization options, so you can make changes to the colors, design, graphics, or any other component to create a unique layout. It is also available for immediate download, so you can begin using it right away. Slidegeeks has done good research to ensure that you have everything you need to make your presentation stand out. Make a name out there for a brilliant performance.
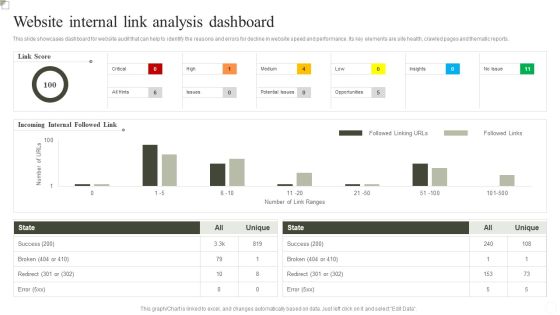
Website Internal Link Analysis Dashboard Ppt Inspiration Outline PDF
This slide showcases dashboard for website Analysis that can help to identify the reasons and errors for decline in website speed and performance. Its key elements are site health, crawled pages and thematic reports. Pitch your topic with ease and precision using this Website Internal Link Analysis Dashboard Ppt Inspiration Outline PDF. This layout presents information on Success, Incoming Internal Followed Link, Link Score. It is also available for immediate download and adjustment. So, changes can be made in the color, design, graphics or any other component to create a unique layout.

Architecture Engineering Planning Services Company Competitive Analysis Topics PDF
This slide highlights the architecture company competitive analysis on the basis of total experience, projects completed, registered architect and professional engineer, company offices, and free cash flow. Here you can discover an assortment of the finest PowerPoint and Google Slides templates. With these templates, you can create presentations for a variety of purposes while simultaneously providing your audience with an eye catching visual experience. Download Architecture Engineering Planning Services Company Competitive Analysis Topics PDF to deliver an impeccable presentation. These templates will make your job of preparing presentations much quicker, yet still, maintain a high level of quality. Slidegeeks has experienced researchers who prepare these templates and write high quality content for you. Later on, you can personalize the content by editing the Architecture Engineering Planning Services Company Competitive Analysis Topics PDF.

Architecture Engineering Planning Services Company EBITDA And Margin Guidelines PDF
This slide highlights the earnings before interest, taxes, depreciation, and amortization of the architecture company which showcases five year data through combination chart. This Architecture Engineering Planning Services Company EBITDA And Margin Guidelines PDF from Slidegeeks makes it easy to present information on your topic with precision. It provides customization options, so you can make changes to the colors, design, graphics, or any other component to create a unique layout. It is also available for immediate download, so you can begin using it right away. Slidegeeks has done good research to ensure that you have everything you need to make your presentation stand out. Make a name out there for a brilliant performance.

Customer Lead Development Management Strategies Lead Distribution Dashboard Elements PDF
Crafting an eye catching presentation has never been more straightforward. Let your presentation shine with this tasteful yet straightforward Customer Lead Development Management Strategies Lead Distribution Dashboard Elements PDF template. It offers a minimalistic and classy look that is great for making a statement. The colors have been employed intelligently to add a bit of playfulness while still remaining professional. Construct the ideal Customer Lead Development Management Strategies Lead Distribution Dashboard Elements PDF that effortlessly grabs the attention of your audience Begin now and be certain to wow your customers.

Customer Lead Development Management Strategies Less Contribution Of Converted Leads Structure PDF
This slide shows the contribution of converted leads and non converted leads from past few months. Coming up with a presentation necessitates that the majority of the effort goes into the content and the message you intend to convey. The visuals of a PowerPoint presentation can only be effective if it supplements and supports the story that is being told. Keeping this in mind our experts created Customer Lead Development Management Strategies Less Contribution Of Converted Leads Structure PDF to reduce the time that goes into designing the presentation. This way, you can concentrate on the message while our designers take care of providing you with the right template for the situation.

Customer Lead Development Management Strategies Negative Effects On Companys Financials Microsoft PDF
This slide shows the negative effects on companys financials such as decrease in total sales and total incomes of the company from last three years. This modern and well arranged Customer Lead Development Management Strategies Negative Effects On Companys Financials Microsoft PDF provides lots of creative possibilities. It is very simple to customize and edit with the Powerpoint Software. Just drag and drop your pictures into the shapes. All facets of this template can be edited with Powerpoint no extra software is necessary. Add your own material, put your images in the places assigned for them, adjust the colors, and then you can show your slides to the world, with an animated slide included.

Customer Lead Development Management Strategies Sales Dashboard Sample PDF
Explore a selection of the finest Customer Lead Development Management Strategies Sales Dashboard Sample PDF here. With a plethora of professionally designed and pre made slide templates, you can quickly and easily find the right one for your upcoming presentation. You can use our Customer Lead Development Management Strategies Sales Dashboard Sample PDF to effectively convey your message to a wider audience. Slidegeeks has done a lot of research before preparing these presentation templates. The content can be personalized and the slides are highly editable. Grab templates today from Slidegeeks.

Experian Company Outline Revenue And Dividend Per Share Demonstration PDF
This slide highlights the Experian revenue and dividend per share which includes revenue, benchmark EBIT and EBIT margin, Benchmark earning per share and divided per share. Here you can discover an assortment of the finest PowerPoint and Google Slides templates. With these templates, you can create presentations for a variety of purposes while simultaneously providing your audience with an eye catching visual experience. Download Experian Company Outline Revenue And Dividend Per Share Demonstration PDF to deliver an impeccable presentation. These templates will make your job of preparing presentations much quicker, yet still, maintain a high level of quality. Slidegeeks has experienced researchers who prepare these templates and write high quality content for you. Later on, you can personalize the content by editing the Experian Company Outline Revenue And Dividend Per Share Demonstration PDF.
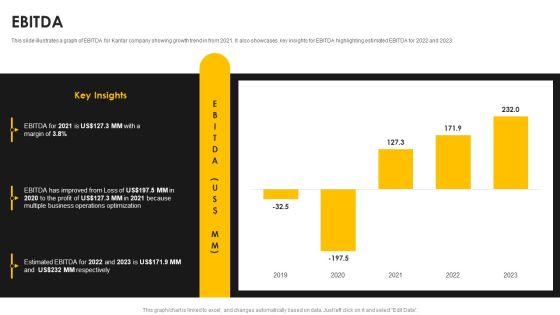
Kantar Consulting Company Outline Ebitda Information PDF
This slide illustrates a graph of EBITDA for Kantar company showing growth trend in from 2021. It also showcases key insights for EBITDA highlighting estimated EBITDA for 2022 and 2023. Here you can discover an assortment of the finest PowerPoint and Google Slides templates. With these templates, you can create presentations for a variety of purposes while simultaneously providing your audience with an eye catching visual experience. Download Kantar Consulting Company Outline Ebitda Information PDF to deliver an impeccable presentation. These templates will make your job of preparing presentations much quicker, yet still, maintain a high level of quality. Slidegeeks has experienced researchers who prepare these templates and write high quality content for you. Later on, you can personalize the content by editing the Kantar Consulting Company Outline Ebitda Information PDF.
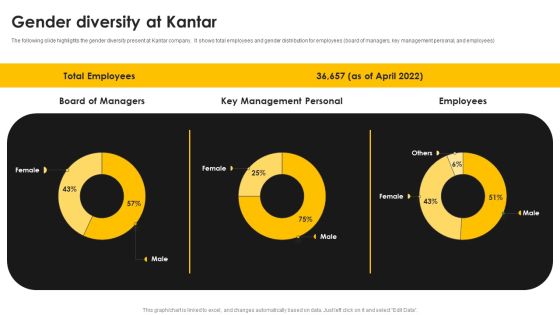
Kantar Consulting Company Outline Gender Diversity At Kantar Slides PDF
The following slide highlights the gender diversity present at Kantar company. It shows total employees and gender distribution for employees board of managers, key management personal, and employees. This Kantar Consulting Company Outline Gender Diversity At Kantar Slides PDF from Slidegeeks makes it easy to present information on your topic with precision. It provides customization options, so you can make changes to the colors, design, graphics, or any other component to create a unique layout. It is also available for immediate download, so you can begin using it right away. Slidegeeks has done good research to ensure that you have everything you need to make your presentation stand out. Make a name out there for a brilliant performance.

Dashboard Indicating Online Store Accounts Overview Introduction PDF
The following slide showcases ecommerce accounts management dashboard. It provides information about income, expenses, cash collected, cash spent, tax collected, tax claim, stock sold, invoice, etc. Presenting this PowerPoint presentation, titled Dashboard Indicating Online Store Accounts Overview Introduction PDF, with topics curated by our researchers after extensive research. This editable presentation is available for immediate download and provides attractive features when used. Download now and captivate your audience. Presenting this Dashboard Indicating Online Store Accounts Overview Introduction PDF. Our researchers have carefully researched and created these slides with all aspects taken into consideration. This is a completely customizable Dashboard Indicating Online Store Accounts Overview Introduction PDF that is available for immediate downloading. Download now and make an impact on your audience. Highlight the attractive features available with our PPTs.

Dashboard To Assess Ecommerce Financial Performance Across Regions Themes PDF
This slide showcases ecommerce key performance indicators KPI dashboard with financial statement. It provides information about total sales, orders, net profit, net profit margin, average order value, channels, etc. Here you can discover an assortment of the finest PowerPoint and Google Slides templates. With these templates, you can create presentations for a variety of purposes while simultaneously providing your audience with an eye catching visual experience. Download Dashboard To Assess Ecommerce Financial Performance Across Regions Themes PDF to deliver an impeccable presentation. These templates will make your job of preparing presentations much quicker, yet still, maintain a high level of quality. Slidegeeks has experienced researchers who prepare these templates and write high quality content for you. Later on, you can personalize the content by editing the Dashboard To Assess Ecommerce Financial Performance Across Regions Themes PDF.

Ecommerce KPI Dashboard With Pand L Statement Download PDF
This slide showcases ecommerce key performance indicators KPI dashboard with financial statement. It provides information about total sales, orders, net profit, net profit margin, average order value, channels, etc. This Ecommerce KPI Dashboard With Pand L Statement Download PDF from Slidegeeks makes it easy to present information on your topic with precision. It provides customization options, so you can make changes to the colors, design, graphics, or any other component to create a unique layout. It is also available for immediate download, so you can begin using it right away. Slidegeeks has done good research to ensure that you have everything you need to make your presentation stand out. Make a name out there for a brilliant performance.

Information Technology Company Monthly Sales Forecast Dashboard Ppt Portfolio Images PDF
This slide shows the dashboard representing the data related to monthly sales forecast of an Information Technology Company. It shows information related to the net sales by customer, variance between actual and forecasted sales, total net sales, net sales per customer and total net sales per time for actual and forecasted sales. Pitch your topic with ease and precision using this Information Technology Company Monthly Sales Forecast Dashboard Ppt Portfolio Images PDF. This layout presents information on Total Net Sales, Actual vs Forecast, Net Sales Customer. It is also available for immediate download and adjustment. So, changes can be made in the color, design, graphics or any other component to create a unique layout.

Brand Engagement Promotional Campaign Implementation Key Impact Of Promotional Event For Brand Awareness Diagrams PDF
This slide represents key impacts for promotional event. It covers site traffic, ROAS, customer lifetime value, engaged visit rate, page value etc. Find a pre designed and impeccable Brand Engagement Promotional Campaign Implementation Key Impact Of Promotional Event For Brand Awareness Diagrams PDF. The templates can ace your presentation without additional effort. You can download these easy to edit presentation templates to make your presentation stand out from others. So, what are you waiting for Download the template from Slidegeeks today and give a unique touch to your presentation.
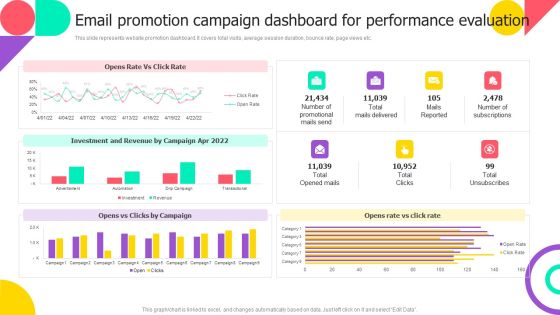
Email Promotion Campaign Dashboard For Performance Evaluation Pictures PDF
This slide represents website promotion dashboard. It covers total visits, average session duration, bounce rate, page views etc. Want to ace your presentation in front of a live audience Our Email Promotion Campaign Dashboard For Performance Evaluation Pictures PDF can help you do that by engaging all the users towards you. Slidegeeks experts have put their efforts and expertise into creating these impeccable powerpoint presentations so that you can communicate your ideas clearly. Moreover, all the templates are customizable, and easy to edit and downloadable. Use these for both personal and commercial use.
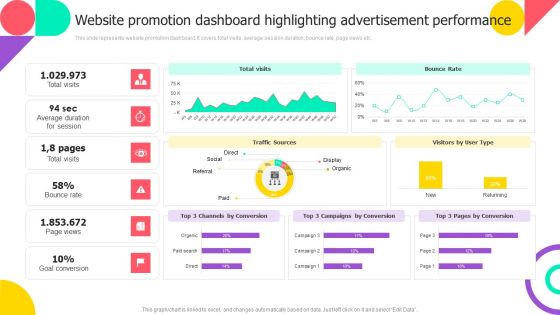
Website Promotion Dashboard Highlighting Advertisement Performance Portrait PDF
This slide represents website promotion dashboard. It covers total visits, average session duration, bounce rate, page views etc. There are so many reasons you need a Website Promotion Dashboard Highlighting Advertisement Performance Portrait PDF. The first reason is you can not spend time making everything from scratch, Thus, Slidegeeks has made presentation templates for you too. You can easily download these templates from our website easily.

Bar Chart Software Designing And Development Playbook Ideas PDF
Presenting this PowerPoint presentation, titled Bar Chart Software Designing And Development Playbook Ideas PDF, with topics curated by our researchers after extensive research. This editable presentation is available for immediate download and provides attractive features when used. Download now and captivate your audience. Presenting this Bar Chart Software Designing And Development Playbook Ideas PDF. Our researchers have carefully researched and created these slides with all aspects taken into consideration. This is a completely customizable Bar Chart Software Designing And Development Playbook Ideas PDF that is available for immediate downloading. Download now and make an impact on your audience. Highlight the attractive features available with our PPTs.
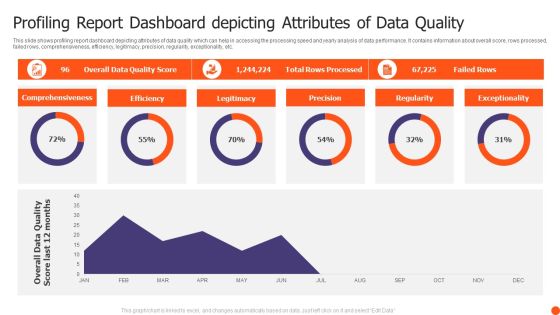
Profiling Report Dashboard Depicting Attributes Of Data Quality Themes PDF
This slide shows profiling report dashboard depicting attributes of data quality which can help in accessing the processing speed and yearly analysis of data performance. It contains information about overall score, rows processed, failed rows, comprehensiveness, efficiency, legitimacy, precision, regularity, exceptionality, etc. Pitch your topic with ease and precision using this Profiling Report Dashboard Depicting Attributes Of Data Quality Themes PDF. This layout presents information on Comprehensiveness, Efficiency, Legitimacy, Precision. It is also available for immediate download and adjustment. So, changes can be made in the color, design, graphics or any other component to create a unique layout.
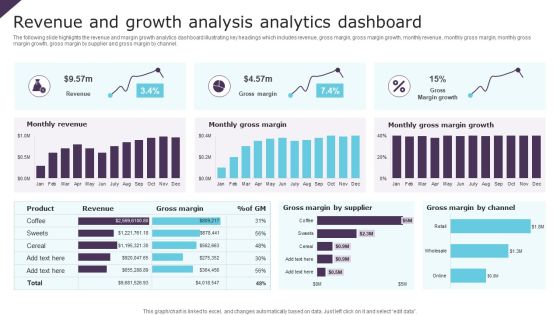
Revenue And Growth Analysis Analytics Dashboard Ppt Infographic Template Brochure PDF
The following slide highlights the revenue and margin growth analytics dashboard illustrating key headings which includes revenue, gross margin, gross margin growth, monthly revenue, monthly gross margin, monthly gross margin growth, gross margin by supplier and gross margin by channel. Pitch your topic with ease and precision using this Revenue And Growth Analysis Analytics Dashboard Ppt Infographic Template Brochure PDF. This layout presents information on Monthly Revenue, Monthly Gross Margin, Gross Margin Growth. It is also available for immediate download and adjustment. So, changes can be made in the color, design, graphics or any other component to create a unique layout.

Program Management Report With Activity And Tasks Dashboard Ppt File Objects PDF
This slide covers the programme status of the project with the activities and completion percentage of the same. It also shows the outstanding tasks and the monthly status with various graphs. Pitch your topic with ease and precision using this Program Management Report With Activity And Tasks Dashboard Ppt File Objects PDF. This layout presents information on Activity, Team Management, Time Tracking. It is also available for immediate download and adjustment. So, changes can be made in the color, design, graphics or any other component to create a unique layout.

Food Processing Technology Industry Report And Market Analysis Brochure PDF
The following slide highlights market analysis and industry report of food technology industry recording market CAGR, market share of united states, yearly growth rate, market value, market share of several companies and advanced technology driving market growth, global food analysis etc. Pitch your topic with ease and precision using this Food Processing Technology Industry Report And Market Analysis Brochure PDF. This layout presents information on Market CAGR, Market Share Accounted, Global Food, Market Analysis. It is also available for immediate download and adjustment. So, changes can be made in the color, design, graphics or any other component to create a unique layout.
Market Penetration Dashboard With Sales Metrics Ppt Icon Examples PDF
This slide shows market penetration dashboard for sales team. It provides information about regions, emerging markets, planned sales, actual sales, revenue, gender wise sales, etc. Pitch your topic with ease and precision using this Market Penetration Dashboard With Sales Metrics Ppt Icon Examples PDF. This layout presents information on Emerging Markets, Sales Gender, Actual Sales. It is also available for immediate download and adjustment. So, changes can be made in the color, design, graphics or any other component to create a unique layout.

Software Market Penetration KPI Dashboard Ppt Outline Aids PDF
This slide shows market penetration key performance indicator KPI dashboard for software sector. It provides information about growth rate, portfolio, platform, applications, services, on premises, cloud, etc. Pitch your topic with ease and precision using this Software Market Penetration KPI Dashboard Ppt Outline Aids PDF. This layout presents information on Market Size, Global Market, Cloud. It is also available for immediate download and adjustment. So, changes can be made in the color, design, graphics or any other component to create a unique layout.

Network Risks Management And Barriers Dashboard Ppt PowerPoint Presentation Gallery Graphic Tips PDF
This slide represents a dashboard of network risk management. It also includes problem servers , workstations and their status, unmonitored network devices. Pitch your topic with ease and precision using this Network Risks Management And Barriers Dashboard Ppt PowerPoint Presentation Gallery Graphic Tips PDF. This layout presents information on Problem Servers, Server Status, Problem Workstations, Workstation Status. It is also available for immediate download and adjustment. So, changes can be made in the color, design, graphics or any other component to create a unique layout.

Customer Shifting Patterns Towards Youtube Video Content Advertising Strategies For Youtube Portrait PDF
This slide highlights customer shifting patterns with user time spend on facebook, youtube, twitter and instagram and also showcases how customer preference changing from facebook to youtube.Get a simple yet stunning designed Customer Shifting Patterns Towards Youtube Video Content Advertising Strategies For Youtube Portrait PDF. It is the best one to establish the tone in your meetings. It is an excellent way to make your presentations highly effective. So, download this PPT today from Slidegeeks and see the positive impacts. Our easy-to-edit Customer Shifting Patterns Towards Youtube Video Content Advertising Strategies For Youtube Portrait PDF can be your go-to option for all upcoming conferences and meetings. So, what are you waiting for Grab this template today.

Attain Production Goals And Objectives Graph And Table Ppt Infographic Template Visuals PDF
This slide displays graphical representation of targeted and achieved production variance. It also includes critical insights such as target units, achieved production, achieved percentage, overachieved percentage, etc. Pitch your topic with ease and precision using this Attain Production Goals And Objectives Graph And Table Ppt Infographic Template Visuals PDF. This layout presents information on Target Vs Achieved, Key insight Table, Quarterly. It is also available for immediate download and adjustment. So, changes can be made in the color, design, graphics or any other component to create a unique layout.

Continuous Integration Dashboard For Automated Testing Framework Ppt Layouts Layout Ideas PDF
This slide shows continuous integration dashboard for test automation framework which can be referred by authors to review their testing performance. It contains information about weekly change volume by author, monthly change volume by author, repository, etc. Pitch your topic with ease and precision using this Continuous Integration Dashboard For Automated Testing Framework Ppt Layouts Layout Ideas PDF. This layout presents information on Total Changes Volume, Monthly Change Volume, Weekly Change Volume. It is also available for immediate download and adjustment. So, changes can be made in the color, design, graphics or any other component to create a unique layout.

Customer NPS Metric Dashboard For Call Centers Ppt Inspiration Smartart PDF
This slide shows net promoter score dashboard for call centers which contains occupancy rate, tickets unassigned, opened tickets, completed tickets and raised tickets. It also has details on resolution rate on first call, enquiries, etc. Pitch your topic with ease and precision using this Customer NPS Metric Dashboard For Call Centers Ppt Inspiration Smartart PDF. This layout presents information on Occupancy Rate, Resolution Rate, Net Promoter Score. It is also available for immediate download and adjustment. So, changes can be made in the color, design, graphics or any other component to create a unique layout.

Customer NPS Metric With Revenue Growth Impact Ppt Show Portrait PDF
This slide illustrates net promoter score with revenue growth impact. It provides information about market average NPS, respondents, promoter, detractor, passive, etc. Pitch your topic with ease and precision using this Customer NPS Metric With Revenue Growth Impact Ppt Show Portrait PDF. This layout presents information on Promoter, Detractor, Passive. It is also available for immediate download and adjustment. So, changes can be made in the color, design, graphics or any other component to create a unique layout.
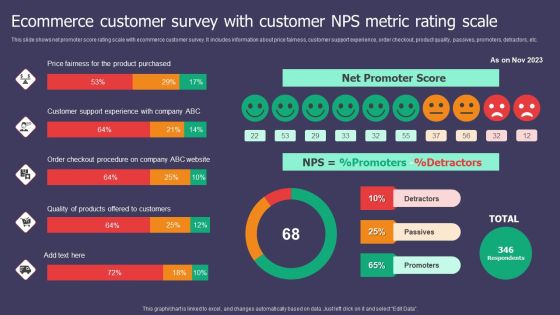
Ecommerce Customer Survey With Customer NPS Metric Rating Scale Ppt Inspiration Visual Aids PDF
This slide shows net promoter score rating scale with ecommerce customer survey. It includes information about price fairness, customer support experience, order checkout, product quality, passives, promoters, detractors, etc. Pitch your topic with ease and precision using this Ecommerce Customer Survey With Customer NPS Metric Rating Scale Ppt Inspiration Visual Aids PDF. This layout presents information on Net Promoter Score, Price Fairness, Product Purchased. It is also available for immediate download and adjustment. So, changes can be made in the color, design, graphics or any other component to create a unique layout.

Retail Sales Distribution Network Dashboard With Forecasting Ppt PowerPoint Presentation File Design Templates PDF
Pitch your topic with ease and precision using this Retail Sales Distribution Network Dashboard With Forecasting Ppt PowerPoint Presentation File Design Templates PDF. This layout presents information on Global Sales, Value Customer, Total Customers. It is also available for immediate download and adjustment. So, changes can be made in the color, design, graphics or any other component to create a unique layout.

Sales Performance Monitoring Dashboard With Customer Details Ppt Infographics Themes PDF
This slide illustrates sales performance tracking dashboard with critical information. It provides information about customer details, invoice, earnings, leads, pending delivery, revenue, etc. Pitch your topic with ease and precision using this Sales Performance Monitoring Dashboard With Customer Details Ppt Infographics Themes PDF. This layout presents information on Todays Revenue, Today Delivered, Pending Delivery, Total Leads. It is also available for immediate download and adjustment. So, changes can be made in the color, design, graphics or any other component to create a unique layout.
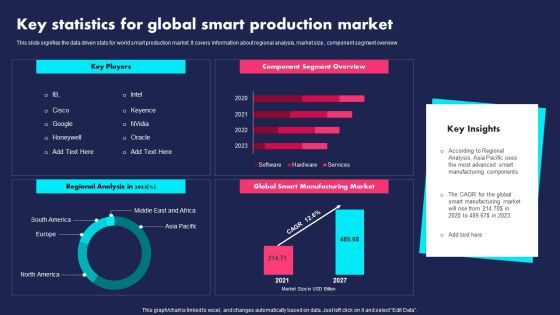
Key Statistics For Global Smart Production Market Ppt PowerPoint Presentation File Slides PDF
This slide signifies the data driven stats for world smart production market. It covers information about regional analysis, market size, component segment overview. Pitch your topic with ease and precision using this Key Statistics For Global Smart Production Market Ppt PowerPoint Presentation File Slides PDF. This layout presents information on Key Players, Component Segment Overview, Regional Analysis. It is also available for immediate download and adjustment. So, changes can be made in the color, design, graphics or any other component to create a unique layout.
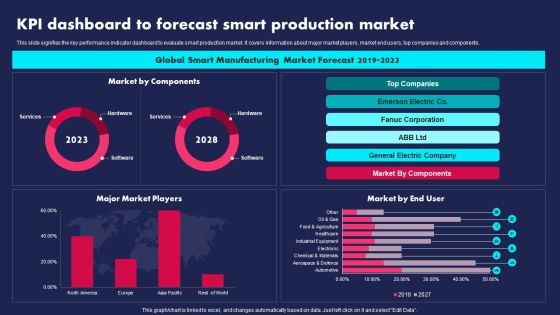
KPI Dashboard To Forecast Smart Production Market Ppt PowerPoint Presentation Gallery Visual Aids PDF
This slide signifies the key performance indicator dashboard to evaluate smart production market. It covers information about major market players, market end users, top companies and components. Pitch your topic with ease and precision using this KPI Dashboard To Forecast Smart Production Market Ppt PowerPoint Presentation Gallery Visual Aids PDF. This layout presents information on Global Smart Manufacturing, Market Forecast, 2019 To 2023. It is also available for immediate download and adjustment. So, changes can be made in the color, design, graphics or any other component to create a unique layout.

Software Development Project Weekly Status Update Summary Document Inspiration PDF
This slide represents a dashboard showing the weekly status of the software development projects of the IT department. It represents pie chart showing failed login rate, status of projects and aborted connects. Pitch your topic with ease and precision using this Software Development Project Weekly Status Update Summary Document Inspiration PDF. This layout presents information on High Failed, Login Rate, Abort Connects, Failed Login. It is also available for immediate download and adjustment. So, changes can be made in the color, design, graphics or any other component to create a unique layout.
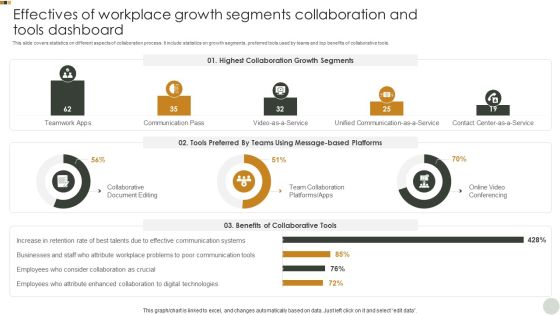
Effectives Of Workplace Growth Segments Collaboration And Tools Dashboard Graphics PDF
This slide covers statistics on different aspects of collaboration process. It include statistics on growth segments, preferred tools used by teams and top benefits of collaborative tools. Pitch your topic with ease and precision using this Effectives Of Workplace Growth Segments Collaboration And Tools Dashboard Graphics PDF. This layout presents information on Highest Collaboration, Growth Segments, Tools Preferred. It is also available for immediate download and adjustment. So, changes can be made in the color, design, graphics or any other component to create a unique layout.

Ad And Media Agency Company Profile Market Share Comparison Infographics PDF
This slide focuses on market share comparison with competitors which shows our leading company with greatest share in market due to increase in advertising projects in 2022. If your project calls for a presentation, then Slidegeeks is your go-to partner because we have professionally designed, easy-to-edit templates that are perfect for any presentation. After downloading, you can easily edit Ad And Media Agency Company Profile Market Share Comparison Infographics PDF and make the changes accordingly. You can rearrange slides or fill them with different images. Check out all the handy templates.

Ad And Media Agency Company Profile Ebitda Earning Before Interest Taxes Depreciation Structure PDF
This slide represents the earning before interest, taxes, depreciation and amortization of our advertising agency for last five years from 2018 to 2022. Presenting this PowerPoint presentation, titled Ad And Media Agency Company Profile Ebitda Earning Before Interest Taxes Depreciation Structure PDF, with topics curated by our researchers after extensive research. This editable presentation is available for immediate download and provides attractive features when used. Download now and captivate your audience. Presenting this Ad And Media Agency Company Profile Ebitda Earning Before Interest Taxes Depreciation Structure PDF. Our researchers have carefully researched and created these slides with all aspects taken into consideration. This is a completely customizable Ad And Media Agency Company Profile Ebitda Earning Before Interest Taxes Depreciation Structure PDF that is available for immediate downloading. Download now and make an impact on your audience. Highlight the attractive features available with our PPTs.

Ad And Media Agency Company Profile Revenue Split By Geography And Media Channels Clipart PDF
This slide represents the revenue split by geography and media channels such as video, newspapers, print and digital publications, out-of-home, etc This Ad And Media Agency Company Profile Revenue Split By Geography And Media Channels Clipart PDF from Slidegeeks makes it easy to present information on your topic with precision. It provides customization options, so you can make changes to the colors, design, graphics, or any other component to create a unique layout. It is also available for immediate download, so you can begin using it right away. Slidegeeks has done good research to ensure that you have everything you need to make your presentation stand out. Make a name out there for a brilliant performance.
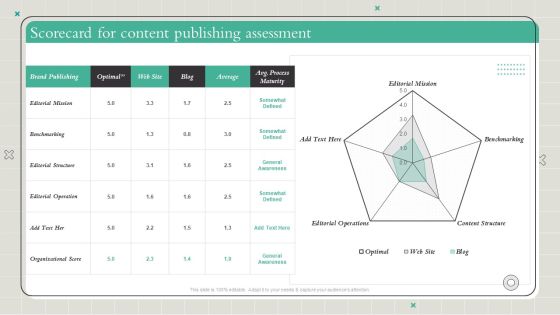
Playbook To Formulate Efficient Scorecard For Content Publishing Assessment Demonstration PDF
Coming up with a presentation necessitates that the majority of the effort goes into the content and the message you intend to convey. The visuals of a PowerPoint presentation can only be effective if it supplements and supports the story that is being told. Keeping this in mind our experts created Playbook To Formulate Efficient Scorecard For Content Publishing Assessment Demonstration PDF to reduce the time that goes into designing the presentation. This way, you can concentrate on the message while our designers take care of providing you with the right template for the situation.

Utilizing SEO To Boost Customer KPI Metrics Dashboard To Monitor Mobile Seo Performance Download PDF
The purpose of this slide is to outline key performance indicator KPI dashboard which will assist the marketer to analyze mobile search engine optimization SEO performance. The key metrics mentioned in the slide are total sessions, search engine rankings etc. Coming up with a presentation necessitates that the majority of the effort goes into the content and the message you intend to convey. The visuals of a PowerPoint presentation can only be effective if it supplements and supports the story that is being told. Keeping this in mind our experts created Utilizing SEO To Boost Customer KPI Metrics Dashboard To Monitor Mobile Seo Performance Download PDF to reduce the time that goes into designing the presentation. This way, you can concentrate on the message while our designers take care of providing you with the right template for the situation.
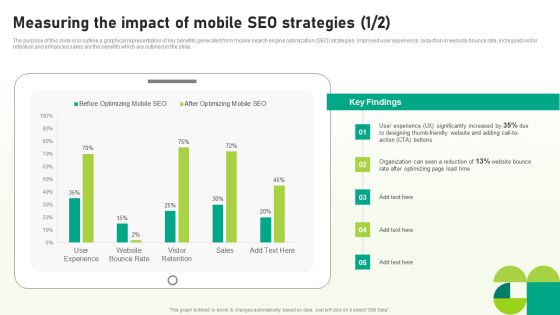
Utilizing SEO To Boost Customer Measuring The Impact Of Mobile SEO Strategies Diagrams PDF
The purpose of this slide is to outline a graphical representation of key benefits generated from mobile search engine optimization SEO strategies. Improved user experience, reduction in website bounce rate, increased visitor retention and enhanced sales are the benefits which are outlined in the slide. Explore a selection of the finest Utilizing SEO To Boost Customer Measuring The Impact Of Mobile SEO Strategies Diagrams PDF here. With a plethora of professionally designed and pre-made slide templates, you can quickly and easily find the right one for your upcoming presentation. You can use our Utilizing SEO To Boost Customer Measuring The Impact Of Mobile SEO Strategies Diagrams PDF to effectively convey your message to a wider audience. Slidegeeks has done a lot of research before preparing these presentation templates. The content can be personalized and the slides are highly editable. Grab templates today from Slidegeeks.

Utilizing SEO To Boost Customer Various Devices Which Connect Internet Users To Voice Search Template PDF
The purpose of this slide is to outline a comprehensive survey used to find out the most preferable device by users for voice search. Information covered in this slide is related to participants and devices such as smartphone, personal computer or laptop and tablet. Want to ace your presentation in front of a live audience Our Utilizing SEO To Boost Customer Various Devices Which Connect Internet Users To Voice Search Template PDF can help you do that by engaging all the users towards you. Slidegeeks experts have put their efforts and expertise into creating these impeccable powerpoint presentations so that you can communicate your ideas clearly. Moreover, all the templates are customizable, and easy-to-edit and downloadable. Use these for both personal and commercial use.

Key Factors Influencing Employee Motivation And Job Satisfaction Employee Performance Management Background PDF
This slide represents factors impacting employee motivation and job satisfaction. It includes training development, career growth opportunities, performance management, compensation etc.Explore a selection of the finest Key Factors Influencing Employee Motivation And Job Satisfaction Employee Performance Management Background PDF here. With a plethora of professionally designed and pre-made slide templates, you can quickly and easily find the right one for your upcoming presentation. You can use our Key Factors Influencing Employee Motivation And Job Satisfaction Employee Performance Management Background PDF to effectively convey your message to a wider audience. Slidegeeks has done a lot of research before preparing these presentation templates. The content can be personalized and the slides are highly editable. Grab templates today from Slidegeeks.
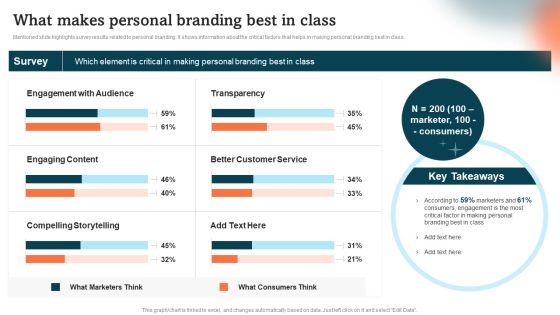
What Makes Personal Branding Best In Class Guide To Personal Branding Brochure PDF
Mentioned slide highlights survey results related to personal branding. It shows information about the critical factors that helps in making personal branding best in class.This What Makes Personal Branding Best In Class Guide To Personal Branding Brochure PDF from Slidegeeks makes it easy to present information on your topic with precision. It provides customization options, so you can make changes to the colors, design, graphics, or any other component to create a unique layout. It is also available for immediate download, so you can begin using it right away. Slidegeeks has done good research to ensure that you have everything you need to make your presentation stand out. Make a name out there for a brilliant performance.

Customer Digital Lifecycle Marketing And Planning Stages Customer Lifecycle Stages Guidelines PDF
To get started with customer lifecycle marketing, you first need to be aware of the lifecycle stages of the customer. At each stage, your strategy varies depending on the needs of the customer and their engagement. Formulating a presentation can take up a lot of effort and time, so the content and message should always be the primary focus. The visuals of the PowerPoint can enhance the presenters message, so our Customer Digital Lifecycle Marketing And Planning Stages Customer Lifecycle Stages Guidelines PDF was created to help save time. Instead of worrying about the design, the presenter can concentrate on the message while our designers work on creating the ideal templates for whatever situation is needed. Slidegeeks has experts for everything from amazing designs to valuable content, we have put everything into Customer Digital Lifecycle Marketing And Planning Stages Customer Lifecycle Stages Guidelines PDF.

Customer Digital Lifecycle Marketing And Planning Stages Demographic Segmentation Guidelines PDF
Use these data-driven charts and diagrams to describe your target customer in detail for better insights. Coming up with a presentation necessitates that the majority of the effort goes into the content and the message you intend to convey. The visuals of a PowerPoint presentation can only be effective if it supplements and supports the story that is being told. Keeping this in mind our experts created Customer Digital Lifecycle Marketing And Planning Stages Demographic Segmentation Guidelines PDF to reduce the time that goes into designing the presentation. This way, you can concentrate on the message while our designers take care of providing you with the right template for the situation.
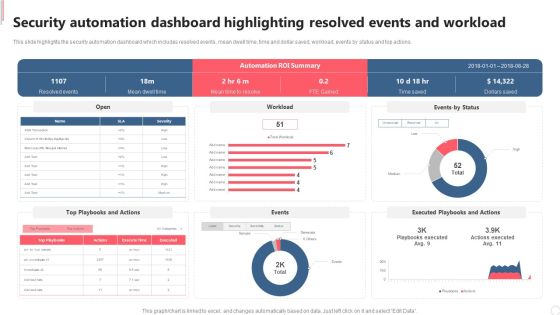
Security Automation Dashboard Highlighting Resolved Events And Workload Diagrams PDF
This slide highlights the security automation dashboard which includes resolved events, mean dwell time, time and dollar saved, workload, events by status and top actions. Explore a selection of the finest Security Automation Dashboard Highlighting Resolved Events And Workload Diagrams PDF here. With a plethora of professionally designed and pre made slide templates, you can quickly and easily find the right one for your upcoming presentation. You can use our Security Automation Dashboard Highlighting Resolved Events And Workload Diagrams PDF to effectively convey your message to a wider audience. Slidegeeks has done a lot of research before preparing these presentation templates. The content can be personalized and the slides are highly editable. Grab templates today from Slidegeeks.

Retail Analytics Dashboard To Measure Merchandise Planning Effectiveness Designs PDF
Do you have to make sure that everyone on your team knows about any specific topic I yes, then you should give Retail Analytics Dashboard To Measure Merchandise Planning Effectiveness Designs PDF a try. Our experts have put a lot of knowledge and effort into creating this impeccable Retail Analytics Dashboard To Measure Merchandise Planning Effectiveness Designs PDF. You can use this template for your upcoming presentations, as the slides are perfect to represent even the tiniest detail. You can download these templates from the Slidegeeks website and these are easy to edit. So grab these today.
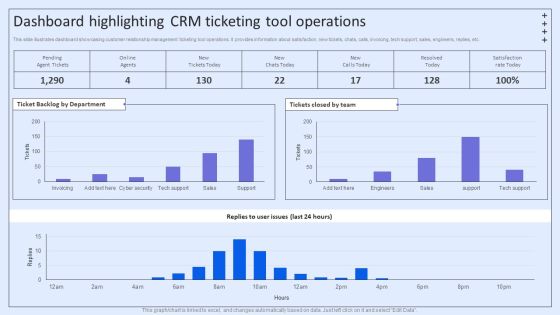
Integrating ITSM To Enhance Service Dashboard Highlighting CRM Ticketing Tool Operations Designs PDF
This slide illustrates dashboard showcasing customer relationship management ticketing tool operations. It provides information about satisfaction, new tickets, chats, calls, invoicing, tech support, sales, engineers, replies, etc. There are so many reasons you need a Integrating ITSM To Enhance Service Dashboard Highlighting CRM Ticketing Tool Operations Designs PDF. The first reason is you cant spend time making everything from scratch, Thus, Slidegeeks has made presentation templates for you too. You can easily download these templates from our website easily.
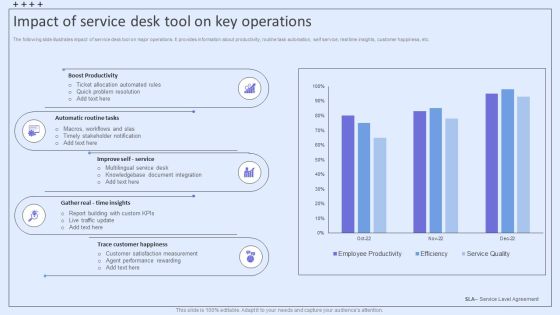
Integrating ITSM To Enhance Service Impact Of Service Desk Tool On Key Operations Ideas PDF
The following slide illustrates impact of service desk tool on major operations. It provides information about productivity, routine task automation, self service, real time insights, customer happiness, etc. Do you have an important presentation coming up Are you looking for something that will make your presentation stand out from the rest Look no further than Integrating ITSM To Enhance Service Impact Of Service Desk Tool On Key Operations Ideas PDF. With our professional designs, you can trust that your presentation will pop and make delivering it a smooth process. And with Slidegeeks, you can trust that your presentation will be unique and memorable. So why wait Grab Integrating ITSM To Enhance Service Impact Of Service Desk Tool On Key Operations Ideas PDF today and make your presentation stand out from the rest.

Integrating ITSM To Enhance Service Itsm Ticketing Tool Dashboard With Activity Status Microsoft PDF
This slide depicts information technology service management ITSM ticketing tool dashboard with activity status. It provides information about open tickets, closed tickets, requests, desktop support, alert level, completed tickets, etc. Crafting an eye-catching presentation has never been more straightforward. Let your presentation shine with this tasteful yet straightforward Integrating ITSM To Enhance Service Itsm Ticketing Tool Dashboard With Activity Status Microsoft PDF template. It offers a minimalistic and classy look that is great for making a statement. The colors have been employed intelligently to add a bit of playfulness while still remaining professional. Construct the ideal Integrating ITSM To Enhance Service Itsm Ticketing Tool Dashboard With Activity Status Microsoft PDF that effortlessly grabs the attention of your audience Begin now and be certain to wow your customers.

Brand Equity Performance Assessment Dashboard Brand Administration Template PDF
This slide provides information regarding brand equity performance assessment dashboard that highlights customer lifecycle value, customer adoption rate, mentions, engagement, etc. This modern and well-arranged Brand Equity Performance Assessment Dashboard Brand Administration Template PDF provides lots of creative possibilities. It is very simple to customize and edit with the Powerpoint Software. Just drag and drop your pictures into the shapes. All facets of this template can be edited with Powerpoint no extra software is necessary. Add your own material, put your images in the places assigned for them, adjust the colors, and then you can show your slides to the world, with an animated slide included.
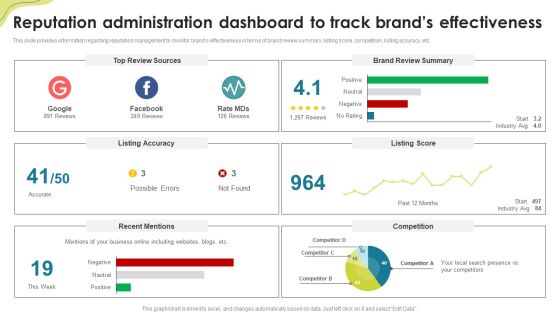
Reputation Administration Dashboard To Track Brands Effectiveness Brand Administration Elements PDF
This slide provides information regarding reputation management to monitor brands effectiveness in terms of brand review summary, listing score, competition, listing accuracy, etc. There are so many reasons you need a Reputation Administration Dashboard To Track Brands Effectiveness Brand Administration Elements PDF. The first reason is you can not spend time making everything from scratch, Thus, Slidegeeks has made presentation templates for you too. You can easily download these templates from our website easily.

Analyzing Major Performance Indicators Post Extension Strategies Topics PDF
This slide showcases analyzing major performance indicators which can help branding managers to assess extension strategy KPIs. It provides details about market share, product line, launch, variants, color, size, net promotor score NPS, etc. From laying roadmaps to briefing everything in detail, our templates are perfect for you. You can set the stage with your presentation slides. All you have to do is download these easy-to-edit and customizable templates. Analyzing Major Performance Indicators Post Extension Strategies Topics PDF will help you deliver an outstanding performance that everyone would remember and praise you for. Do download this presentation today.

Clustered Column Dual Branding Campaign For Product Promotion And Recognition Inspiration PDF
Get a simple yet stunning designed Clustered Column Dual Branding Campaign For Product Promotion And Recognition Inspiration PDF. It is the best one to establish the tone in your meetings. It is an excellent way to make your presentations highly effective. So, download this PPT today from Slidegeeks and see the positive impacts. Our easy-to-edit Clustered Column Dual Branding Campaign For Product Promotion And Recognition Inspiration PDF can be your go-to option for all upcoming conferences and meetings. So, what are you waiting for Grab this template today.
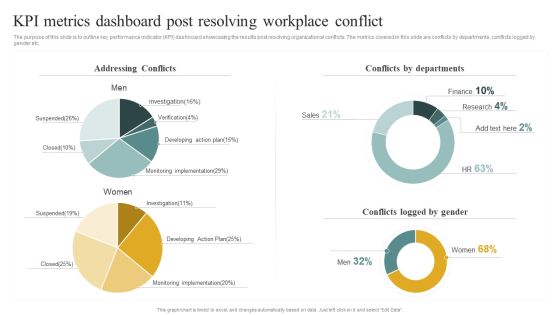
Kpi Metrics Dashboard Post Resolving Workplace Conflict Managing Organizational Conflicts To Boost Pictures PDF
The purpose of this slide is to outline key performance indicator KPI dashboard showcasing the results post resolving organizational conflicts. The metrics covered in this slide are conflicts by departments, conflicts logged by gender etc. Are you in need of a template that can accommodate all of your creative concepts This one is crafted professionally and can be altered to fit any style. Use it with Google Slides or PowerPoint. Include striking photographs, symbols, depictions, and other visuals. Fill, move around, or remove text boxes as desired. Test out color palettes and font mixtures. Edit and save your work, or work with colleagues. Download Kpi Metrics Dashboard Post Resolving Workplace Conflict Managing Organizational Conflicts To Boost Pictures PDF and observe how to make your presentation outstanding. Give an impeccable presentation to your group and make your presentation unforgettable.
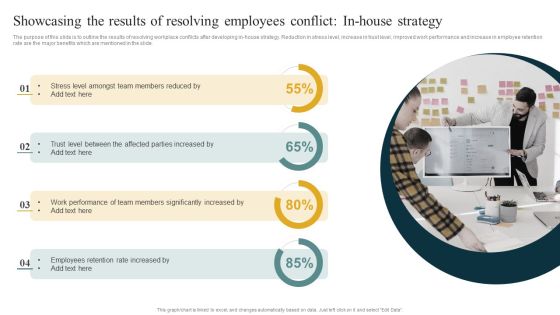
Showcasing The Results Of Resolving Employees Conflict Inhouse Strategy Professional PDF
The purpose of this slide is to outline the results of resolving workplace conflicts after developing in-house strategy. Reduction in stress level, increase in trust level, improved work performance and increase in employee retention rate are the major benefits which are mentioned in the slide. Do you have an important presentation coming up Are you looking for something that will make your presentation stand out from the rest Look no further than Showcasing The Results Of Resolving Employees Conflict Inhouse Strategy Professional PDF. With our professional designs, you can trust that your presentation will pop and make delivering it a smooth process. And with Slidegeeks, you can trust that your presentation will be unique and memorable. So why wait Grab Showcasing The Results Of Resolving Employees Conflict Inhouse Strategy Professional PDF today and make your presentation stand out from the rest.
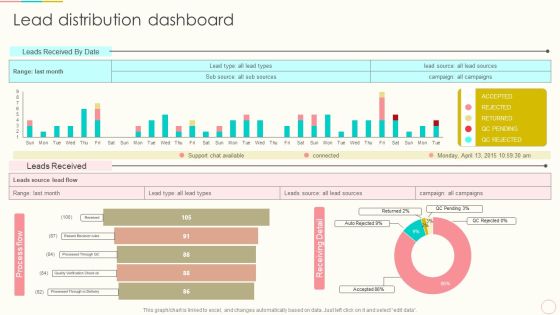
Lead Management To Engage Potential Customers Lead Distribution Dashboard Template PDF
Presenting this PowerPoint presentation, titled Lead Management To Engage Potential Customers Lead Distribution Dashboard Template PDF with topics curated by our researchers after extensive research. This editable presentation is available for immediate download and provides attractive features when used. Download now and captivate your audience. Presenting this Lead Management To Engage Potential Customers Lead Distribution Dashboard Template PDF. Our researchers have carefully researched and created these slides with all aspects taken into consideration. This is a completely customizable Lead Management To Engage Potential Customers Lead Distribution Dashboard Template PDF that is available for immediate downloading. Download now and make an impact on your audience. Highlight the attractive features available with our PPTs.

Lead Management To Engage Potential Customers Less Contribution Of Converted Leads Template PDF
This slide shows the contribution of converted leads and non converted leads from past few months. Here you can discover an assortment of the finest PowerPoint and Google Slides templates. With these templates, you can create presentations for a variety of purposes while simultaneously providing your audience with an eye catching visual experience. Download Lead Management To Engage Potential Customers Less Contribution Of Converted Leads Template PDF to deliver an impeccable presentation. These templates will make your job of preparing presentations much quicker, yet still, maintain a high level of quality. Slidegeeks has experienced researchers who prepare these templates and write high quality content for you. Later on, you can personalize the content by editing the Lead Management To Engage Potential Customers Less Contribution Of Converted Leads Template PDF.
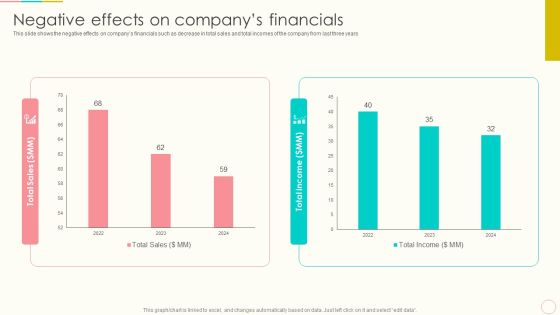
Lead Management To Engage Potential Customers Negative Effects On Companys Financials Professional PDF
This slide shows the negative effects on companys financials such as decrease in total sales and total incomes of the company from last three years. This Lead Management To Engage Potential Customers Negative Effects On Companys Financials Professional PDF from Slidegeeks makes it easy to present information on your topic with precision. It provides customization options, so you can make changes to the colors, design, graphics, or any other component to create a unique layout. It is also available for immediate download, so you can begin using it right away. Slidegeeks has done good research to ensure that you have everything you need to make your presentation stand out. Make a name out there for a brilliant performance.
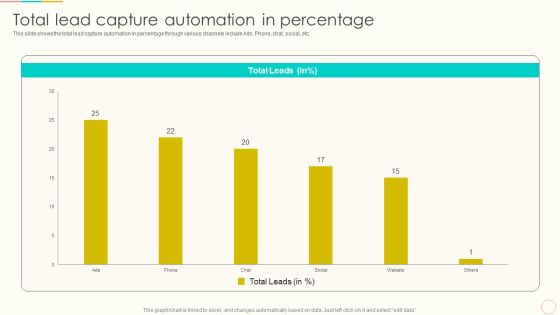
Lead Management To Engage Potential Customers Total Lead Capture Automation In Percentage Rules PDF
This slide shows the total lead capture automation in percentage through various channels include Ads. Phone, chat, social, etc. This Lead Management To Engage Potential Customers Total Lead Capture Automation In Percentage Rules PDF from Slidegeeks makes it easy to present information on your topic with precision. It provides customization options, so you can make changes to the colors, design, graphics, or any other component to create a unique layout. It is also available for immediate download, so you can begin using it right away. Slidegeeks has done good research to ensure that you have everything you need to make your presentation stand out. Make a name out there for a brilliant performance.
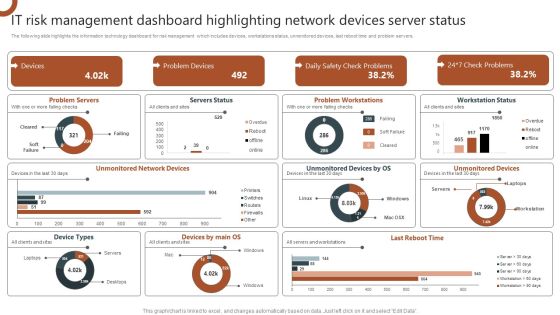
IT Risk Management Dashboard Highlighting Network Devices Server Status Pictures PDF
The following slide highlights the information technology dashboard for risk management which includes devices, workstations status, unmonitored devices, last reboot time and problem servers. Are you in need of a template that can accommodate all of your creative concepts This one is crafted professionally and can be altered to fit any style. Use it with Google Slides or PowerPoint. Include striking photographs, symbols, depictions, and other visuals. Fill, move around, or remove text boxes as desired. Test out color palettes and font mixtures. Edit and save your work, or work with colleagues. Download IT Risk Management Dashboard Highlighting Network Devices Server Status Pictures PDF and observe how to make your presentation outstanding. Give an impeccable presentation to your group and make your presentation unforgettable.

Facilities Management Dashboard With Repair Services And Work Orders Structure PDF
This slide highlights dashboard for facilities management services which includes tasks by work order type, task by status, lobs logged, repair services and priority work orders. Crafting an eye catching presentation has never been more straightforward. Let your presentation shine with this tasteful yet straightforward Facilities Management Dashboard With Repair Services And Work Orders Structure PDF template. It offers a minimalistic and classy look that is great for making a statement. The colors have been employed intelligently to add a bit of playfulness while still remaining professional. Construct the ideal Facilities Management Dashboard With Repair Services And Work Orders Structure PDF that effortlessly grabs the attention of your audience Begin now and be certain to wow your customers.

Call Center Action Plan Dashboard Highlighting Average Answer Time With Total Resolutions Template PDF
This slide showcases call center action plan dashboard which highlights first call resolution, unresolved calls, customers call report, response time by weekday and average answer time. Are you in need of a template that can accommodate all of your creative concepts This one is crafted professionally and can be altered to fit any style. Use it with Google Slides or PowerPoint. Include striking photographs, symbols, depictions, and other visuals. Fill, move around, or remove text boxes as desired. Test out color palettes and font mixtures. Edit and save your work, or work with colleagues. Download Call Center Action Plan Dashboard Highlighting Average Answer Time With Total Resolutions Template PDF and observe how to make your presentation outstanding. Give an impeccable presentation to your group and make your presentation unforgettable.

Strategic Plan For Call Center Employees Impact Of Poor Customer Support At Call Center Information PDF
This slide highlights the impacts on the company of poor customer support at BPO call center which showcases comparison of call center companies performance with Quarterly revenue. Coming up with a presentation necessitates that the majority of the effort goes into the content and the message you intend to convey. The visuals of a PowerPoint presentation can only be effective if it supplements and supports the story that is being told. Keeping this in mind our experts created Strategic Plan For Call Center Employees Impact Of Poor Customer Support At Call Center Information PDF to reduce the time that goes into designing the presentation. This way, you can concentrate on the message while our designers take care of providing you with the right template for the situation.

Dashboard Showing Emarketing Performance Digital Marketing Strategy Deployment Demonstration PDF
This slide focuses on the dashboard that shows the e-marketing performance such ad lead funnel, traffic sources, monthly leads and key metrics.Want to ace your presentation in front of a live audience Our Dashboard Showing Emarketing Performance Digital Marketing Strategy Deployment Demonstration PDF can help you do that by engaging all the users towards you.. Slidegeeks experts have put their efforts and expertise into creating these impeccable powerpoint presentations so that you can communicate your ideas clearly. Moreover, all the templates are customizable, and easy-to-edit and downloadable. Use these for both personal and commercial use.

Effectiveness Of Online Media Channels Digital Marketing Strategy Deployment Graphics PDF
This slide focuses on the effectiveness of online media channels which covers email marketing, social PPC, content marketing, direct mail, etc.Get a simple yet stunning designed Effectiveness Of Online Media Channels Digital Marketing Strategy Deployment Graphics PDF. It is the best one to establish the tone in your meetings. It is an excellent way to make your presentations highly effective. So, download this PPT today from Slidegeeks and see the positive impacts. Our easy-to-edit Effectiveness Of Online Media Channels Digital Marketing Strategy Deployment Graphics PDF can be your go-to option for all upcoming conferences and meetings. So, what are you waiting for Grab this template today.

Impact Of Covid19 On Performance Of Different Industries Digital Marketing Strategy Deployment Template PDF
This slide shows the graph that represents the impact of covid-19 on different industries which shows the level of impact on branding, content strategy and marketing performance.Find highly impressive Impact Of Covid19 On Performance Of Different Industries Digital Marketing Strategy Deployment Template PDF on Slidegeeks to deliver a meaningful presentation. You can save an ample amount of time using these presentation templates. No need to worry to prepare everything from scratch because Slidegeeks experts have already done a huge research and work for you. You need to download Impact Of Covid19 On Performance Of Different Industries Digital Marketing Strategy Deployment Template PDF for your upcoming presentation. All the presentation templates are 100 precent editable and you can change the color and personalize the content accordingly. Download now.

Certified Information Systems Security Professional CISSP Examination Details IT Certifications To Enhance Pictures PDF
This slide covers information about CISSP Examination such as weight of each domain in exams, prep courses details, qualification details etc.Find highly impressive Certified Information Systems Security Professional CISSP Examination Details IT Certifications To Enhance Pictures PDF on Slidegeeks to deliver a meaningful presentation. You can save an ample amount of time using these presentation templates. No need to worry to prepare everything from scratch because Slidegeeks experts have already done a huge research and work for you. You need to download Certified Information Systems Security Professional CISSP Examination Details IT Certifications To Enhance Pictures PDF for your upcoming presentation. All the presentation templates are 100 precent editable and you can change the color and personalize the content accordingly. Download now.

Cisco Certified Internetwork Expert CCIE Salary And Job Details IT Certifications To Enhance Download PDF
This slide covers salary details CCIE certified salary and job details along with certification courses, exam status and scope of certification etc.Formulating a presentation can take up a lot of effort and time, so the content and message should always be the primary focus. The visuals of the PowerPoint can enhance the presenters message, so our Cisco Certified Internetwork Expert CCIE Salary And Job Details IT Certifications To Enhance Download PDF was created to help save time. Instead of worrying about the design, the presenter can concentrate on the message while our designers work on creating the ideal templates for whatever situation is needed. Slidegeeks has experts for everything from amazing designs to valuable content, we have put everything into Cisco Certified Internetwork Expert CCIE Salary And Job Details IT Certifications To Enhance Download PDF.

Certified Information Systems Security Professional CISSP Salary And JOB Details IT Certifications To Enhance Introduction PDF
This slide covers CISSP certification information about salary and job responsibilities and CISSP certification salary ranges by job etc. Present like a pro with Certified Information Systems Security Professional CISSP Salary And JOB Details IT Certifications To Enhance Introduction PDF Create beautiful presentations together with your team, using our easy-to-use presentation slides. Share your ideas in real-time and make changes on the fly by downloading our templates. So whether you are in the office, on the go, or in a remote location, you can stay in sync with your team and present your ideas with confidence. With Slidegeeks presentation got a whole lot easier. Grab these presentations today.

Emotional Marketing Strategy To Nurture Brand Revenue Highlights Product Line Region Template PDF
The following slide includes statistics illustrating revenue highlights of brand by product line and geographies. It provides information about North America, Asia Pacific and Latin America ALPA, Greater China, EMEA Europe, Middle East and Africa, footwear, apparel, etc. Want to ace your presentation in front of a live audience Our Emotional Marketing Strategy To Nurture Brand Revenue Highlights Product Line Region Template PDF can help you do that by engaging all the users towards you. Slidegeeks experts have put their efforts and expertise into creating these impeccable powerpoint presentations so that you can communicate your ideas clearly. Moreover, all the templates are customizable, and easy-to-edit and downloadable. Use these for both personal and commercial use.

Emotional Marketing Strategy To Nurture Forecasting Market Share Amongst Major Brands Microsoft PDF
This slide showcases projecting market share amongst major players. It provides details about compound annual growth rate CAGR, market cap, customer emotions, brand image, storytelling, product differentiation, sales volume, etc. Explore a selection of the finest Emotional Marketing Strategy To Nurture Forecasting Market Share Amongst Major Brands Microsoft PDF here. With a plethora of professionally designed and pre-made slide templates, you can quickly and easily find the right one for your upcoming presentation. You can use our Emotional Marketing Strategy To Nurture Forecasting Market Share Amongst Major Brands Microsoft PDF to effectively convey your message to a wider audience. Slidegeeks has done a lot of research before preparing these presentation templates. The content can be personalized and the slides are highly editable. Grab templates today from Slidegeeks.
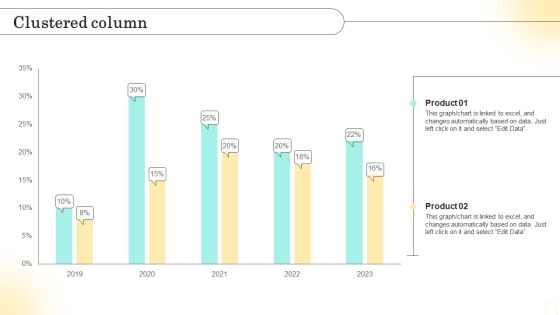
Emotional Marketing Strategy To Nurture Clustered Column Ppt Infographics Slide PDF
Present like a pro with Emotional Marketing Strategy To Nurture Clustered Column Ppt Infographics Slide PDF Create beautiful presentations together with your team, using our easy-to-use presentation slides. Share your ideas in real-time and make changes on the fly by downloading our templates. So whether youre in the office, on the go, or in a remote location, you can stay in sync with your team and present your ideas with confidence. With Slidegeeks presentation got a whole lot easier. Grab these presentations today.

Brand Health Definition And Metrics To Track Brand Value Estimation Guide Mockup PDF
Following slide provides an overview about brand equity by covering its definition and key components such as brand loyalty, awareness, quality, association and experience.Present like a pro with Brand Health Definition And Metrics To Track Brand Value Estimation Guide Mockup PDF Create beautiful presentations together with your team, using our easy-to-use presentation slides. Share your ideas in real-time and make changes on the fly by downloading our templates. So whether you are in the office, on the go, or in a remote location, you can stay in sync with your team and present your ideas with confidence. With Slidegeeks presentation got a whole lot easier. Grab these presentations today.

Financial Kpi Dashboard To Measure Brand Performance Brand Value Estimation Guide Inspiration PDF
Mentioned slide showcases KPI dashboard that can be used to check the financial performance of a brand. Metrics covered in the dashboard are return on assets, working capital ratio, return on equity etc.Are you in need of a template that can accommodate all of your creative concepts This one is crafted professionally and can be altered to fit any style. Use it with Google Slides or PowerPoint. Include striking photographs, symbols, depictions, and other visuals. Fill, move around, or remove text boxes as desired. Test out color palettes and font mixtures. Edit and save your work, or work with colleagues. Download Financial Kpi Dashboard To Measure Brand Performance Brand Value Estimation Guide Inspiration PDF and observe how to make your presentation outstanding. Give an impeccable presentation to your group and make your presentation unforgettable.

Test Conclusion Emotional Index Value Brand Value Estimation Guide Structure PDF
Mentioned slide displays the results of brand asset test. It shows that logo having black background is having the highest emotional index value score.Do you have an important presentation coming up Are you looking for something that will make your presentation stand out from the rest Look no further than Test Conclusion Emotional Index Value Brand Value Estimation Guide Structure PDF. With our professional designs, you can trust that your presentation will pop and make delivering it a smooth process. And with Slidegeeks, you can trust that your presentation will be unique and memorable. So why wait Grab Test Conclusion Emotional Index Value Brand Value Estimation Guide Structure PDF today and make your presentation stand out from the rest.

Global Food Industry Revenue Generation Year Over Year Growth Launching New Beverage Product Themes PDF
The following slide outlines the total market revenue and growth of food beverage industry. The revenue of the food industry is covered from 2015-2022. Slidegeeks has constructed Global Food Industry Revenue Generation Year Over Year Growth Launching New Beverage Product Themes PDF after conducting extensive research and examination. These presentation templates are constantly being generated and modified based on user preferences and critiques from editors. Here, you will find the most attractive templates for a range of purposes while taking into account ratings and remarks from users regarding the content. This is an excellent jumping-off point to explore our content and will give new users an insight into our top-notch PowerPoint Templates.

Measuring Revenue From New Product Launch Launching New Beverage Product Slides PDF
The following slide outlines a graphical representation of revenue from new product launch. The revenue is covered from Q1-Q4 2022. Want to ace your presentation in front of a live audience Our Measuring Revenue From New Product Launch Launching New Beverage Product Slides PDF can help you do that by engaging all the users towards you.. Slidegeeks experts have put their efforts and expertise into creating these impeccable powerpoint presentations so that you can communicate your ideas clearly. Moreover, all the templates are customizable, and easy-to-edit and downloadable. Use these for both personal and commercial use.
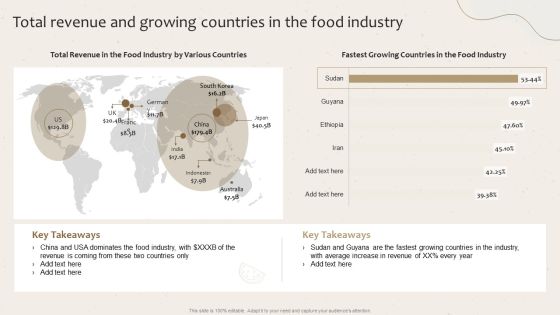
Total Revenue And Growing Countries In The Food Industry Launching New Beverage Product Information PDF
Formulating a presentation can take up a lot of effort and time, so the content and message should always be the primary focus. The visuals of the PowerPoint can enhance the presenters message, so our Total Revenue And Growing Countries In The Food Industry Launching New Beverage Product Information PDF was created to help save time. Instead of worrying about the design, the presenter can concentrate on the message while our designers work on creating the ideal templates for whatever situation is needed. Slidegeeks has experts for everything from amazing designs to valuable content, we have put everything into Total Revenue And Growing Countries In The Food Industry Launching New Beverage Product Information PDF.

Total Revenue From Food And Beverage Stores In The Usa Launching New Beverage Product Mockup PDF
The following slide outlines the industry sales generated from various type of food and beverage stores in the USA. It covers information about the grocery, liquor and specialty food stores. Coming up with a presentation necessitates that the majority of the effort goes into the content and the message you intend to convey. The visuals of a PowerPoint presentation can only be effective if it supplements and supports the story that is being told. Keeping this in mind our experts created Total Revenue From Food And Beverage Stores In The Usa Launching New Beverage Product Mockup PDF to reduce the time that goes into designing the presentation. This way, you can concentrate on the message while our designers take care of providing you with the right template for the situation.

Competitive Landscape Analysis Based On Market Share Strategic Promotion Plan To Improve Infographics PDF
Mentioned pie chart illustrates companys global and domestic market share. Company A has a larger market share in both the global and domestic markets.Do you have an important presentation coming up Are you looking for something that will make your presentation stand out from the rest Look no further than Competitive Landscape Analysis Based On Market Share Strategic Promotion Plan To Improve Infographics PDF. With our professional designs, you can trust that your presentation will pop and make delivering it a smooth process. And with Slidegeeks, you can trust that your presentation will be unique and memorable. So why wait Grab Competitive Landscape Analysis Based On Market Share Strategic Promotion Plan To Improve Infographics PDF today and make your presentation stand out from the rest.

Determining The Likelihood Of Loosing Sales Deals Strategic Promotion Plan To Improve Product Brand Image Pictures PDF
Purpose of this slide is to address the impact of improved marketing efforts on the likelihood of loosing sales deals. It also demonstrates a 26 precent increase in lead conversion rate.Crafting an eye-catching presentation has never been more straightforward. Let your presentation shine with this tasteful yet straightforward Determining The Likelihood Of Loosing Sales Deals Strategic Promotion Plan To Improve Product Brand Image Pictures PDF template. It offers a minimalistic and classy look that is great for making a statement. The colors have been employed intelligently to add a bit of playfulness while still remaining professional. Construct the ideal Determining The Likelihood Of Loosing Sales Deals Strategic Promotion Plan To Improve Product Brand Image Pictures PDF that effortlessly grabs the attention of your audience Begin now and be certain to wow your customers.

Kpi Dashboard To Monitor Sales Opportunities Strategic Promotion Plan To Improve Product Diagrams PDF
Mentioned slide shows the KPI dashboard that can be used to track win and lost sales opportunities. It includes metrics namely won opportunities, lost opportunities, pipeline by territory, total opportunities.Explore a selection of the finest Kpi Dashboard To Monitor Sales Opportunities Strategic Promotion Plan To Improve Product Diagrams PDF here. With a plethora of professionally designed and pre-made slide templates, you can quickly and easily find the right one for your upcoming presentation. You can use our Kpi Dashboard To Monitor Sales Opportunities Strategic Promotion Plan To Improve Product Diagrams PDF to effectively convey your message to a wider audience. Slidegeeks has done a lot of research before preparing these presentation templates. The content can be personalized and the slides are highly editable. Grab templates today from Slidegeeks.
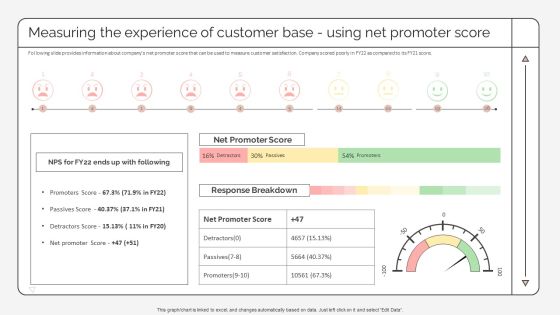
Measuring The Experience Of Customer Base Using Net Promoter Score Strategic Promotion Plan Information PDF
Following slide provides information about companys net promoter score that can be used to measure customer satisfaction. Company scored poorly in FY22 as compared to its FY21 score. Slidegeeks has constructed Measuring The Experience Of Customer Base Using Net Promoter Score Strategic Promotion Plan Information PDF after conducting extensive research and examination. These presentation templates are constantly being generated and modified based on user preferences and critiques from editors. Here, you will find the most attractive templates for a range of purposes while taking into account ratings and remarks from users regarding the content. This is an excellent jumping-off point to explore our content and will give new users an insight into our top-notch PowerPoint Templates.

Biyearly Gantt Chart For Multiple Task Project Structure PDF
Pitch your topic with ease and precision using this Biyearly Gantt Chart For Multiple Task Project Structure PDF. This layout presents information on Biyearly Gantt Chart, Multiple Task Project. It is also available for immediate download and adjustment. So, changes can be made in the color, design, graphics or any other component to create a unique layout.

Biyearly Gantt Chart For Project Management Elements PDF
Pitch your topic with ease and precision using this Biyearly Gantt Chart For Project Management Elements PDF. This layout presents information on Designing, Planning, Implementation. It is also available for immediate download and adjustment. So, changes can be made in the color, design, graphics or any other component to create a unique layout.

Project Monthly Gantt Bar Chart With Completion Status Infographics PDF
Pitch your topic with ease and precision using this Project Monthly Gantt Bar Chart With Completion Status Infographics PDF. This layout presents information on Project, Monthly Gantt Bar Chart. It is also available for immediate download and adjustment. So, changes can be made in the color, design, graphics or any other component to create a unique layout.
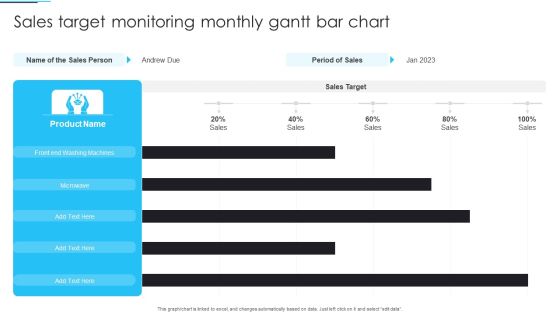
Sales Target Monitoring Monthly Gantt Bar Chart Ideas PDF
Pitch your topic with ease and precision using this Sales Target Monitoring Monthly Gantt Bar Chart Ideas PDF. This layout presents information on Sales Target Monitoring, Monthly Gantt Bar Chart. It is also available for immediate download and adjustment. So, changes can be made in the color, design, graphics or any other component to create a unique layout.

Plastic Waste Recycling Statistics Based On Compound Annual Growth Rate Inspiration PDF
This slide covers statistics based on top countries contribution in plastic recycling and waste management. It includes report from period 2019-2025 with insights based on CAGR. Pitch your topic with ease and precision using this Plastic Waste Recycling Statistics Based On Compound Annual Growth Rate Inspiration PDF. This layout presents information on Contributes Maximum, 2015 To 2025. It is also available for immediate download and adjustment. So, changes can be made in the color, design, graphics or any other component to create a unique layout.
VR Technology Market Overview Ppt PowerPoint Presentation Icon Example PDF
The following slide highlights VR technology market overview, including its growth drivers such as increase in smartphone penetration, post COVID-19 growth of virtual reality market and boost in gaming industry. Pitch your topic with ease and precision using this VR Technology Market Overview Ppt PowerPoint Presentation Icon Example PDF. This layout presents information on Growth Drivers, Key Takeaways, Exponential Virtual Reality. It is also available for immediate download and adjustment. So, changes can be made in the color, design, graphics or any other component to create a unique layout.

Customer Support Team Web Based Platform Dashboard Demonstration PDF
This slide showcases consumer service team web panel dashboard. It provides information about average customer health, churn rate, lifetime value, net promoter score, first call resolution FCR, etc. Pitch your topic with ease and precision using this Customer Support Team Web Based Platform Dashboard Demonstration PDF. This layout presents information on Churn Rate, Lifetime Value, Customer Health Score. It is also available for immediate download and adjustment. So, changes can be made in the color, design, graphics or any other component to create a unique layout.


 Continue with Email

 Home
Home


