Controlling In Management
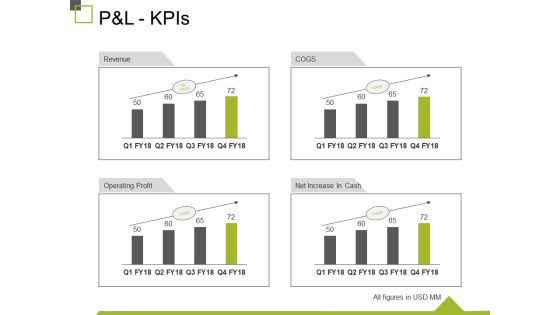
P And L Kpis Ppt PowerPoint Presentation Show Design Inspiration
This is a p and l kpis ppt powerpoint presentation show design inspiration. This is a four stage process. The stages in this process are revenue, operating profit, cogs, net increase in cash, business.
Project Updates Ppt PowerPoint Presentation Icon Graphics Design
This is a project updates ppt powerpoint presentation icon graphics design. This is a four stage process. The stages in this process are major projects bagged, major projects lost, pipeline orders, major orders in hand, business.

Cash Flow Statement Kpis Template 2 Ppt PowerPoint Presentation Layouts Visuals
This is a cash flow statement kpis template 2 ppt powerpoint presentation layouts visuals. This is a four stage process. The stages in this process are operations, financial activities, investing activities, net increase in cash.

Area Chart Ppt PowerPoint Presentation Slides Example
This is a area chart ppt powerpoint presentation slides example. This is a two stage process. The stages in this process are sales in percentage, product, area chart, business, finance.

Line Chart Ppt PowerPoint Presentation Gallery Rules
This is a line chart ppt powerpoint presentation gallery rules. This is a two stage process. The stages in this process are financial years, product, sales in percentage, line chart, growth.

Clustered Column Line Ppt PowerPoint Presentation Pictures Example
This is a clustered column line ppt powerpoint presentation pictures example. This is a three stage process. The stages in this process are product, in percentage, bar graph, growth, success.

Clustered Column Ppt PowerPoint Presentation Gallery Structure
This is a clustered column ppt powerpoint presentation gallery structure. This is a two stage process. The stages in this process are product, sales in percentage, financial year, bar graph, finance.

Bar Chart Ppt PowerPoint Presentation Diagram Lists
This is a bar chart ppt powerpoint presentation diagram lists. This is a two stage process. The stages in this process are business, marketing, financial years, sales in percentage, graph.

Column Chart Ppt PowerPoint Presentation Icon Guide
This is a column chart ppt powerpoint presentation icon guide. This is a two stage process. The stages in this process are business, year, sales in percentage, marketing, graph.

Area Chart Ppt PowerPoint Presentation Model Introduction
This is a area chart ppt powerpoint presentation model introduction. This is a two stage process. The stages in this process are sales in percentage, area chart, percentage, business, marketing.
Stacked Line Ppt PowerPoint Presentation Icon Professional
This is a stacked line ppt powerpoint presentation icon professional. This is a three stage process. The stages in this process are Business, Financial, Marketing, Graph, Strategy Revenue In Percentage.

Line Chart Ppt PowerPoint Presentation Styles Themes
This is a line chart ppt powerpoint presentation styles themes. This is a two stage process. The stages in this process are business, marketing, financial years, sales in percentage.

Area Chart Ppt PowerPoint Presentation Styles Graphics Download
This is a area chart ppt powerpoint presentation styles graphics download. This is a two stage process. The stages in this process are product, in percentage, area chart, business, marketing.

Clustered Column Line Ppt PowerPoint Presentation Infographic Template Pictures
This is a clustered column line ppt powerpoint presentation infographic template pictures. This is a three stage process. The stages in this process are product, in percentage, bar graph, growth, success.
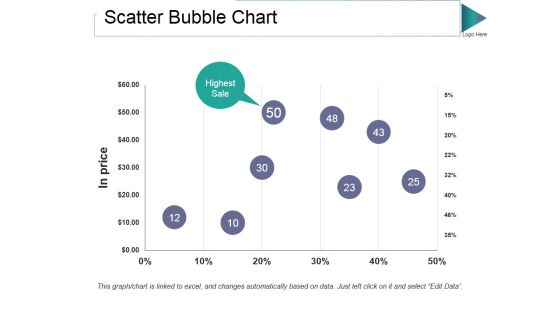
Scatter Bubble Chart Ppt PowerPoint Presentation Gallery Guidelines
This is a scatter bubble chart ppt powerpoint presentation gallery guidelines. This is a one stage process. The stages in this process are in price, highest sale, percentage, finance, business.
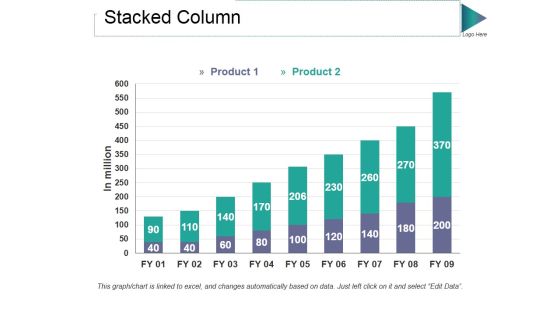
Stacked Column Ppt PowerPoint Presentation Styles Graphic Tips
This is a stacked column ppt powerpoint presentation styles graphic tips. This is a two stage process. The stages in this process are product, in million, bar graph, growth, success.

Bar Chart Ppt PowerPoint Presentation Inspiration Demonstration
This is a bar chart ppt powerpoint presentation inspiration demonstration. This is a two stage process. The stages in this process are bar chart, financial years, sales in percentage, product, finance.

Column Chart Ppt PowerPoint Presentation Gallery Slide Portrait
This is a column chart ppt powerpoint presentation gallery slide portrait. This is a two stage process. The stages in this process are sales in percentage, financial year, product, bar graph, growth.

Line Chart Ppt PowerPoint Presentation Gallery Templates
This is a line chart ppt powerpoint presentation gallery templates. This is a two stage process. The stages in this process are product, financial years, sales in percentage, line chart.

Area Chart Ppt PowerPoint Presentation Inspiration Professional
This is a area chart ppt powerpoint presentation inspiration professional. This is a two stage process. The stages in this process are financial year, in percentage, area chart, finance, business, marketing.

Bar Chart Ppt PowerPoint Presentation Visual Aids Diagrams
This is a bar chart ppt powerpoint presentation visual aids diagrams. This is a two stage process. The stages in this process are business, marketing, financial years, sales in percentage, graph.

Area Chart Ppt PowerPoint Presentation Styles Show
This is a area chart ppt powerpoint presentation styles show. This is a two stage process. The stages in this process are business, marketing, area chart, sales in percentage, percentage.

Column Chart Ppt PowerPoint Presentation Styles Graphics Design
This is a column chart ppt powerpoint presentation styles graphics design. This is a two stage process. The stages in this process are expenditure in, product, years, growth, success.

Column Chart Ppt PowerPoint Presentation File Summary
This is a column chart ppt powerpoint presentation file summary. This is a two stage process. The stages in this process are product, dollars, in years, bar graph, growth.
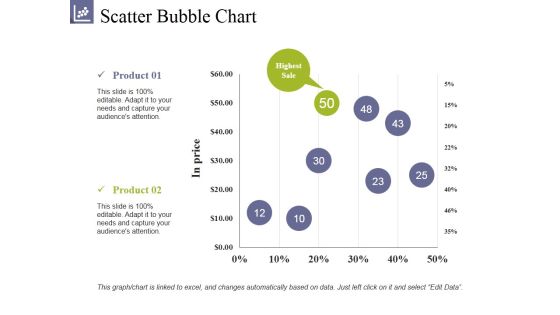
Scatter Bubble Chart Ppt PowerPoint Presentation Summary Clipart
This is a scatter bubble chart ppt powerpoint presentation summary clipart. This is a two stage process. The stages in this process are product, highest sale, in prices, growth, success.

Clustered Column Line Ppt PowerPoint Presentation File Picture
This is a clustered column line ppt powerpoint presentation file picture. This is a three stage process. The stages in this process are business, in percentage, marketing, growth, strategy, graph.

Competitors Positioning Ppt PowerPoint Presentation Styles Outfit
This is a competitors positioning ppt powerpoint presentation styles outfit. This is a two stage process. The stages in this process are company growth, million in sales, giving market share, losing market share, market share.

Competitors Positioning Ppt PowerPoint Presentation Ideas Portfolio
This is a competitors positioning ppt powerpoint presentation ideas portfolio. This is a four stage process. The stages in this process are million in sales, company growth, average market growth, market share, losing market share.

Area Chart Ppt PowerPoint Presentation Summary Information
This is a area chart ppt powerpoint presentation summary information. This is a two stage process. The stages in this process are business, sales in percentage, percentage, marketing, graph.

Column Chart Ppt PowerPoint Presentation Ideas Vector
This is a column chart ppt powerpoint presentation ideas vector. This is a two stage process. The stages in this process are column chart, product, financial years, sales in percentage, growth.

High Low Close Chart Ppt PowerPoint Presentation Portfolio Topics
This is a high low close chart ppt powerpoint presentation portfolio topics. This is a three stage process. The stages in this process are product, market size, in years, success, bar graph.
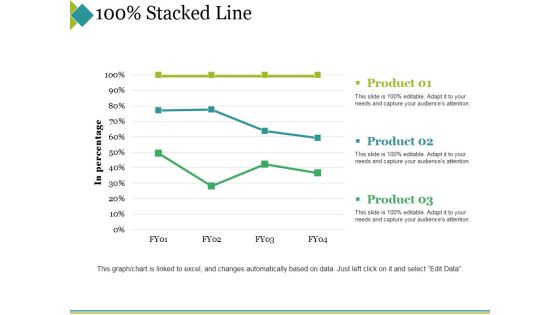
Stacked Line Ppt PowerPoint Presentation Professional Background Designs
This is a stacked line ppt powerpoint presentation professional background designs. This is a three stage process. The stages in this process are product, in percentage, stacked line, finance, business.

Revenue Streams Ppt PowerPoint Presentation Portfolio Slide Download
This is a revenue streams ppt powerpoint presentation portfolio slide download. This is a four stage process. The stages in this process are partner commission, selling in house products, supplier commission, later, revenue streams.

Scatter Bubble Chart Ppt PowerPoint Presentation Gallery Show
This is a scatter bubble chart ppt powerpoint presentation gallery show. This is a two stage process. The stages in this process are profit, in percentage, finance, marketing, business.

Actual Cost Vs Budget Ppt PowerPoint Presentation Ideas Slide Download
This is a actual cost vs budget ppt powerpoint presentation ideas slide download. This is a five stage process. The stages in this process are types of risk, actual cost, budget, difference in figures, variance.

Clustered Column Line Ppt PowerPoint Presentation Pictures Objects
This is a clustered column line ppt powerpoint presentation pictures objects. This is a three stage process. The stages in this process are in percentage, business, marketing, graph, finance.

Clustered Column Ppt PowerPoint Presentation Gallery Format
This is a clustered column ppt powerpoint presentation gallery format. This is a two stage process. The stages in this process are business, marketing, graph, financial year, sales in percentage.

Area Chart Ppt PowerPoint Presentation Infographics Good
This is a area chart ppt powerpoint presentation infographics good. This is a two stage process. The stages in this process are sales in percentage, product, area chart, business, percentage.

Column Chart Ppt PowerPoint Presentation Gallery Portfolio
This is a column chart ppt powerpoint presentation gallery portfolio. This is a two stage process. The stages in this process are in months, product, column chart, growth, success.

Cash Flow Statement Kpis Template Ppt PowerPoint Presentation Ideas Visual Aids
This is a cash flow statement kpis template ppt powerpoint presentation ideas visual aids. This is a four stage process. The stages in this process are operations, financing activities, investing activities, net increase in cash.

Area Chart Ppt PowerPoint Presentation Portfolio Graphics Design
This is a area chart ppt powerpoint presentation portfolio graphics design. This is a two stage process. The stages in this process are business, marketing, in percentage, graph, finance.

Bar Chart Ppt PowerPoint Presentation Model Picture
This is a bar chart ppt powerpoint presentation model picture. This is a two stage process. The stages in this process are product, sales in percentage, financial years, bar chart.

Cash Flow Statement Kpis Template 2 Ppt PowerPoint Presentation Portfolio Template
This is a cash flow statement kpis template 2 ppt powerpoint presentation portfolio template. This is a four stage process. The stages in this process are operations, financing activities, investing activities, net increase in cash.

Stacked Area Clustered Column Ppt PowerPoint Presentation Gallery Images
This is a stacked area clustered column ppt powerpoint presentation gallery images. This is a three stage process. The stages in this process are business, in percentage, marketing, strategy, graph.

Area Chart Ppt PowerPoint Presentation Model Slides
This is a area chart ppt powerpoint presentation model slides. This is a two stage process. The stages in this process are business, marketing, sales in percentage, chart, percentage, finance.

Area Chart Ppt PowerPoint Presentation File Visuals
This is a area chart ppt powerpoint presentation file visuals. This is a two stage process. The stages in this process are business, sales in percentage, marketing, graph, strategy, finance.
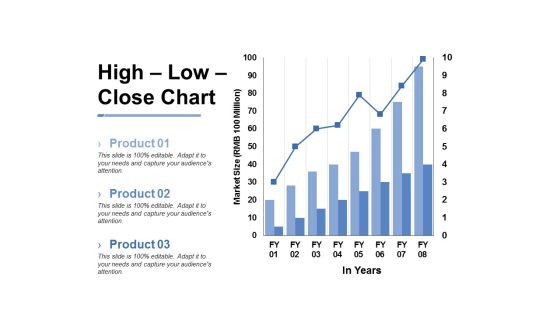
High Low Close Chart Ppt PowerPoint Presentation Inspiration Slide
This is a high low close chart ppt powerpoint presentation inspiration slide. This is a three stage process. The stages in this process are business, marketing, market size, in years, graph.

Column Chart Ppt PowerPoint Presentation Inspiration Layout Ideas
This is a column chart ppt powerpoint presentation inspiration layout ideas. This is a two stage process. The stages in this process are in years, dollars, chart, business, marketing, finance.
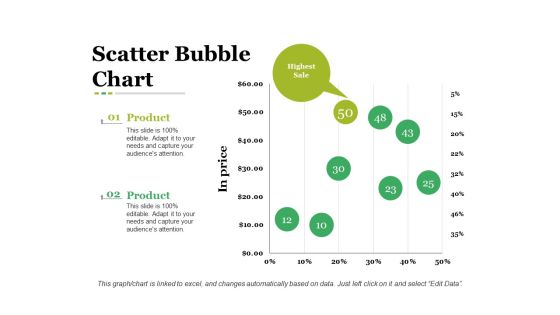
Scatter Bubble Chart Ppt PowerPoint Presentation Infographic Template Graphic Images
This is a scatter bubble chart ppt powerpoint presentation infographic template graphic images. This is a two stage process. The stages in this process are business, in price, bubble chart, marketing, strategy.

Area Chart Ppt PowerPoint Presentation Pictures Vector
This is a area chart ppt powerpoint presentation pictures vector. This is a two stage process. The stages in this process are sales in percentage, business, marketing, graph, percentage.

Cash Flow Statement Kpis Ppt PowerPoint Presentation Model Samples
This is a cash flow statement kpis ppt powerpoint presentation model samples. This is a four stage process. The stages in this process are operations, financing activities, investing activities, increase in cash.

Column Chart Ppt PowerPoint Presentation Infographic Template Icon
This is a column chart ppt powerpoint presentation infographic template icon. This is a two stage process. The stages in this process are business, marketing, sales in percentage, financial year, graph.

Stacked Line Ppt PowerPoint Presentation Professional Graphics Pictures
This is a stacked line ppt powerpoint presentation professional graphics pictures. This is a two stage process. The stages in this process are revenue in percentage, business, marketing, graph, finance.
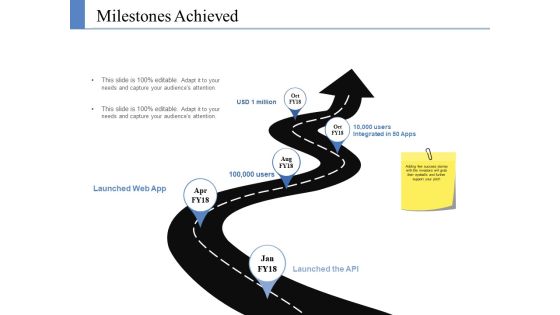
Milestones Achieved Ppt PowerPoint Presentation Model Example Introduction
This is a milestones achieved ppt powerpoint presentation model example introduction. This is a five stage process. The stages in this process are million, users, launched web app, launched the api, users integrated in apps.

Balance Sheet Kpis Template Ppt PowerPoint Presentation Gallery Inspiration
This is a balance sheet kpis template ppt powerpoint presentation gallery inspiration. This is a four stage process. The stages in this process are all figures in, non current liabilities, short term borrowings, trade payables, other current liabilities.

Cash Flow Statement Kpis Template Ppt PowerPoint Presentation Pictures Diagrams
This is a cash flow statement kpis template ppt powerpoint presentation pictures diagrams. This is a four stage process. The stages in this process are operations, financing activities, investing activities, net increase in cash.
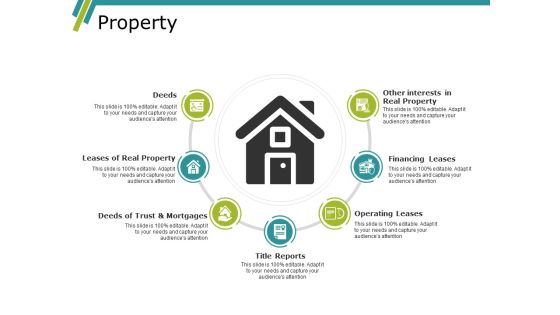
Property Ppt PowerPoint Presentation Summary Slide Portrait
This is a property ppt powerpoint presentation summary slide portrait. This is a seven stage process. The stages in this process are deeds, leases of real property, other interests in real property, financing leases, operating leases.

Bar Chart Ppt PowerPoint Presentation Summary File Formats
This is a bar chart ppt powerpoint presentation summary file formats. This is a two stage process. The stages in this process are business, finance, financial years, sales in percentage, graph.

Column Chart Ppt PowerPoint Presentation Layouts Graphic Images
This is a column chart ppt powerpoint presentation layouts graphic images. This is a two stage process. The stages in this process are business, finance, years, graph, expenditure in, marketing.

Bar Chart Ppt PowerPoint Presentation Model Sample
This is a bar chart ppt powerpoint presentation model sample. This is a two stage process. The stages in this process are sales in percentage, business, marketing, graph, percentage, year.
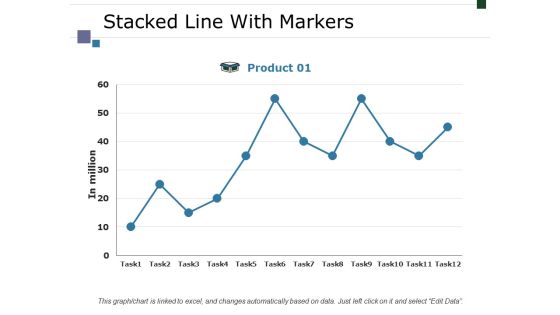
Stacked Line With Markers Ppt PowerPoint Presentation Layouts Display
This is a stacked line with markers ppt powerpoint presentation layouts display. This is a one stage process. The stages in this process are business, marketing, strategy, in million, finance.

Clustered Column Line Ppt PowerPoint Presentation Topics
This is a clustered column line ppt powerpoint presentation topics. This is a three stage process. The stages in this process are product, in percentage, growth, bar graph, business.

Column Chart Ppt PowerPoint Presentation Infographics Guidelines
This is a column chart ppt powerpoint presentation infographics guidelines. This is a two stage process. The stages in this process are product, expenditure in, years, business, bar graph.

Cash Flow Statement - Kpis Ppt PowerPoint Presentation Layouts Graphics Template
This is a cash flow statement - kpis ppt powerpoint presentation layouts graphics template. This is a four stage process. The stages in this process are operations, financing activities, investing activities, net increase in cash.
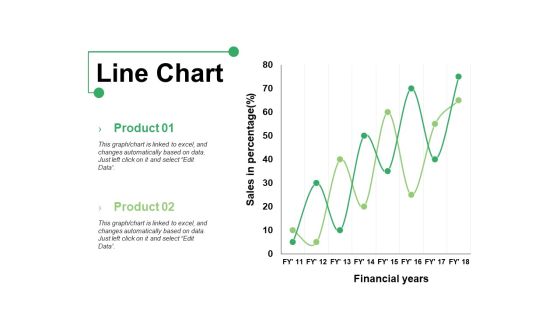
Line Chart Ppt PowerPoint Presentation Show Graphics Example
This is a line chart ppt powerpoint presentation show graphics example. This is a two stage process. The stages in this process are product, line chart, financial years, sales in percentage.

Bar Chart Ppt PowerPoint Presentation Infographics Format Ideas
This is a bar chart ppt powerpoint presentation infographics format ideas. This is a two stage process. The stages in this process are bar graph, product, financial year, sales in percentage.

Market Feasibility Ppt PowerPoint Presentation Infographics Brochure
This is a market feasibility ppt powerpoint presentation infographics brochure. This is a six stage process. The stages in this process are demand statistics, competitive analysis, swot analysis, key trends in the industry.
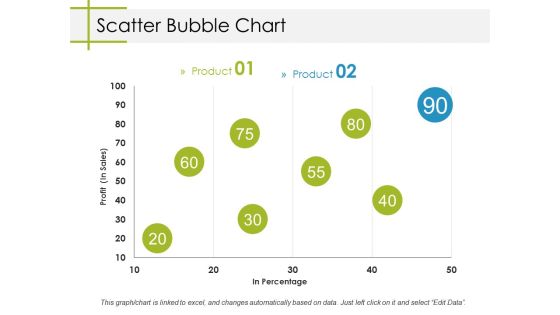
Scatter Bubble Chart Ppt PowerPoint Presentation Model Designs
This is a scatter bubble chart ppt powerpoint presentation model designs. This is a two stage process. The stages in this process are business, profit, in percentage, bubble chart, marketing.
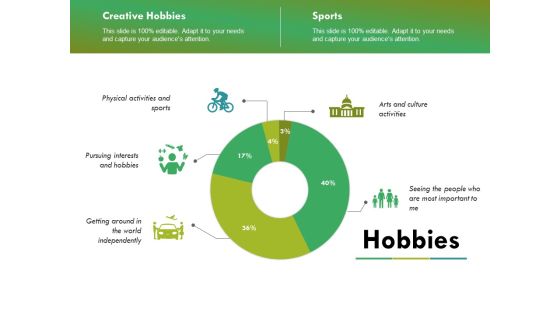
Hobbies Ppt PowerPoint Presentation Ideas Graphics Tutorials
This is a hobbies ppt powerpoint presentation ideas graphics tutorials. This is a three stage process. The stages in this process are physical activities and sports, pursuing interests and hobbies, arts and culture activities, getting around in the world independently.

Stacked Line With Markers Ppt PowerPoint Presentation Pictures Design Templates
This is a stacked line with markers ppt powerpoint presentation pictures design templates. This is a one stage process. The stages in this process are business, marketing, finance, in million, graph.

Stacked Line Ppt PowerPoint Presentation Pictures Example Topics
This is a stacked line ppt powerpoint presentation pictures example topics. This is a three stage process. The stages in this process are product, in percentage, stacked line, business, marketing.

Line Chart Ppt PowerPoint Presentation Professional Grid
This is a line chart ppt powerpoint presentation professional grid. This is a two stage process. The stages in this process are sales in percentage, financial years, product, line chart.

Area Chart Ppt PowerPoint Presentation Infographics Graphics Pictures
This is a area chart ppt powerpoint presentation infographics graphics pictures. This is a two stage process. The stages in this process are business, sales in percentage, area chart, marketing, graph.
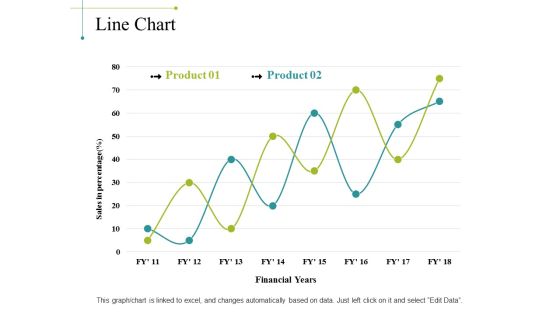
Line Chart Ppt PowerPoint Presentation Portfolio Background Image
This is a line chart ppt powerpoint presentation portfolio background image. This is a two stage process. The stages in this process are sales in percentage, financial years, chart, business, marketing, finance.

Area Chart Ppt PowerPoint Presentation Show Professional
This is a area chart ppt powerpoint presentation show professional. This is a two stage process. The stages in this process are product, in percentage, area chart, growth, success.

Cash Flow Statement Graphical Representation Ppt PowerPoint Presentation Ideas Graphic Tips
This is a cash flow statement graphical representation ppt powerpoint presentation ideas graphic tips. This is a four stage process. The stages in this process are operations, financing activities, investing activities, net increase in cash.

Line Chart Ppt PowerPoint Presentation Infographic Template Design Ideas
This is a line chart ppt powerpoint presentation infographic template design ideas. This is a two stage process. The stages in this process are product, in millions, percentage, line chart, success.

Project Updates Ppt PowerPoint Presentation Pictures Grid
This is a project updates ppt powerpoint presentation pictures grid. This is a four stage process. The stages in this process are major projects bagged, major orders in hand, major projects lost, pipeline orders.

Area Chart Ppt PowerPoint Presentation Ideas Professional
This is a area chart ppt powerpoint presentation ideas professional. This is a two stage process. The stages in this process are business, sales in percentage, area chart, marketing, finance.

Cash Flow Statement Graphical Representation Ppt PowerPoint Presentation Professional Graphics Tutorials
This is a cash flow statement graphical representation ppt powerpoint presentation professional graphics tutorials. This is a four stage process. The stages in this process are business, operations, financing activities, net increase in cash, investing activities.
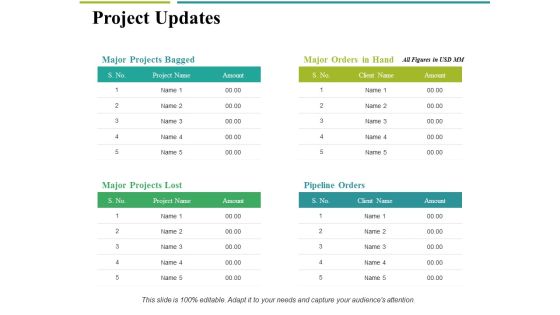
Project Updates Ppt PowerPoint Presentation Ideas Graphics Download
This is a project updates ppt powerpoint presentation ideas graphics download. This is a four stage process. The stages in this process are major projects bagged, major projects lost, major orders in hand, pipeline orders, business.

Area Chart Ppt PowerPoint Presentation Inspiration Graphics
This is a area chart ppt powerpoint presentation inspiration graphics. This is a two stage process. The stages in this process are product, area chart, business, growth, sales in percentage.

Stacked Line Template 1 Ppt PowerPoint Presentation Infographic Template Graphics
This is a stacked line template 1 ppt powerpoint presentation infographic template graphics. This is a three stage process. The stages in this process are product, unit count, in years, business, marketing.

Stacked Line Ppt PowerPoint Presentation Infographics Vector
This is a stacked line ppt powerpoint presentation infographics vector. This is a three stage process. The stages in this process are product, stacked line, business, marketing, in percentage.

Clustered Column Ppt PowerPoint Presentation Inspiration Introduction
This is a clustered column ppt powerpoint presentation inspiration introduction. This is a two stage process. The stages in this process are business, marketing, in percentage, finance, graph, strategy.

Area Chart Ppt PowerPoint Presentation Icon Aids
This is a area chart ppt powerpoint presentation icon aids. This is a three stage process. The stages in this process are financial years, sales in percentage, business, marketing, graph.

Bar Chart Ppt PowerPoint Presentation Summary Themes
This is a bar chart ppt powerpoint presentation summary themes. This is a three stage process. The stages in this process are financial years, sales in percentage, business, marketing, graph.

Combo Chart Ppt PowerPoint Presentation Gallery Design Ideas
This is a combo chart ppt powerpoint presentation gallery design ideas. This is a three stage process. The stages in this process are business, financial years, sales in percentage, finance, graph.
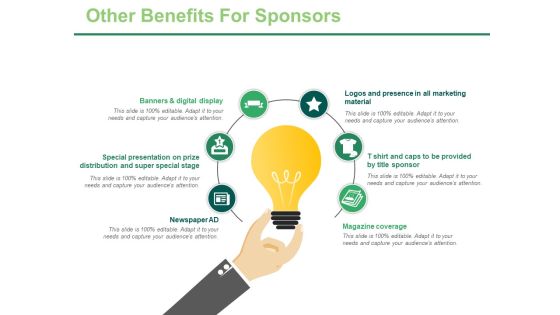
Other Benefits For Sponsors Ppt PowerPoint Presentation Model Visuals
This is a other benefits for sponsors ppt powerpoint presentation model visuals. This is a six stage process. The stages in this process are banners and digital display, newspaper ad, magazine coverage, logos and presence in all marketing material.

Stacked Area Clustered Column Ppt PowerPoint Presentation Gallery Gridlines
This is a stacked area clustered column ppt powerpoint presentation gallery gridlines. This is a three stage process. The stages in this process are bar graph, product, in percentage.

Line Chart Ppt PowerPoint Presentation Infographic Template Master Slide
This is a line chart ppt powerpoint presentation infographic template master slide. This is a two stage process. The stages in this process are product, financial years, sales in percentage.

Bar Chart Ppt PowerPoint Presentation Layouts Template
This is a bar chart ppt powerpoint presentation layouts template. This is a two stage process. The stages in this process are financial year, sales in percentage, business, marketing, finance.

Area Chart Ppt PowerPoint Presentation Model Demonstration
This is a area chart ppt powerpoint presentation model demonstration. This is a two stage process. The stages in this process are business, marketing, financial year, in percentage, graph.

Bar Graph Ppt PowerPoint Presentation Infographics Icon
This is a bar graph ppt powerpoint presentation infographics icon. This is a two stage process. The stages in this process are business, marketing, financial year, in percentage, graph.

Combo Chart Ppt PowerPoint Presentation Summary Background Images
This is a combo chart ppt powerpoint presentation summary background images. This is a two stage process. The stages in this process are business, marketing, financial year, in percentage, graph.

Bar Chart Ppt PowerPoint Presentation Slides Example File
This is a bar chart ppt powerpoint presentation slides example file. This is a two stage process. The stages in this process are product, financial years, sales in percentage.
Hobbies Ppt PowerPoint Presentation Layouts Example Topics
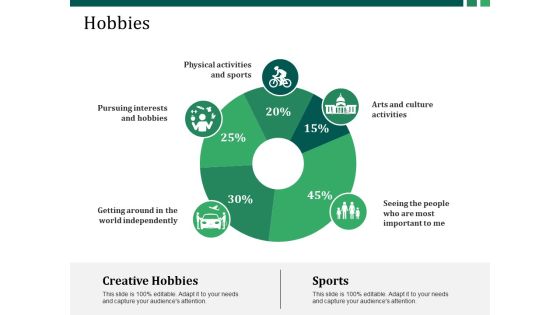
This is a hobbies ppt powerpoint presentation layouts example topics. This is a three stage process. The stages in this process are getting around in the world independently, pursuing interests and hobbies, physical activities and sports, creative hobbies, sports.

Cash Flow Statement Graphical Representation Ppt PowerPoint Presentation Professional Show
This is a cash flow statement graphical representation ppt powerpoint presentation professional show. This is a four stage process. The stages in this process are business, operations, investing activities, net increase in cash, financing activities.

Bar Graph Ppt PowerPoint Presentation Portfolio Slide Portrait
This is a bar graph ppt powerpoint presentation portfolio slide portrait. This is a three stage process. The stages in this process are product, sales in percentage, bar graph, growth, success.

Area Chart Ppt PowerPoint Presentation Inspiration Background Designs
This is a area chart ppt powerpoint presentation inspiration background designs. This is a two stage process. The stages in this process are business, sales in percentage, area chart, marketing, finance.
Sales Kpi Tracker Ppt PowerPoint Presentation Pictures Layout Ideas
This is a sales kpi tracker ppt powerpoint presentation pictures layout ideas. This is a four stage process. The stages in this process are opportunities won, top products in revenue, leads created, win ratio vs last yr, open deals vs.
Sales Product Performance Dashboard Ppt PowerPoint Presentation Model Graphics Design
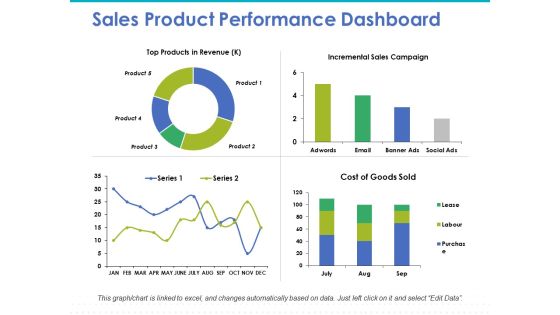
This is a sales product performance dashboard ppt powerpoint presentation model graphics design. This is a four stage process. The stages in this process are top products in revenue, incremental sales, cost of goods.
Sales Product Performance Dashboard Ppt PowerPoint Presentation Summary Icon
This is a sales product performance dashboard ppt powerpoint presentation infographics samples. This is a four stage process. The stages in this process are top products in revenue, incremental sales campaign, sales product performance, cost of goods sold.

Clustered Column Line Ppt PowerPoint Presentation Model Graphics Tutorials
This is a clustered column line ppt powerpoint presentation model graphics tutorials. This is a three stage process. The stages in this process are business, marketing, in percentage, finance, graph.
Stacked Area Clustered Column Ppt PowerPoint Presentation Professional Clipart
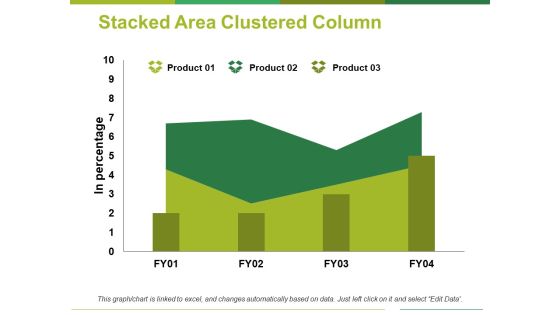
This is a stacked area clustered column ppt powerpoint presentation professional clipart. This is a three stage process. The stages in this process are product, in percentage, area chart.

Clustered Column Ppt PowerPoint Presentation Infographic Template Backgrounds
This is a clustered column ppt powerpoint presentation infographic template backgrounds. This is a two stage process. The stages in this process are sales in percentage, financial year, product.

Area Chart Ppt PowerPoint Presentation Layouts Background Designs
This is a area chart ppt powerpoint presentation layouts background designs. This is a two stage process. The stages in this process are business, marketing, in percentage, area chart, finance.

Area Chart Ppt PowerPoint Presentation Model Inspiration
This is a area chart ppt powerpoint presentation model inspiration. This is a two stage process. The stages in this process are financial year, in percentage, area chart, business, marketing.

Bar Chart Ppt PowerPoint Presentation Infographic Template Picture
This is a bar chart ppt powerpoint presentation infographic template picture. This is a two stage process. The stages in this process are financial, in percentage, business, marketing, bar chart.

Combo Chart Ppt PowerPoint Presentation Model Vector
This is a combo chart ppt powerpoint presentation model vector. This is a two stage process. The stages in this process are financial year, in percentage, business, marketing, combo chart.
High Low Close Chart Ppt PowerPoint Presentation Model Inspiration
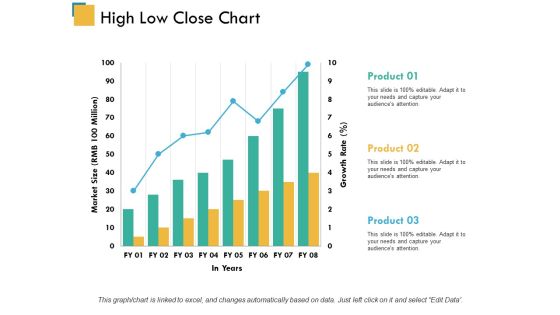
This is a high low close chart ppt powerpoint presentation model inspiration. This is a three stage process. The stages in this process are product, market size, in years.
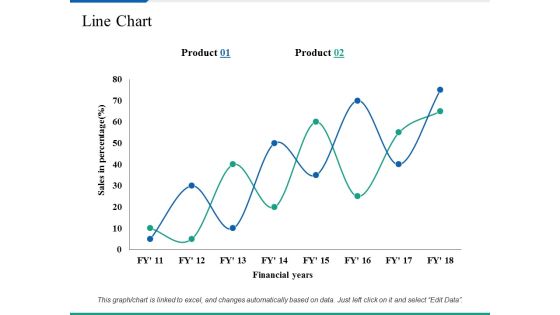
Line Chart Ppt PowerPoint Presentation Summary Clipart Images
This is a line chart ppt powerpoint presentation summary clipart images. This is a two stage process. The stages in this process are business, marketing, sales in percentage, financial years, strategy.
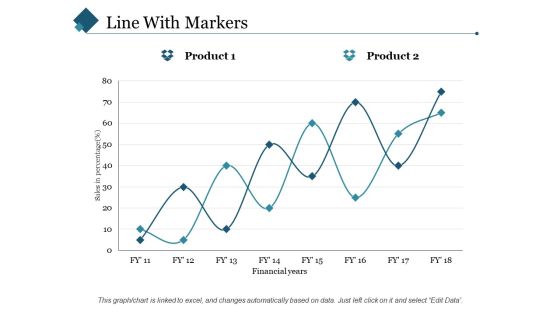
Line With Markers Ppt PowerPoint Presentation Styles Slide Portrait
This is a line with markers ppt powerpoint presentation styles slide portrait. This is a two stage process. The stages in this process are sales in percentage, financial years, product.

Stacked Area Clustered Column Ppt PowerPoint Presentation Layouts Templates
This is a stacked area clustered column ppt powerpoint presentation layouts templates. This is a three stage process. The stages in this process are product, in percentage, area chart.

Combo Chart Ppt PowerPoint Presentation Pictures Objects
This is a combo chart ppt powerpoint presentation pictures objects. This is a three stage process. The stages in this process are product, combo chart, in years, market size.

Annual Budget Ppt PowerPoint Presentation Model Samples
This is a annual budget ppt powerpoint presentation model samples. This is a five stage process. The stages in this process are actual cost, budget, percent variance, difference in figures, expense.

Company Sales And Performance Dashboard Ppt PowerPoint Presentation Show Structure
This is a company sales and performance dashboard ppt powerpoint presentation show structure. This is a four stage process. The stages in this process are year product sales, month growth in revenue, profit margins graph, year profits.

Targets For The Next Business Quarter Ppt PowerPoint Presentation Layouts Objects
This is a targets for the next business quarter ppt powerpoint presentation layouts objects. This is a four stage process. The stages in this process are expand in a new location, increase core product sales by, our goals, achievement.

Area Chart Ppt PowerPoint Presentation Icon Summary
This is a area chart ppt powerpoint presentation icon summary. This is a two stage process. The stages in this process are financial year, area chart, in percentage, product.

Area Stacked Ppt PowerPoint Presentation Infographics Shapes
This is a area stacked ppt powerpoint presentation infographics shapes. This is a two stage process. The stages in this process are product, area stacked, sales in percentage, financial year.
Stacked Column Ppt PowerPoint Presentation Icon Inspiration
This is a stacked column ppt powerpoint presentation icon inspiration. This is a two stage process. The stages in this process are stacked column, product, sales, growth, sales in percentage.
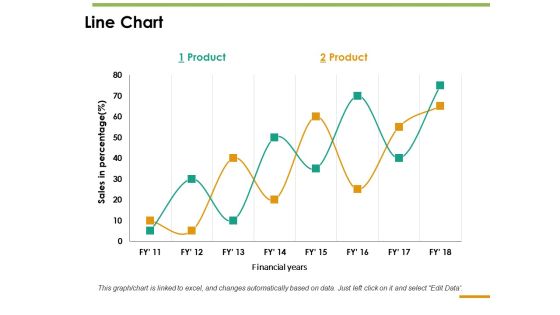
Line Chart Ppt PowerPoint Presentation Inspiration Guide
This is a line chart ppt powerpoint presentation inspiration guide. This is a two stage process. The stages in this process are line chart, sales in percentage, product, financial years.

Area Chart Ppt PowerPoint Presentation Icon Show
This is a area chart ppt powerpoint presentation icon show. This is a two stage process. The stages in this process are product, financial year, in percentage, area chart.

Combo Chart Ppt PowerPoint Presentation Gallery Diagrams
This is a combo chart ppt powerpoint presentation gallery diagrams. This is a three stage process. The stages in this process are combo chart, market size, product, in years, growth rate.

Stacked Area Clustered Column Ppt PowerPoint Presentation Summary Slides
This is a stacked area clustered column ppt powerpoint presentation summary slides. This is a three stage process. The stages in this process are product, in percentage, financial year, bar graph.

Column Chart Ppt PowerPoint Presentation Portfolio Example Topics
This is a column chart ppt powerpoint presentation portfolio example topics. This is a two stage process. The stages in this process are product, financial year, sales in percentage, column chart.
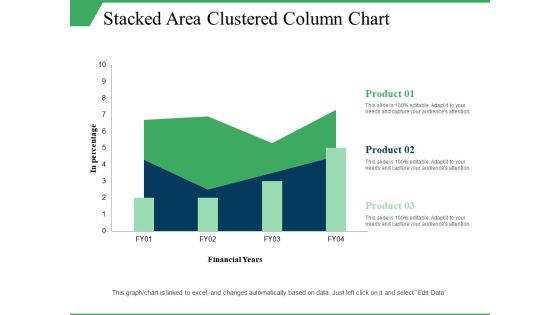
Stacked Area Clustered Column Chart Ppt PowerPoint Presentation Visual Aids Model
This is a stacked area clustered column chart ppt powerpoint presentation visual aids model. This is a three stage process. The stages in this process are in percentage, product, financial years, growth, column chart.
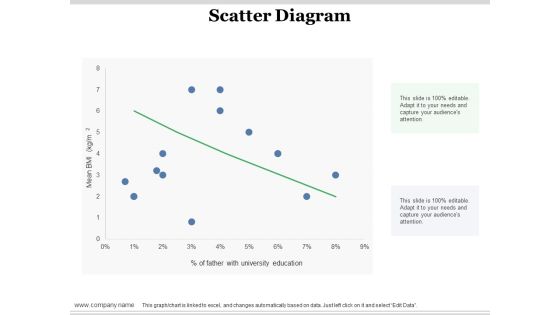
Scatter Diagram Ppt PowerPoint Presentation Infographic Template Design Ideas
This is a scatter diagram ppt powerpoint presentation infographic template design ideas. This is a one stage process. The stages in this process are scatter diagram, finance, in percentage, business, bar graph.
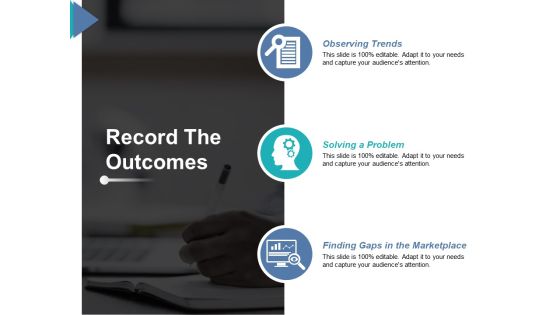
Record The Outcomes Personal Enterprise Plan Ppt PowerPoint Presentation Inspiration Format Ideas
This is a record the outcomes personal enterprise plan ppt powerpoint presentation inspiration format ideas. This is a three stage process. The stages in this process are icon, business, observing trends, solving a problem, finding gaps in the marketplace.
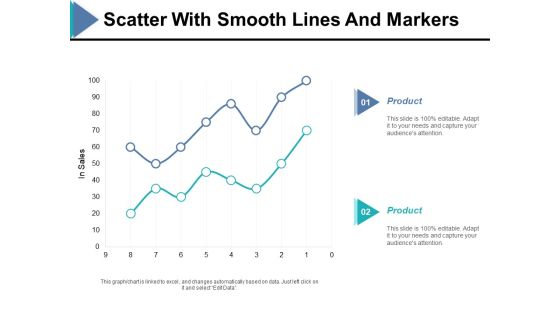
Scatter With Smooth Lines And Markers Ppt PowerPoint Presentation Ideas Example
This is a scatter with smooth lines and markers ppt powerpoint presentation ideas example. This is a two stage process. The stages in this process are in sales, finance, bar graph, product, business.

Stacked Column Chart Ppt PowerPoint Presentation Summary Gallery
This is a stacked column chart ppt powerpoint presentation summary gallery. This is a two stage process. The stages in this process are stacked column chart, product, in years, growth, percentage.

Column Chart Ppt PowerPoint Presentation Layouts File Formats
This is a column chart ppt powerpoint presentation layouts file formats. This is a three stage process. The stages in this process are column chart, product, in percentage, year, finance.
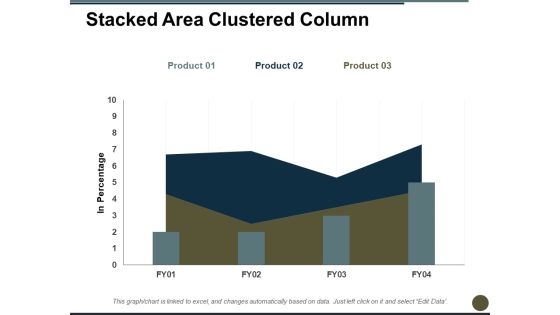
Stacked Area Clustered Column Ppt PowerPoint Presentation Professional Graphics
This is a stacked area clustered column ppt powerpoint presentation professional graphics. This is a three stage process. The stages in this process are in percentage, bar chart, product, growth, year.

Bubble Chart Ppt PowerPoint Presentation Summary Graphics Tutorials
This is a bubble chart ppt powerpoint presentation summary graphics tutorials. This is a three stage process. The stages in this process are product, sales in percentage, bubble chart.

Clustered Column Chart Ppt PowerPoint Presentation Professional Ideas
This is a clustered column chart ppt powerpoint presentation professional ideas. This is a three stage process. The stages in this process are product, sales in percentage, column, years.

Scatter Bubble Chart Ppt PowerPoint Presentation Professional
This is a scatter bubble chart ppt powerpoint presentation professional. This is a three stage process. The stages in this process are scatter bubble chart, product, in price, percentage, business.
Stacked Area Clustered Column Ppt PowerPoint Presentation Inspiration Icon
This is a stacked area clustered column ppt powerpoint presentation inspiration icon. This is a three stage process. The stages in this process are stacked area clustered column, product, year, in dollars, business.

Business Achievement And Milestones Flags On Mountain Ppt PowerPoint Presentation Slides Introduction
This is a business achievement and milestones flags on mountain ppt powerpoint presentation slides introduction. This is a six stage process. The stages in this process are year in review, yearly highlights, countdowns.

Business Developments And Achievements Top Sales And Mergers Ppt PowerPoint Presentation Infographics Designs
This is a business developments and achievements top sales and mergers ppt powerpoint presentation infographics designs. This is a six stage process. The stages in this process are year in review, yearly highlights, countdowns.

Business Planning Timeline And Financial Forecasting Ppt PowerPoint Presentation Pictures Show
This is a business planning timeline and financial forecasting ppt powerpoint presentation pictures show. This is a three stage process. The stages in this process are year in review, yearly highlights, countdowns.

Business Review And Performance Assessment Dashboards Ppt PowerPoint Presentation Infographics Show
This is a business review and performance assessment dashboards ppt powerpoint presentation infographics show. This is a four stage process. The stages in this process are year in review, yearly highlights, countdowns.
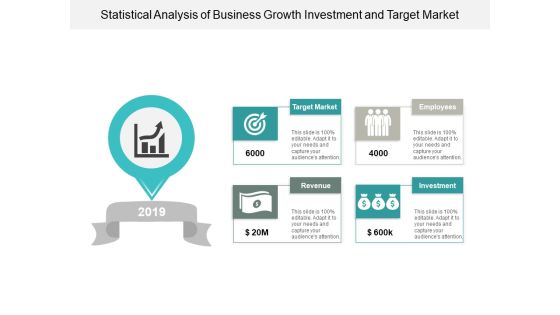
Statistical Analysis Of Business Growth Investment And Target Market Ppt PowerPoint Presentation Infographics Professional
This is a statistical analysis of business growth investment and target market ppt powerpoint presentation infographics professional. This is a four stage process. The stages in this process are year in review, yearly highlights, countdowns.
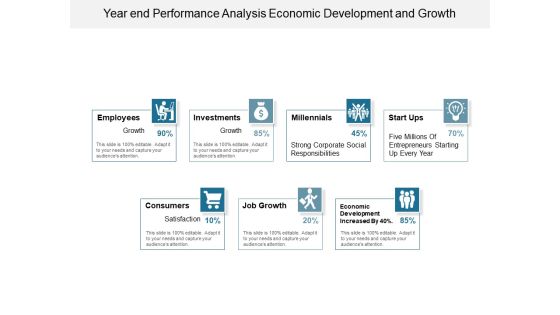
Year End Performance Analysis Economic Development And Growth Ppt PowerPoint Presentation Infographic Template Shapes
This is a year end performance analysis economic development and growth ppt powerpoint presentation infographic template shapes. This is a seven stage process. The stages in this process are year in review, yearly highlights, countdowns.
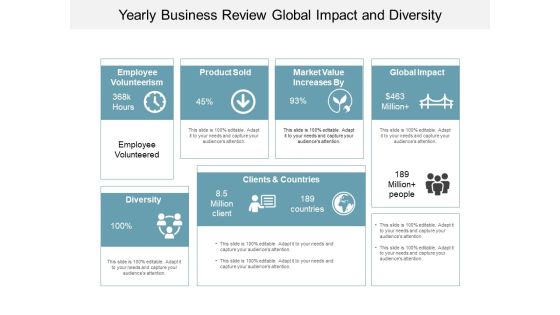
Yearly Business Review Global Impact And Diversity Ppt PowerPoint Presentation Pictures Portrait
This is a yearly business review global impact and diversity ppt powerpoint presentation pictures portrait. This is a seven stage process. The stages in this process are year in review, yearly highlights, countdowns.
Three Cubes Vector Icon Ppt PowerPoint Presentation Professional Format Ideas
This is a exclamation mark in triangle caution sign ppt powerpoint presentation icon portrait. This is a three stage process. The stages in this process are 3 sides, 3 templates, three slides.
Three Sections Curved Triangle Vector Icon Ppt PowerPoint Presentation Model Format Ideas
This is a exclamation mark in triangle caution sign ppt powerpoint presentation icon portrait. This is a three stage process. The stages in this process are 3 sides, 3 templates, three slides.
Triangle Vector Icon With Text Holders Ppt PowerPoint Presentation Infographics Icon
This is a exclamation mark in triangle caution sign ppt powerpoint presentation icon portrait. This is a three stage process. The stages in this process are 3 sides, 3 templates, three slides.
Triangle With Three Sides Vector Icon Ppt PowerPoint Presentation Model Images
This is a exclamation mark in triangle caution sign ppt powerpoint presentation icon portrait. This is a three stage process. The stages in this process are 3 sides, 3 templates, three slides.

Clustered Bar Finance Ppt Powerpoint Presentation Ideas Themes
This is a clustered bar finance ppt powerpoint presentation ideas themes. This is a three stage process. The stages in this process are clustered bar, product, in percentage, years, profit.
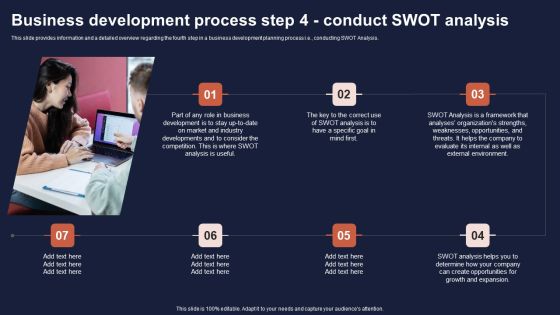
Overview Of Business Growth Plan And Tactics Business Development Process Step 4 Conduct Designs PDF
This slide provides information and a detailed overview regarding the fourth step in a business development planning process i.e., conducting SWOT Analysis. Present like a pro with Overview Of Business Growth Plan And Tactics Business Development Process Step 4 Conduct Designs PDF Create beautiful presentations together with your team, using our easy to use presentation slides. Share your ideas in real time and make changes on the fly by downloading our templates. So whether you are in the office, on the go, or in a remote location, you can stay in sync with your team and present your ideas with confidence. With Slidegeeks presentation got a whole lot easier. Grab these presentations today.
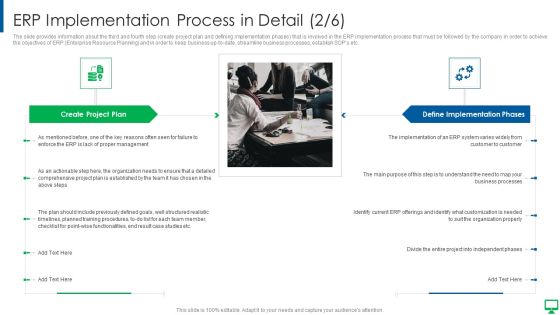
Execution Of ERP System To Enhance Business Effectiveness ERP Implementation Rules PDF
The slide provides information about the third and fourth step create project plan and defining implementation phases that is involved in the ERP Implementation process that must be followed by the company in order to achieve the objectives of ERP Enterprise Resource Planning and in order to keep business up to date, streamline business processes, establish SOPs Presenting Execution of erp system to enhance business effectiveness erp implementation rules pdf to provide visual cues and insights. Share and navigate important information on two stages that need your due attention. This template can be used to pitch topics like comprehensive project, proper management, previously defined In addtion, this PPT design contains high resolution images, graphics, etc, that are easily editable and available for immediate download.
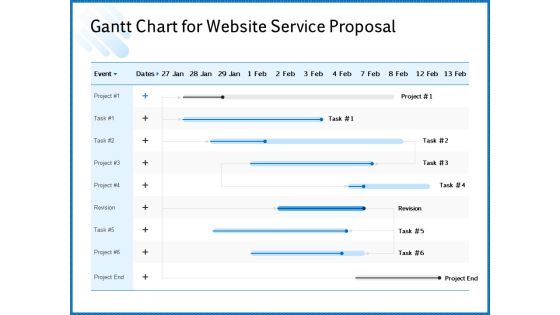
Web Design Template Gantt Chart For Website Service Proposal Formats PDF
Your complex projects can be managed and organized simultaneously using this detailed web design template gantt chart for website service proposal formats pdf template. Track the milestones, tasks, phases, activities, and subtasks to get an updated visual of your project. Share your planning horizon and release plan with this well crafted presentation template. This exemplary template can be used to plot various dependencies to distinguish the tasks in the pipeline and their impact on the schedules and deadlines of the project. Apart from this, you can also share this visual presentation with your team members and stakeholders. It a resourceful tool that can be incorporated into your business structure. Therefore, download and edit it conveniently to add the data and statistics as per your requirement.

Web Development IT And Design Templates Gantt Chart For Website Development Proposal Demonstration PDF
Your complex projects can be managed and organized simultaneously using this detailed web development it and design templates gantt chart for website development proposal demonstration pdf template. Track the milestones, tasks, phases, activities, and subtasks to get an updated visual of your project. Share your planning horizon and release plan with this well crafted presentation template. This exemplary template can be used to plot various dependencies to distinguish the tasks in the pipeline and their impact on the schedules and deadlines of the project. Apart from this, you can also share this visual presentation with your team members and stakeholders. It a resourceful tool that can be incorporated into your business structure. Therefore, download and edit it conveniently to add the data and statistics as per your requirement.

Gantt Chart For Electrical Engineering Services Proposal Ppt Layouts Layout PDF
Your complex projects can be managed and organized simultaneously using this detailed gantt chart for electrical engineering services proposal ppt layouts layout pdf template. Track the milestones, tasks, phases, activities, and subtasks to get an updated visual of your project. Share your planning horizon and release plan with this well-crafted presentation template. This exemplary template can be used to plot various dependencies to distinguish the tasks in the pipeline and their impact on the schedules and deadlines of the project. Apart from this, you can also share this visual presentation with your team members and stakeholders. It a resourceful tool that can be incorporated into your business structure. Therefore, download and edit it conveniently to add the data and statistics as per your requirement.
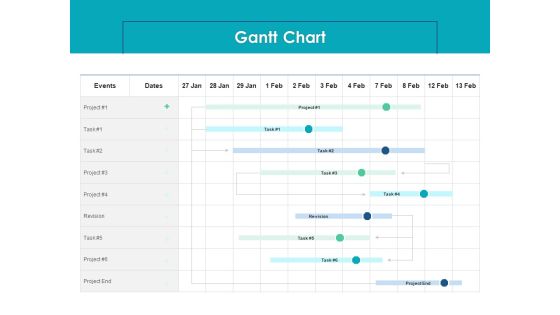
Housing Mortgage Proposal Gantt Chart Ppt Pictures Brochure PDF
Your complex projects can be managed and organized simultaneously using this detailed housing mortgage proposal gantt chart ppt pictures brochure pdf template. Track the milestones, tasks, phases, activities, and subtasks to get an updated visual of your project. Share your planning horizon and release plan with this well crafted presentation template. This exemplary template can be used to plot various dependencies to distinguish the tasks in the pipeline and their impact on the schedules and deadlines of the project. Apart from this, you can also share this visual presentation with your team members and stakeholders. It a resourceful tool that can be incorporated into your business structure. Therefore, download and edit it conveniently to add the data and statistics as per your requirement.
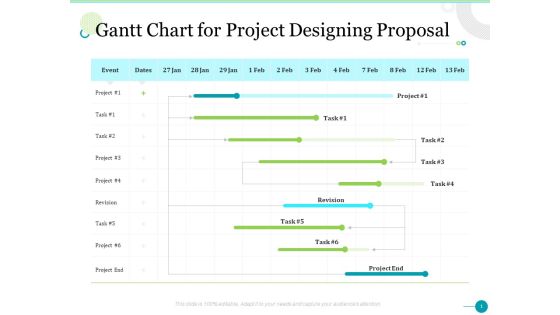
Gantt Chart For Project Designing Proposal Ppt Inspiration Pictures PDF
Your complex projects can be managed and organized simultaneously using this detailed gantt chart for project designing proposal ppt inspiration pictures pdf template. Track the milestones, tasks, phases, activities, and subtasks to get an updated visual of your project. Share your planning horizon and release plan with this well crafted presentation template. This exemplary template can be used to plot various dependencies to distinguish the tasks in the pipeline and their impact on the schedules and deadlines of the project. Apart from this, you can also share this visual presentation with your team members and stakeholders. It a resourceful tool that can be incorporated into your business structure. Therefore, download and edit it conveniently to add the data and statistics as per your requirement.
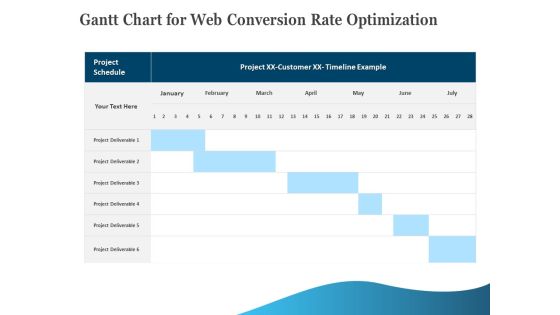
Gantt Chart For Web Conversion Rate Optimization Download PDF
Your complex projects can be managed and organized simultaneously using this detailed gantt chart for web conversion rate optimization download pdf template. Track the milestones, tasks, phases, activities, and subtasks to get an updated visual of your project. Share your planning horizon and release plan with this well-crafted presentation template. This exemplary template can be used to plot various dependencies to distinguish the tasks in the pipeline and their impact on the schedules and deadlines of the project. Apart from this, you can also share this visual presentation with your team members and stakeholders. It a resourceful tool that can be incorporated into your business structure. Therefore, download and edit it conveniently to add the data and statistics as per your requirement.
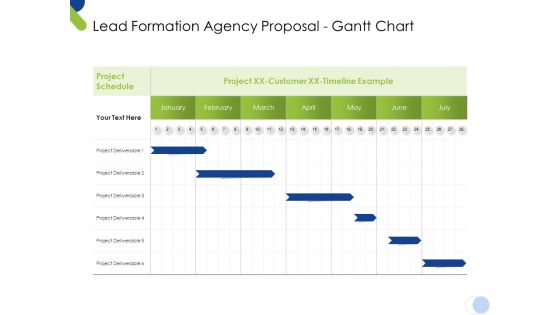
Lead Formation Agency Proposal Gantt Chart Ppt Summary Infographics PDF
Your complex projects can be managed and organized simultaneously using this detailed lead formation agency proposal gantt chart ppt summary infographics pdf template. Track the milestones, tasks, phases, activities, and subtasks to get an updated visual of your project. Share your planning horizon and release plan with this well crafted presentation template. This exemplary template can be used to plot various dependencies to distinguish the tasks in the pipeline and their impact on the schedules and deadlines of the project. Apart from this, you can also share this visual presentation with your team members and stakeholders. It a resourceful tool that can be incorporated into your business structure. Therefore, download and edit it conveniently to add the data and statistics as per your requirement.
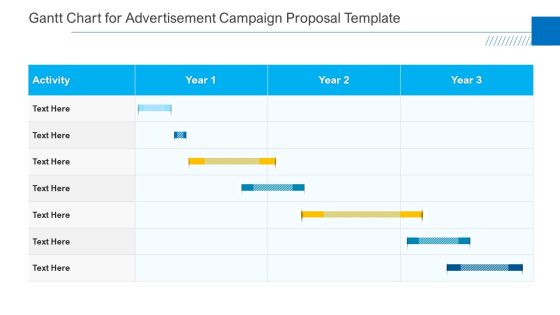
Gantt Chart For Advertisement Campaign Proposal Template Summary PDF
Your complex projects can be managed and organized simultaneously using this detailed gantt chart for advertisement campaign proposal template summary pdf template. Track the milestones, tasks, phases, activities, and subtasks to get an updated visual of your project. Share your planning horizon and release plan with this well crafted presentation template. This exemplary template can be used to plot various dependencies to distinguish the tasks in the pipeline and their impact on the schedules and deadlines of the project. Apart from this, you can also share this visual presentation with your team members and stakeholders. It a resourceful tool that can be incorporated into your business structure. Therefore, download and edit it conveniently to add the data and statistics as per your requirement.

Gantt Chart For Digital Marketing Proposal For Increasing Website Traffic Summary PDF
Your complex projects can be managed and organized simultaneously using this detailed gantt chart for digital marketing proposal for increasing website traffic summary pdf template. Track the milestones, tasks, phases, activities, and subtasks to get an updated visual of your project. Share your planning horizon and release plan with this well crafted presentation template. This exemplary template can be used to plot various dependencies to distinguish the tasks in the pipeline and their impact on the schedules and deadlines of the project. Apart from this, you can also share this visual presentation with your team members and stakeholders. It a resourceful tool that can be incorporated into your business structure. Therefore, download and edit it conveniently to add the data and statistics as per your requirement.
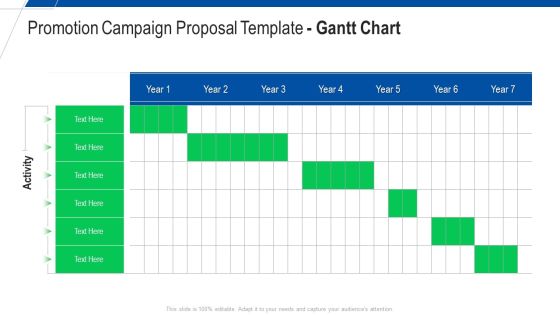
Promotion Campaign Proposal Template Gantt Chart Ppt Pictures Slide PDF
Your complex projects can be managed and organized simultaneously using this detailed promotion campaign proposal template gantt chart ppt pictures slide pdf template. Track the milestones, tasks, phases, activities, and subtasks to get an updated visual of your project. Share your planning horizon and release plan with this well crafted presentation template. This exemplary template can be used to plot various dependencies to distinguish the tasks in the pipeline and their impact on the schedules and deadlines of the project. Apart from this, you can also share this visual presentation with your team members and stakeholders. It a resourceful tool that can be incorporated into your business structure. Therefore, download and edit it conveniently to add the data and statistics as per your requirement.

Application Design Project Gantt Chart Diagrams PDF
Your complex projects can be managed and organized simultaneously using this detailed application design project gantt chart diagrams pdf template. Track the milestones, tasks, phases, activities, and subtasks to get an updated visual of your project. Share your planning horizon and release plan with this well crafted presentation template. This exemplary template can be used to plot various dependencies to distinguish the tasks in the pipeline and their impact on the schedules and deadlines of the project. Apart from this, you can also share this visual presentation with your team members and stakeholders. It a resourceful tool that can be incorporated into your business structure. Therefore, download and edit it conveniently to add the data and statistics as per your requirement.
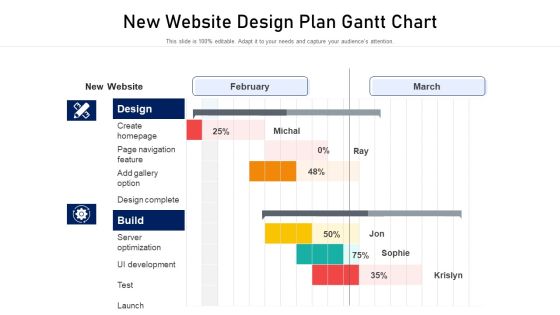
New Website Design Plan Gantt Chart Designs PDF
Your complex projects can be managed and organized simultaneously using this detailed new website design plan gantt chart designs pdf template. Track the milestones, tasks, phases, activities, and subtasks to get an updated visual of your project. Share your planning horizon and release plan with this well crafted presentation template. This exemplary template can be used to plot various dependencies to distinguish the tasks in the pipeline and their impact on the schedules and deadlines of the project. Apart from this, you can also share this visual presentation with your team members and stakeholders. It a resourceful tool that can be incorporated into your business structure. Therefore, download and edit it conveniently to add the data and statistics as per your requirement.
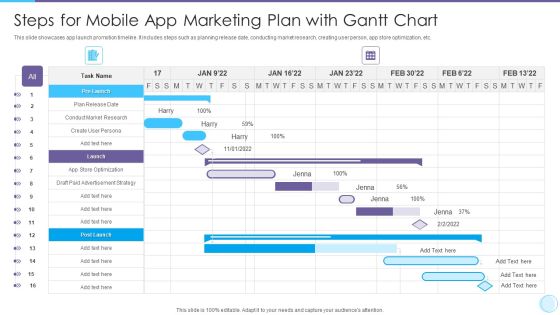
Steps For Mobile App Marketing Plan With Gantt Chart Rules PDF
Your complex projects can be managed and organized simultaneously using this detailed Steps For Mobile App Marketing Plan With Gantt Chart Rules PDF template. Track the milestones, tasks, phases, activities, and subtasks to get an updated visual of your project. Share your planning horizon and release plan with this well crafted presentation template. This exemplary template can be used to plot various dependencies to distinguish the tasks in the pipeline and their impact on the schedules and deadlines of the project. Apart from this, you can also share this visual presentation with your team members and stakeholders. It a resourceful tool that can be incorporated into your business structure. Therefore, download and edit it conveniently to add the data and statistics as per your requirement

Content Development Roadmap With Progress Gantt Chart Summary PDF
Your complex projects can be managed and organized simultaneously using this detailed Content Development Roadmap With Progress Gantt Chart Summary PDF template. Track the milestones, tasks, phases, activities, and subtasks to get an updated visual of your project. Share your planning horizon and release plan with this well crafted presentation template. This exemplary template can be used to plot various dependencies to distinguish the tasks in the pipeline and their impact on the schedules and deadlines of the project. Apart from this, you can also share this visual presentation with your team members and stakeholders. It a resourceful tool that can be incorporated into your business structure. Therefore, download and edit it conveniently to add the data and statistics as per your requirement.

Cross Functional Teams Collaboration Gantt Chart Of Project Status And Employee Formats PDF
Your complex projects can be managed and organized simultaneously using this detailed Cross Functional Teams Collaboration Gantt Chart Of Project Status And Employee Formats PDF template. Track the milestones, tasks, phases, activities, and subtasks to get an updated visual of your project. Share your planning horizon and release plan with this well crafted presentation template. This exemplary template can be used to plot various dependencies to distinguish the tasks in the pipeline and their impact on the schedules and deadlines of the project. Apart from this, you can also share this visual presentation with your team members and stakeholders. It a resourceful tool that can be incorporated into your business structure. Therefore, download and edit it conveniently to add the data and statistics as per your requirement.

Realization And Implement Ppt PowerPoint Presentation Inspiration Sample
This is a realization and implement ppt powerpoint presentation inspiration sample. This is a two stage process. The stages in this process are realization of target concept, creation of pilot system, implementation of training for users, improvements and adjustments in operations, adjustments in erp system.

Project Engagement And Assessment Gap Information PDF
This slide covers the gap between the project and the stakeholders including problems in stakeholders assessment and engagement process and also providing the solutions for the same.This is a project engagement and assessment gap information pdf template with various stages. Focus and dispense information on three stages using this creative set, that comes with editable features. It contains large content boxes to add your information on topics like lack of stakeholders control, lack of participation and engagement from, the communication plan needs to be built. You can also showcase facts, figures, and other relevant content using this PPT layout. Grab it now.

Robotic Process Automation Increased Revenue Through Digital Supply Chain Topics PDF
This slide covers the reasons for the increase revenue in business through digital supply chain such as marketing effectiveness, direct connection to customers etc. Present like a pro with Robotic Process Automation Increased Revenue Through Digital Supply Chain Topics PDF Create beautiful presentations together with your team, using our easy-to-use presentation slides. Share your ideas in real-time and make changes on the fly by downloading our templates. So whether youre in the office, on the go, or in a remote location, you can stay in sync with your team and present your ideas with confidence. With Slidegeeks presentation got a whole lot easier. Grab these presentations today.

Common Core Standards Initiative Ppt Slide
This is a common core standards initiative ppt slide. This is a three stage process. The stages in this process are business, marketing.

Common Core Standards Initiative Ppt Slides
This is a common core standards initiative ppt slides. This is a three stage process. The stages in this process are business, traffic lights.

Standard Statistical Attribution Model Ppt Sample File
This is a standard statistical attribution model ppt sample file. This is a five stage process. The stages in this process are display, seo, direct, social, natural search.

Standard Agile Roadmap Template Ppt Infographics
This is a standard agile roadmap template ppt infographics. This is a three stage process. The stages in this process are functionality, product, planters punch.
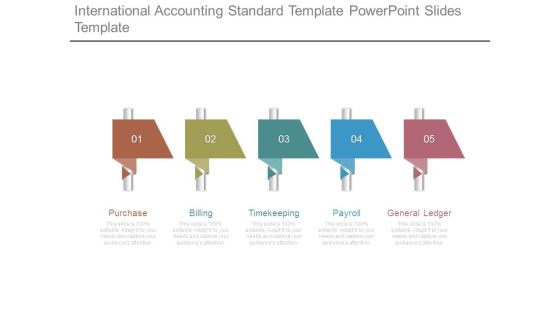
International Accounting Standard Template Powerpoint Slides Template
This is a international accounting standard template powerpoint slides template. This is a five stage process. The stages in this process are purchase, billing, timekeeping, payroll, general ledger.
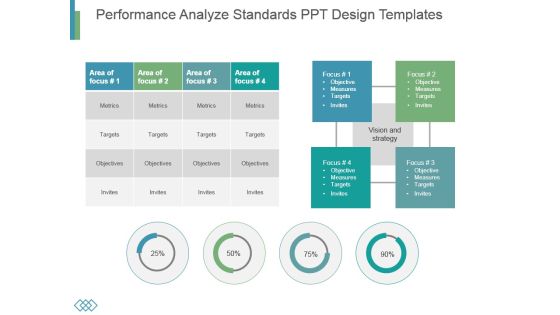
Performance Analyze Standards Ppt Design Templates
This is a performance analyze standards ppt design templates. This is a four stage process. The stages in this process are metrics, targets, objectives, invites.

3d Linear Flow 2 Stages Home Electrical Wiring PowerPoint Templates
We present our 3d linear flow 2 stages home electrical wiring PowerPoint templates. Use our Arrows PowerPoint Templates because; you have the basic goal in mind. Use our Marketing PowerPoint Templates because; Use them to your advantage to priorities your ideas. Use our Success PowerPoint Templates because, you have made significant headway in this field. Use our Process and Flows PowerPoint Templates because, you have some excellent plans to spread some more of it across your community. Use our Business PowerPoint Templates because, you have the people in place, selected the team leaders and all are raring to go. Use these PowerPoint slides for presentations relating to Algorithm, Arrow, Arrows Block, Business, Chart, Connection, Design, Development, Diagram, Direction, Element, Flow, Flowchart, Graph, Kind, Linear, Management, Organization, Process, Program, Section, Segment, Set, Sign, Solution, Strategy, Symbol. The prominent colors used in the PowerPoint template are Red, Orange, and Black

Highlighting The HR Challenges Faced By Hospitals And Various Solutions To Overcome Portrait PDF
The following slide showcases the different types of human resource HR challenges which are faced by the healthcare industry. Managing patient dissatisfaction, welcoming new technology and training and development are the key challenges which are mentioned in the slide along with multiple solutions to overcome them. Find highly impressive Highlighting The HR Challenges Faced By Hospitals And Various Solutions To Overcome Portrait PDF on Slidegeeks to deliver a meaningful presentation. You can save an ample amount of time using these presentation templates. No need to worry to prepare everything from scratch because Slidegeeks experts have already done a huge research and work for you. You need to download Highlighting The HR Challenges Faced By Hospitals And Various Solutions To Overcome Portrait PDF for your upcoming presentation. All the presentation templates are 100 percent editable and you can change the color and personalize the content accordingly. Download now.

Digitalization Of Service Desk Action Plan To Handle Numerous Types Of Service Desk Tickets Ppt Portfolio Gallery PDF
This slide illustrates action plan to manage multiple types of service desk tickets. It provides information about service request, incident, problem and change request tickets along with software, hardware, service agent, etc. Boost your pitch with our creative Digitalization Of Service Desk Action Plan To Handle Numerous Types Of Service Desk Tickets Ppt Portfolio Gallery PDF. Deliver an awe-inspiring pitch that will mesmerize everyone. Using these presentation templates you will surely catch everyones attention. You can browse the ppts collection on our website. We have researchers who are experts at creating the right content for the templates. So you do not have to invest time in any additional work. Just grab the template now and use them.
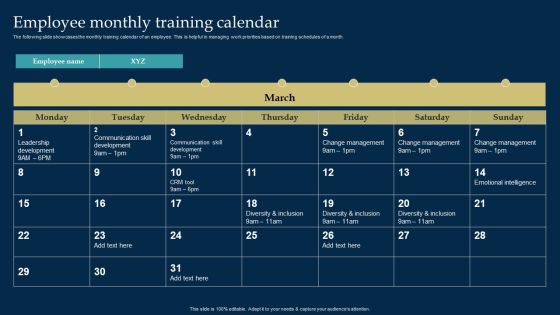
Employee Training And Development Strategy Employee Monthly Training Calendar Demonstration PDF
The following slide showcases the monthly training calendar of an employee. This is helpful in managing work priorities based on training schedules of a month. This Employee Training And Development Strategy Employee Monthly Training Calendar Demonstration PDF from Slidegeeks makes it easy to present information on your topic with precision. It provides customization options, so you can make changes to the colors, design, graphics, or any other component to create a unique layout. It is also available for immediate download, so you can begin using it right away. Slidegeeks has done good research to ensure that you have everything you need to make your presentation stand out. Make a name out there for a brilliant performance.

Prevention Of Information How To Overcome The Security Awareness Training Introduction PDF
The purpose of this is to highlight various solutions which can be used to overcome the cyber security awareness challenges. The key solutions covered in the slide are introducing dynamic courses, fully managed training. If you are looking for a format to display your unique thoughts, then the professionally designed Prevention Of Information How To Overcome The Security Awareness Training Introduction PDF is the one for you. You can use it as a Google Slides template or a PowerPoint template. Incorporate impressive visuals, symbols, images, and other charts. Modify or reorganize the text boxes as you desire. Experiment with shade schemes and font pairings. Alter, share or cooperate with other people on your work. Download Prevention Of Information How To Overcome The Security Awareness Training Introduction PDF and find out how to give a successful presentation. Present a perfect display to your team and make your presentation unforgettable.


 Continue with Email

 Home
Home


