Continuum Graphic

Supply Chain Management Integrated Structure Ppt Styles Graphics Tutorials PDF
This slide showcases the continuous process of supply chain management where manufacturers, suppliers and customers works together as whole system to optimize efficient logistic operations. The key elements of framework includes supplier, internal and customer integration. Presenting Supply Chain Management Integrated Structure Ppt Styles Graphics Tutorials PDF to dispense important information. This template comprises three stages. It also presents valuable insights into the topics including Supplier Integration, Internal Integration, Customer Integration. This is a completely customizable PowerPoint theme that can be put to use immediately. So, download it and address the topic impactfully.

Project Implementation Action Plan With Monitoring And Controlling Graphics PDF
This template covers execution plan for project which includes new project initiatives, planning, executing with continuously monitoring and controlling Persuade your audience using this project implementation action plan with monitoring and controlling graphics pdf. This PPT design covers five stages, thus making it a great tool to use. It also caters to a variety of topics including initiating, planning, executing, monitoring and controlling, closing. Download this PPT design now to present a convincing pitch that not only emphasizes the topic but also showcases your presentation skills.
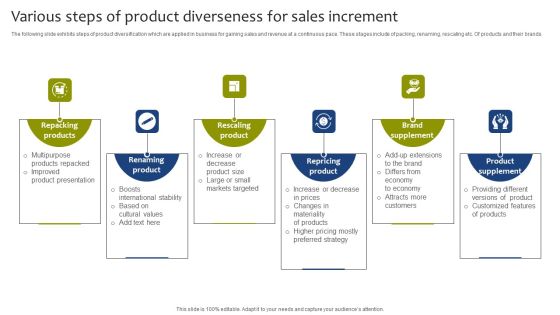
Various Steps Of Product Diverseness For Sales Increment Graphics PDF
The following slide exhibits steps of product diversification which are applied in business for gaining sales and revenue at a continuous pace. These stages include of packing, renaming, rescaling etc. Of products and their brands. Presenting Various Steps Of Product Diverseness For Sales Increment Graphics PDF to dispense important information. This template comprises Six stages. It also presents valuable insights into the topics including Repacking Products, Renaming Product, Rescaling Product. This is a completely customizable PowerPoint theme that can be put to use immediately. So, download it and address the topic impactfully.

Major Metrics To Test Strategic Partnership And Alliances Graphics PDF
This slide illustrates measures for an organization firm to continually test against for checking the strength of business partnerships. It includes strategic synergy, ambition alignment, materiality, etc. Persuade your audience using this Major Metrics To Test Strategic Partnership And Alliances Graphics PDF. This PPT design covers five stages, thus making it a great tool to use. It also caters to a variety of topics including Strategic Synergy, Ambition Alignment, Materiality. Download this PPT design now to present a convincing pitch that not only emphasizes the topic but also showcases your presentation skills.
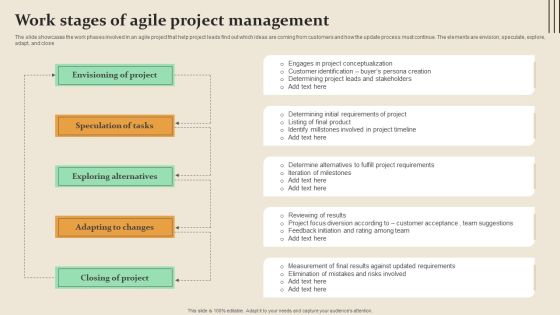
Work Stages Of Agile Project Management Graphics PDF
The slide showcases the work phases involved in an agile project that help project leads find out which ideas are coming from customers and how the update process must continue. The elements are envision, speculate, explore, adapt, and close. Persuade your audience using this Work Stages Of Agile Project Management Graphics PDF. This PPT design covers five stages, thus making it a great tool to use. It also caters to a variety of topics including Envisioning Project, Speculation Tasks, Exploring Alternatives. Download this PPT design now to present a convincing pitch that not only emphasizes the topic but also showcases your presentation skills.

Customer Business Service Value Management Timeline Graphics PDF
The slide shows a service management roadmap to improve customer satisfaction and enhance service value. It includes key components such as define consumer value, plan and develop services, run services, improve services and deliver customer value. Persuade your audience using this Customer Business Service Value Management Timeline Graphics PDF. This PPT design covers five stages, thus making it a great tool to use. It also caters to a variety of topics including Continuous Improvement, Increase Transparency, Develop Our Services. Download this PPT design now to present a convincing pitch that not only emphasizes the topic but also showcases your presentation skills.
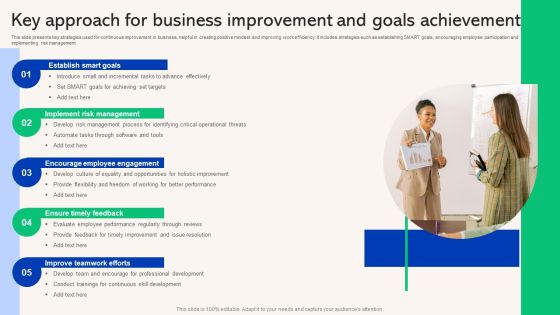
Key Approach For Business Improvement And Goals Achievement Graphics PDF
This slide presents key strategies used for continuous improvement in business, helpful in creating positive mindset and improving work efficiency. It includes strategies such as establishing SMART goals, encouraging employee participation and implementing risk management. Persuade your audience using this Key Approach For Business Improvement And Goals Achievement Graphics PDF. This PPT design covers five stages, thus making it a great tool to use. It also caters to a variety of topics including Encourage Employee Engagement, Ensure Timely Feedback, Improve Teamwork Efforts. Download this PPT design now to present a convincing pitch that not only emphasizes the topic but also showcases your presentation skills.

Business Improvement Approach Timeline For Organisational Development Graphics PDF
This slide presents continuous improvement strategy for organisational development, helpful in planning out tasks and activities in strategic way to accomplish future goals. It includes action plan with tasks spread over monthly schedule with responsibility allocation. Showcasing this set of slides titled Business Improvement Approach Timeline For Organisational Development Graphics PDF. The topics addressed in these templates are Organisational Goals Achievement, Evaluate Customer Feedback, Goals And Communicate. All the content presented in this PPT design is completely editable. Download it and make adjustments in color, background, font etc. as per your unique business setting.

3d Graphical Enlightenment Using 8 Stages Ppt Schematic PowerPoint Slides
We present our 3d graphical enlightenment using 8 stages ppt schematic PowerPoint Slides. Use our Marketing PowerPoint Templates because, you have churned your mind and come up with effective ways and means to further refine it. Use our Shapes PowerPoint Templates because, Our PowerPoint templates give this step by step process to achieve the aim. Use our Business PowerPoint Templates because, expand on your plans to overcome such obstacles and reassure the team that they shall continue to roll along merrily. Use our Process and Flows PowerPoint Templates because, Team Efforts Business Template:- The concept and strategy is your strength. Use our Arrows PowerPoint Templates because, Listen to ideas and thoughts. Use these PowerPoint slides for presentations relating to 3d, arrow, background, bullet, business, chart, checkmark, chevron, diagram, drop, financial, five, glass, graphic, gray, icon, illustration, management, point, process, project, reflection, set, shadow, stage, text, transparency, vector, white. The prominent colors used in the PowerPoint template are Brown, Gray, and Black

Year 2018 Circle Calendar Ppt Powerpoint Presentation Layouts Graphics
This is a year 2018 circle calendar ppt powerpoint presentation layouts graphics. This is a twelve stage process. The stages in this process are circular calendar, circle calendar, cyclic calendar.

Strategy Plan For Digital Marketing Powerpoint Slide Graphics
This is a strategy plan for digital marketing powerpoint slide graphics. This is a five stage process. The stages in this process are presence, influences, perception, vitality, resonance.

Route To Market Sales Ppt PowerPoint Presentation Graphics
This is a route to market sales ppt powerpoint presentation graphics. This is a five stage process. The stages in this process are markets, sales, business, process, management.

Customer Is The Focus Ppt PowerPoint Presentation Graphics
This is a customer is the focus ppt powerpoint presentation graphics. This is a five stage process. The stages in this process are strategy, people, systems, process, structure.

Customer Loyalty Lifecycle Ppt PowerPoint Presentation Professional Graphics
This is a customer loyalty lifecycle ppt powerpoint presentation professional graphics. This is a seven stage process. The stages in this process are attract, engage, grow, retain, loyalty.

Account Payable Management Ppt PowerPoint Presentation Pictures Graphics
This is a account payable management ppt powerpoint presentation pictures graphics. This is a three stage process. The stages in this process are account payable management.

Protect Financial Data Online Ppt PowerPoint Presentation Ideas Graphics
This is a protect financial data online ppt powerpoint presentation ideas graphics. This is a five stage process. The stages in this process are protect financial data online.

Sales Navigator Pricing Ppt Powerpoint Presentation Layouts Graphics
This is a sales navigator pricing ppt powerpoint presentation layouts graphics. This is a four stage process. The stages in this process are sales navigator pricing.
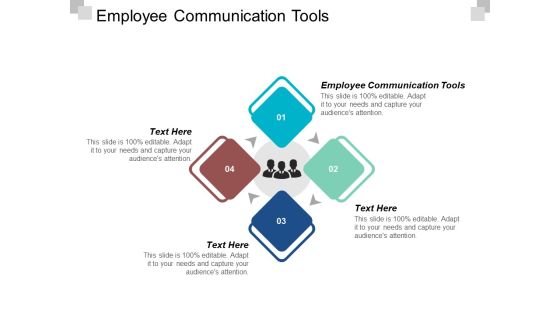
Employee Communication Tools Ppt PowerPoint Presentation Summary Graphics
This is a employee communication tools ppt powerpoint presentation summary graphics. This is a four stage process. The stages in this process are employee communication tools.
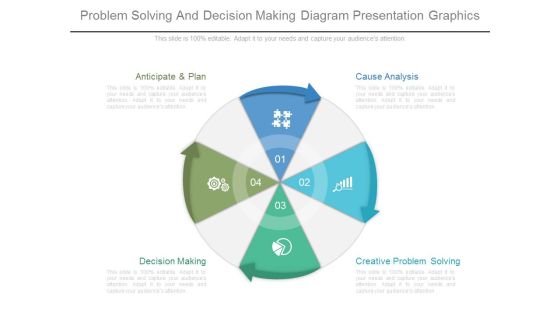
Problem Solving And Decision Making Diagram Presentation Graphics
This is a problem solving and decision making diagram presentation graphics. This is a four stage process. The stages in this process are anticipate and plan, decision making, creative problem solving, cause analysis.
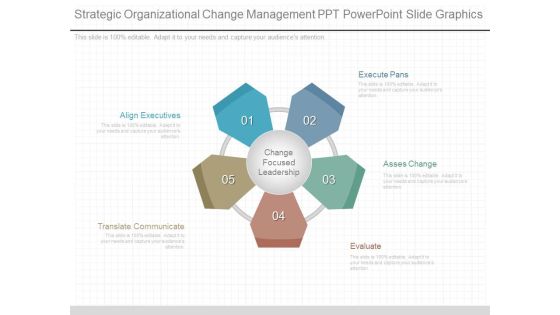
Strategic Organizational Change Management Ppt Powerpoint Slide Graphics
This is a strategic organizational change management ppt powerpoint slide graphics. This is a five stage process. The stages in this process are execute pans, asses change, evaluate, translate communicate, align executives, change focused leadership.
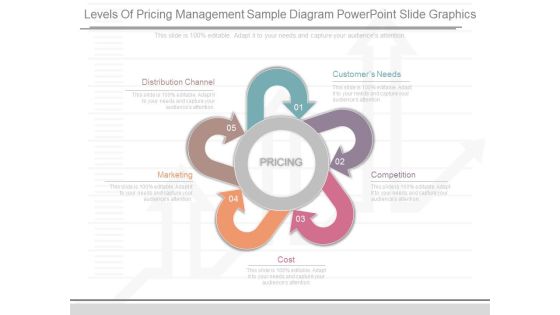
Levels Of Pricing Management Sample Diagram Powerpoint Slide Graphics
This is a levels of pricing management sample diagram powerpoint slide graphics. This is a five stage process. The stages in this process are customers needs, competition, cost, marketing, distribution channel.
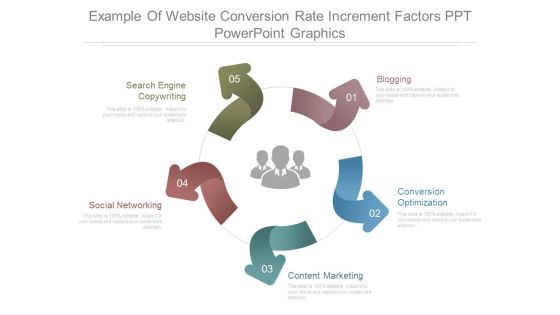
Example Of Website Conversion Rate Increment Factors Ppt Powerpoint Graphics
This is a example of website conversion rate increment factors ppt powerpoint graphics. This is a five stage process. The stages in this process are search engine copywriting, blogging, conversion optimization, content marketing, social networking.

Bi With Big Data Technology Ppt Presentation Graphics
This is a bi with big data technology ppt presentation graphics. This is a six stage process. The stages in this process are listen, learn, correct, look, correct, predict.

Factors That Affect Investment Outcome Ppt Powerpoint Graphics
This is a factors that affect investment outcome ppt powerpoint graphics. This is a four stage process. The stages in this process are your objective, your risk tolerance, your time horizon, alternative strategies, diversification, maximize tax efficiency, sector rotation.

An Awesome Pitch For New Business Powerpoint Graphics
This is a an awesome pitch for new business powerpoint graphics. This is a ten stage process. The stages in this process are the problem, proprietary tech, elevator pitch, competition, marketing plan, business model, money, market size, the solution, team.

10 Slides To An Awesome Pitch Ppt PowerPoint Presentation Graphics
This is a 10 slides to an awesome pitch ppt powerpoint presentation graphics. This is a ten stage process. The stages in this process are business model, money, market size, the solution, team, marketing plan, competition, elevator pitch.

Competitive And Market Analysis Ppt PowerPoint Presentation Graphics
This is a competitive and market analysis ppt powerpoint presentation graphics. This is a seven stage process. The stages in this process are market analysis, market size, market segments, customer mix, market share.

Best Time To Send Emails Ppt Powerpoint Presentation Slides Graphics
This is a best time to send emails ppt powerpoint presentation slides graphics. This is a six stage process. The stages in this process are transaction rate, response rates were highest at night and early in the morning.
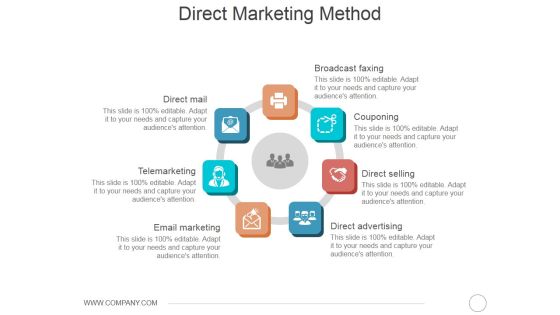
Direct Marketing Method Ppt PowerPoint Presentation Summary Graphics
This is a direct marketing method ppt powerpoint presentation summary graphics. This is a seven stage process. The stages in this process are broadcast faxing, couponing, direct selling, direct advertising, direct mail, telemarketing, email marketing.
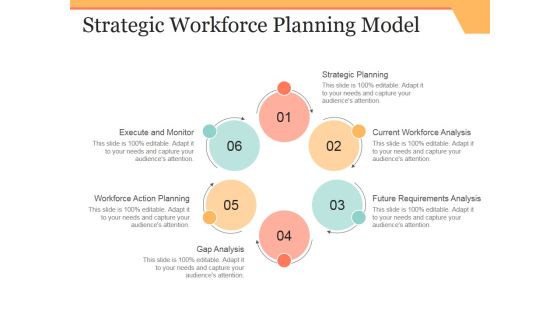
Strategic Workforce Planning Model Ppt PowerPoint Presentation Show Graphics
This is a strategic workforce planning model ppt powerpoint presentation show graphics. This is a six stage process. The stages in this process are strategic planning, current workforce analysis, future requirements analysis, gap analysis, workforce action planning, execute and monitor.

Core Values Template 2 Ppt PowerPoint Presentation Gallery Graphics
This is a core values template 2 ppt powerpoint presentation gallery graphics. This is a six stage process. The stages in this process are excellence, integrity, progressive, passionate, collaborative, respect.

Tips For Selecting Erp System Ppt PowerPoint Presentation Infographics Graphics
This is a tips for selecting erp system ppt powerpoint presentation infographics graphics. This is a six stage process. The stages in this process are cost planning, erp industry solutions, requirement analysis, usability requirements, versatility and expandability.

Consumer Insight Capabilities Ppt PowerPoint Presentation Icon Graphics
This is a consumer insight capabilities ppt powerpoint presentation icon graphics. This is a six stage process. The stages in this process are business support services, business intelligence services, research services, data management services, insight services.

Economic Growth Stages Marketing Strategy Ppt PowerPoint Presentation Outline Graphics
This is a economic growth stages marketing strategy ppt powerpoint presentation outline graphics. This is a five stage process. The stages in this process are economic growth stages, marketing strategy.
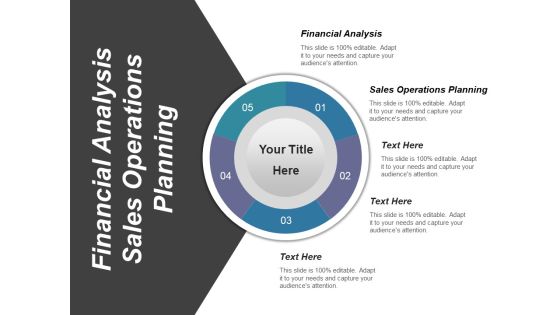
Financial Analysis Sales Operations Planning Ppt PowerPoint Presentation Outline Graphics
This is a financial analysis sales operations planning ppt powerpoint presentation outline graphics. This is a five stage process. The stages in this process are financial, analysis, sales, operations, planning.

People Process Technology Management Ppt PowerPoint Presentation Inspiration Graphics
This is a people process technology management ppt powerpoint presentation inspiration graphics. This is a three stage process. The stages in this process are process, technology, people, business, marketing.
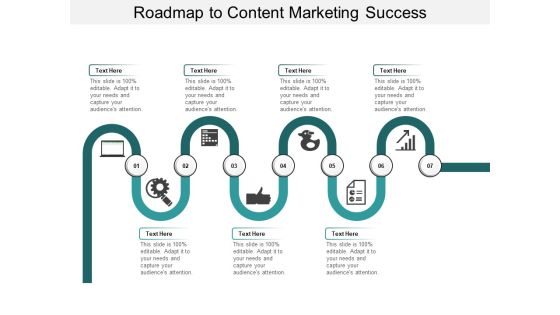
Roadmap To Content Marketing Success Ppt PowerPoint Presentation Model Graphics
This is a roadmap to content marketing success ppt powerpoint presentation model graphics. This is a seven stage process. The stages in this process are b2b marketing strategy, b2b marketing plan, b2b marketing approach.
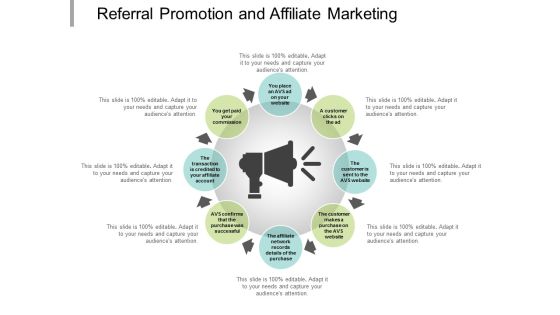
Referral Promotion And Affiliate Marketing Ppt Powerpoint Presentation Summary Graphics
This is a referral promotion and affiliate marketing ppt powerpoint presentation summary graphics. This is a eight stage process. The stages in this process are referral marketing, business referrals promoting products.
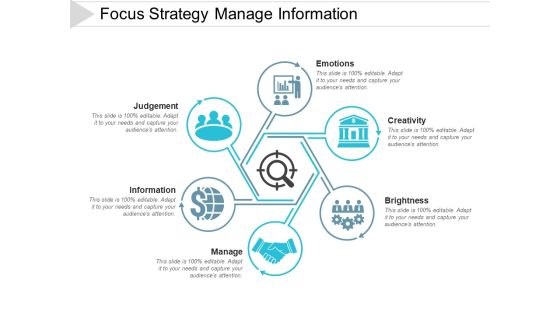
Focus Strategy Manage Information Ppt PowerPoint Presentation Styles Graphics
This is a focus strategy manage information ppt powerpoint presentation styles graphics. This is a six stage process. The stages in this process are strategic management, strategic planning, strategic focus.
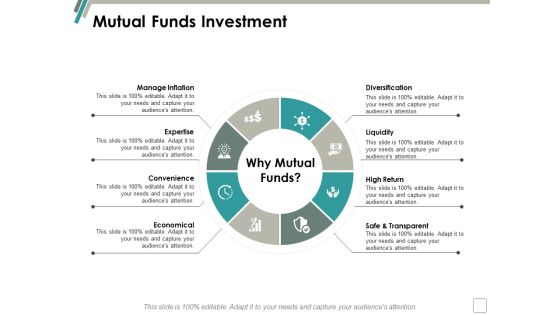
Mutual Funds Investment Ppt Powerpoint Presentation Slides Graphics
This is a mutual funds investment ppt powerpoint presentation slides graphics. This is a eight stage process. The stages in this process are expertise, economical, convenience, liquidity, manage inflation.

capital structure and dividend policy ppt powerpoint presentation icon graphics
This is a capital structure and dividend policy ppt powerpoint presentation icon graphics. This is a three stage process. The stages in this process are capital structure, cost of capital, leverage analysis, business, planning.

Initiatives To Create Values Driven Culture For People Graphics PDF
This slide coves key initiatives by KPMG to develop values based on culture for people. The purpose of this template is to provide an overview on top initiatives, action steps and impact of KPMG to create a healthy environment. It includes initiatives such as inclusion, diversity and equity, health and well being and continuous learning with key steps taken and outcomes. Slidegeeks is here to make your presentations a breeze with Initiatives To Create Values Driven Culture For People Graphics PDF With our easy-to-use and customizable templates, you can focus on delivering your ideas rather than worrying about formatting. With a variety of designs to choose from, you are sure to find one that suits your needs. And with animations and unique photos, illustrations, and fonts, you can make your presentation pop. So whether you are giving a sales pitch or presenting to the board, make sure to check out Slidegeeks first
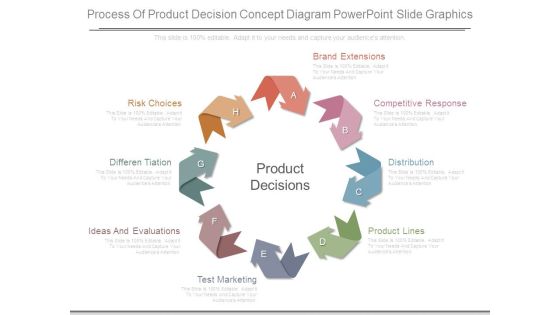
Process Of Product Decision Concept Diagram Powerpoint Slide Graphics
This is a process of product decision concept diagram powerpoint slide graphics. This is a eight stage process. The stages in this process are product decisions, brand extensions, competitive response, distribution, product lines, test marketing, ideas and evaluations, differentiation, risk choices.

Factors That Affect Market Segmentation Ppt PowerPoint Presentation Graphics
This is a factors that affect market segmentation ppt powerpoint presentation graphics. This is a four stage process. The stages in this process are factors that affect market segmentation, clear identification of the segment, accessibility through promotional efforts, measurability of its effective size, appropriateness to the policies and resources of the company.

Advertising Revenue Model Ppt PowerPoint Presentation Summary Graphics
Presenting this set of slides with name advertising revenue model ppt powerpoint presentation summary graphics. This is a four stage process. The stages in this process are business, content, media, revenue, management. This is a completely editable PowerPoint presentation and is available for immediate download. Download now and impress your audience.

Annual Cycle With Four Seasons Ppt PowerPoint Presentation Slides Graphics
Presenting this set of slides with name annual cycle with four seasons ppt powerpoint presentation slides graphics. This is a four stage process. The stages in this process are year wheel, annual wheel, 12 months wheel. This is a completely editable PowerPoint presentation and is available for immediate download. Download now and impress your audience.
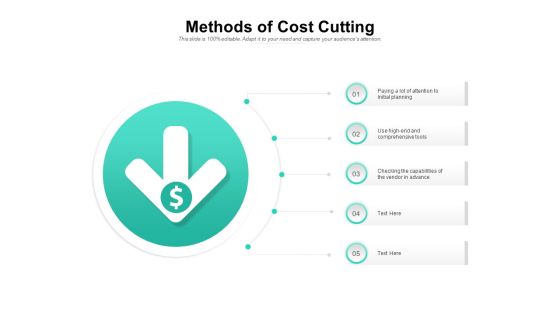
Methods Of Cost Cutting Ppt PowerPoint Presentation Styles Graphics
Presenting this set of slides with name methods of cost cutting ppt powerpoint presentation styles graphics. This is a five stage process. The stages in this process are paying a lot of attention to initial planning, use high end and comprehensive tools, checking the capabilities of the vendor in advance. This is a completely editable PowerPoint presentation and is available for immediate download. Download now and impress your audience.

Graphical Arrows 8 Issues Business Process Flowchart PowerPoint Templates
We present our graphical arrows 8 issues business process flowchart PowerPoint templates. Use our Marketing PowerPoint Templates because, illustrate the means to prevent or control them using our imaginative templates. Use our Arrows PowerPoint Templates because, Business 3D Circular Puzzle:- Your business and plans for its growth consist of processes that are highly co-related. Use our Business PowerPoint Templates because, Business Process Design:- The template offers an excellent background to build up the various stages of your business process. Use our Process and Flows PowerPoint Templates because, If making a mark is your obsession,. Use our Leadership PowerPoint Templates because, you have good reasons to back up the strength of your belief. Use these PowerPoint slides for presentations relating to Advertising, arrow, background, banner, bookmark, card, choice, concept, creative, design, direction, flow, idea, illustration, info graphic, instruction, label, layout, marketing, modern, next, options, process, product, promotion, sequence, simple, step, symbol, template, triangle. The prominent colors used in the PowerPoint template are Blue, Gray, and White

Business Promotion Channels Ppt PowerPoint Presentation Professional Graphics Download
This is a business promotion channels ppt powerpoint presentation visual aids styles. This is a five stage process. The stages in this process are marketing, business, management, planning, strategy.
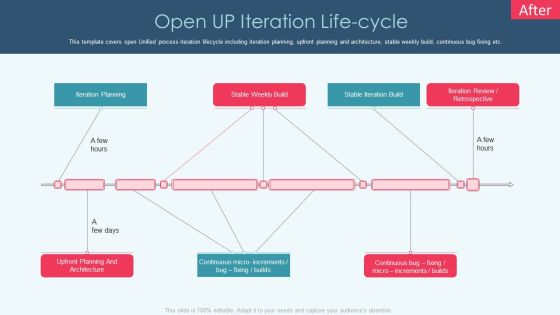
Openup Methodology IT Open Up Iteration Life Cycle Graphics PDF
This template covers open Unified process iteration lifecycle including iteration planning, upfront planning and architecture, stable weekly build, continuous bug fixing etc. Deliver an awe inspiring pitch with this creative openup methodology it open unified process phases template structure pdf bundle. Topics like iteration planning, stable weekly build, stable iteration build can be discussed with this completely editable template. It is available for immediate download depending on the needs and requirements of the user.

5 Year Project Timeline Business Plan PowerPoint Templates Ppt Slides Graphics
We present our 5 year project timeline Business Plan PowerPoint Templates PPT Slides Graphics.Present our Marketing PowerPoint Templates because The marketplace is the merger of your dreams and your ability. Use our Time planning PowerPoint Templates because you can Focus on each one and investigate which one would be the best fit for your needs. Download and present our Timelines PowerPoint Templates because there are different paths to gain the necessary knowledge to acheive it. Use our Arrows PowerPoint Templates because using this Ideas will roll along in your mind like billiard balls. Present our Business PowerPoint Templates because you have analysed many global markets and come up with possibilities. Highlight the pros and cons of other likely business oppurtunities.Use these PowerPoint slides for presentations relating to Art, Background, Button, Call, City, Colorful, Concept, Country, Destination, Editable, Flag, Fuel, Geography, Graphic, Home, Icon, Illustration, Journey, Land, Locate, Location, Macro, Map, Mapping, Mark, Navigate, Needle, Petrol, Pin, Pinpoint, Place, Pointing, Pump, Push, Pushpin, Restaurant, Road, Roadmap, Service, Set, Shiny, Space, Symbol, Town, Travel, Trip. The prominent colors used in the PowerPoint template are Red, Green, Blue. You can be sure our 5 year project timeline Business Plan PowerPoint Templates PPT Slides Graphics are Dazzling. You can be sure our City PowerPoint templates and PPT Slides are Enchanting. Professionals tell us our 5 year project timeline Business Plan PowerPoint Templates PPT Slides Graphics will help you be quick off the draw. Just enter your specific text and see your points hit home. Use our Button PowerPoint templates and PPT Slides are incredible easy to use. Use our 5 year project timeline Business Plan PowerPoint Templates PPT Slides Graphics are Adorable. Use our Call PowerPoint templates and PPT Slides will impress their bosses and teams.

Business Continuity Management Strategy Ppt PowerPoint Presentation Icon Graphics Pictures Cpb
Presenting this set of slides with name business continuity management strategy ppt powerpoint presentation icon graphics pictures cpb. This is an editable Powerpoint eight stages graphic that deals with topics like eight to help convey your message better graphically. This product is a premium product available for immediate download and is 100 percent editable in Powerpoint. Download this now and use it in your presentations to impress your audience.
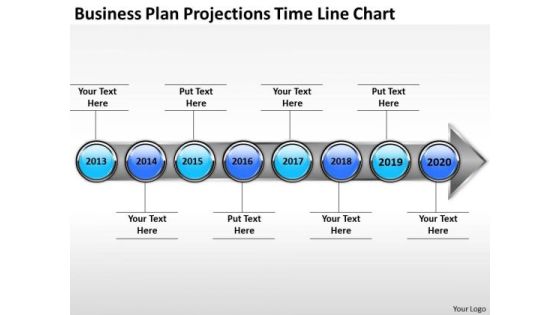
Business Plan Projections Time Line Chart PowerPoint Templates Ppt Slides Graphics
We present our Business Plan Projections Time Line Chart PowerPoint Templates PPT Slides Graphics.Present our Marketing PowerPoint Templates because The marketplace is the merger of your dreams and your ability. Present our Time planning PowerPoint Templates because they are truly some of the wonders of our life. Use our Timelines PowerPoint Templates because you can Churn the wheels of the brains of your colleagues. Download and present our Arrows PowerPoint Templates because this Slide offers an excellent background to build up the various stages of your business process. Download and present our Business PowerPoint Templates because the majestic tiger lord of all it surveys.It exudes power even when it is in repose.Use these PowerPoint slides for presentations relating to Art, Background, Button, Call, City, Colorful, Concept, Country, Destination, Editable, Flag, Fuel, Geography, Graphic, Home, Icon, Illustration, Journey, Land, Locate, Location, Macro, Map, Mapping, Mark, Navigate, Needle, Petrol, Pin, Pinpoint, Place, Pointing, Pump, Push, Pushpin, Restaurant, Road, Roadmap, Service, Set, Shiny, Space, Symbol, Town, Travel, Trip. The prominent colors used in the PowerPoint template are Blue, Blue light, Gray. You can be sure our Business Plan Projections Time Line Chart PowerPoint Templates PPT Slides Graphics are Adorable. You can be sure our Concept PowerPoint templates and PPT Slides are Functional. Professionals tell us our Business Plan Projections Time Line Chart PowerPoint Templates PPT Slides Graphics are visually appealing. Use our Concept PowerPoint templates and PPT Slides have awesome images to get your point across. Use our Business Plan Projections Time Line Chart PowerPoint Templates PPT Slides Graphics are Glamorous. Use our Button PowerPoint templates and PPT Slides are Charming.

Circular Process For Continuous Improvement Ppt PowerPoint Presentation Gallery Graphics PDF
Presenting this set of slides with name circular process for continuous improvement ppt powerpoint presentation gallery graphics pdf. This is a six stage process. The stages in this process are circular process for continuous improvement. This is a completely editable PowerPoint presentation and is available for immediate download. Download now and impress your audience.
Six Steps Of Continuous Process Improvement Ppt Powerpoint Presentation Infographic Template Graphics Design
This is a six steps of continuous process improvement ppt powerpoint presentation infographic template graphics design. This is a six stage process. The stages in this process are 6 circular arrows, 6 cyclic arrows, six circular arrows.

business continuity disaster recovery plan ppt powerpoint presentation slides graphics example cpb
Presenting this set of slides with name business continuity disaster recovery plan ppt powerpoint presentation slides graphics example cpb. This is an editable Powerpoint four stages graphic that deals with topics like business continuity disaster recovery plan to help convey your message better graphically. This product is a premium product available for immediate download and is 100 percent editable in Powerpoint. Download this now and use it in your presentations to impress your audience.
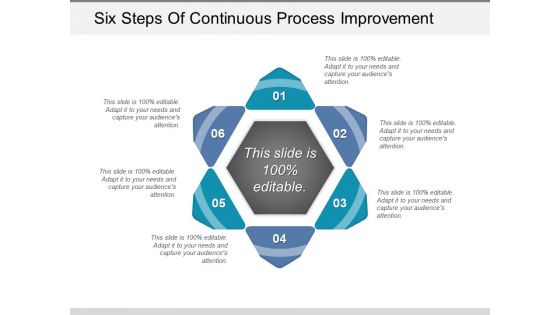
Six Steps Of Continuous Process Improvement Ppt PowerPoint Presentation Summary Graphics Example
This is a six steps of continuous process improvement ppt powerpoint presentation summary graphics example. This is a six stage process. The stages in this process are 6 circular arrows, 6 circle arrows, 6 cycle arrows.

Business Continuity Market Size Ppt Powerpoint Presentation File Graphics Tutorials Cpb
This is a business continuity market size ppt powerpoint presentation file graphics tutorials cpb. This is a three stage process. The stages in this process are business continuity market size.
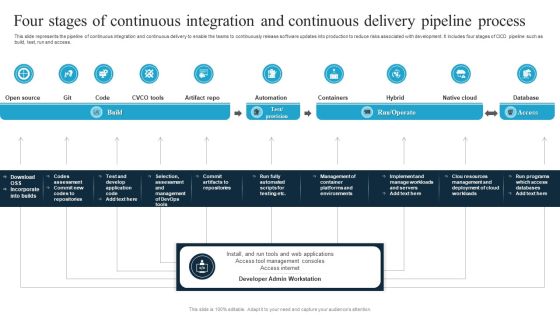
Four Stages Of Continuous Integration And Continuous Delivery Pipeline Process Graphics PDF
This slide represents the pipeline of continuous integration and continuous delivery to enable the teams to continuously release software updates into production to reduce risks associated with development. It includes four stages of CICD pipeline such as build, test, run and access. Pitch your topic with ease and precision using this Four Stages Of Continuous Integration And Continuous Delivery Pipeline Process Graphics PDF. This layout presents information on Build, Run Operate, Access. It is also available for immediate download and adjustment. So, changes can be made in the color, design, graphics or any other component to create a unique layout.
Duty List Graphics For Business Continuity Planning Life Cycle Ppt PowerPoint Presentation Infographics Inspiration PDF
Persuade your audience using this duty list graphics for business continuity planning life cycle ppt powerpoint presentation infographics inspiration pdf. This PPT design covers eight stages, thus making it a great tool to use. It also caters to a variety of topics including duty list graphics for business continuity planning life cycle Download this PPT design now to present a convincing pitch that not only emphasizes the topic but also showcases your presentation skills.

 Home
Home