AI PPT Maker
Templates
PPT Bundles
Design Services
Business PPTs
Business Plan
Management
Strategy
Introduction PPT
Roadmap
Self Introduction
Timelines
Process
Marketing
Agenda
Technology
Medical
Startup Business Plan
Cyber Security
Dashboards
SWOT
Proposals
Education
Pitch Deck
Digital Marketing
KPIs
Project Management
Product Management
Artificial Intelligence
Target Market
Communication
Supply Chain
Google Slides
Research Services
 One Pagers
All Categories
-
Home
- Customer Favorites
- Continuous Improvement Plan
Continuous Improvement Plan
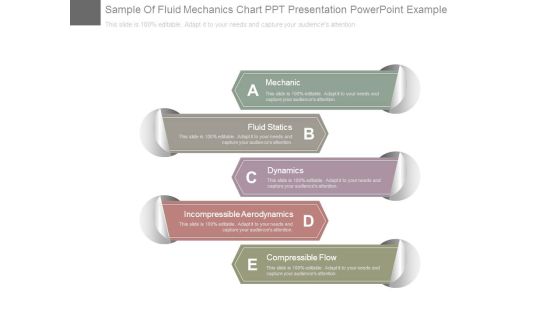
Sample Of Fluid Mechanics Chart Ppt Presentation Powerpoint Example
This is a sample of fluid mechanics chart ppt presentation powerpoint example. This is a five stage process. The stages in this process are mechanic, fluid statics, dynamics, incompressible aerodynamics, compressible flow.
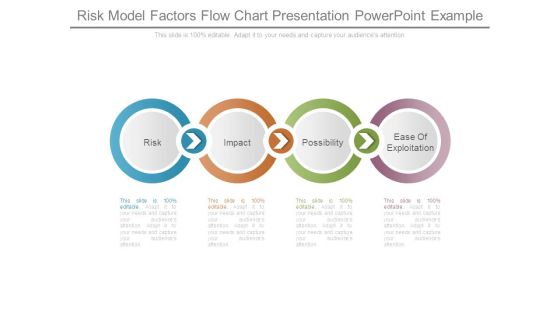
Risk Model Factors Flow Chart Presentation Powerpoint Example
This is a risk model factors flow chart presentation powerpoint example. This is a four stage process. The stages in this process are risk, impact, possibility, ease of exploitation.

Marketing Org Chart Example Powerpoint Slide Design Ideas
This is a marketing org chart example powerpoint slide design ideas. This is a four stage process. The stages in this process are strategic marketing, product marketing, interactive marketing, marketing organization.
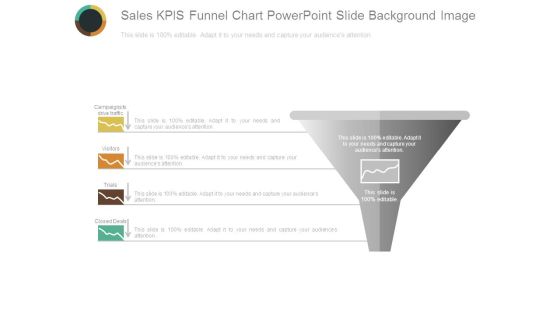
Sales Kpis Funnel Chart Powerpoint Slide Background Image
This is a sales kpis funnel chart powerpoint slide background image. This is a one stage process. The stages in this process are campaigns to drive traffic, visitors, trials, closed deals, sales.

Break Point Chart For Quality Analysis Powerpoint Slide Show
This is a break point chart for quality analysis powerpoint slide show. This is a one stage process. The stages in this process are total variable costs, fixed costs, quality sold.
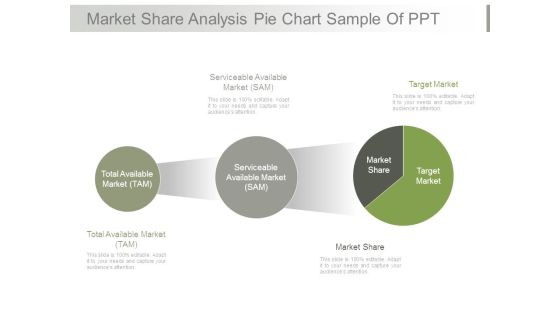
Market Share Analysis Pie Chart Sample Of Ppt
This is a market share analysis pie chart sample of ppt. This is a three stage process. The stages in this process are serviceable available market sam, target market, total available market tam, market share.

Cost Benefit Analysis Chart With Icons Powerpoint Layout
This is a cost benefit analysis chart with icons powerpoint layout. This is a two stage process. The stages in this process are balance scale, compare, business, marketing, management.

Approaches Of Market Targeting Chart Ppt Images Gallery
This is a approaches of market targeting chart ppt images gallery. This is a three stage process. The stages in this process are undifferentiated approaches, differentiated approaches, concentrated approaches.
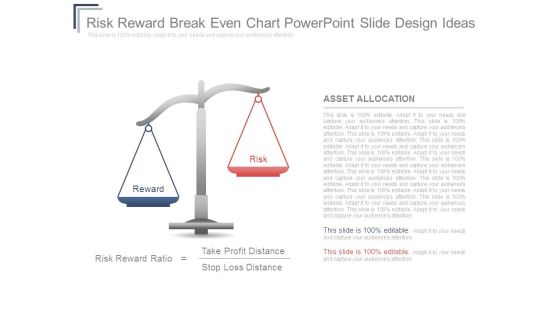
Risk Reward Breakeven Chart Powerpoint Slide Design Ideas
This is a risk reward breakeven chart powerpoint slide design ideas. This is a two stage process. The stages in this process are reward, risk, asset allocation, risk reward ratio, take profit distance, stop loss distance.
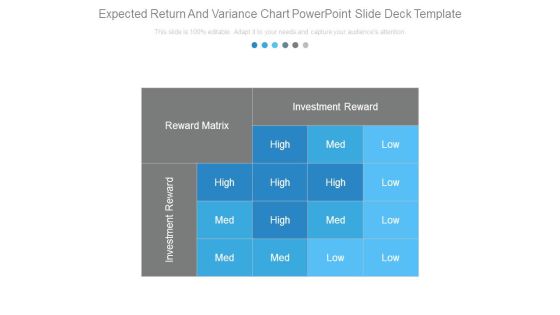
Expected Return And Variance Chart Powerpoint Slide Deck Template
This is a expected return and variance chart powerpoint slide deck template. This is a one stage process. The stages in this process are investment reward, reward matrix, high, med, low.

Competition Competitor Identification Charts Powerpoint Slide Presentation Examples
This is a competition competitor identification charts powerpoint slide presentation examples. This is a four stage process. The stages in this process are key national competitors, substitutes, new entrants, competitor.

Competitor Analysis 2 X 2 Matrix Chart Powerpoint Slide Show
This is a competitor analysis 2 x 2 matrix chart powerpoint slide show. This is a four stage process. The stages in this process are competitor, your company, competitor, complex, simple, fast, slow.
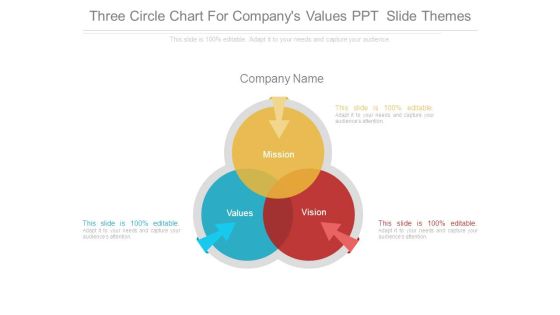
Three Circle Chart For Companys Values Ppt Slide Themes
This is a three circle chart for companys values ppt slide themes. This is a three stage process. The stages in this process are mission, company name, values, vision.
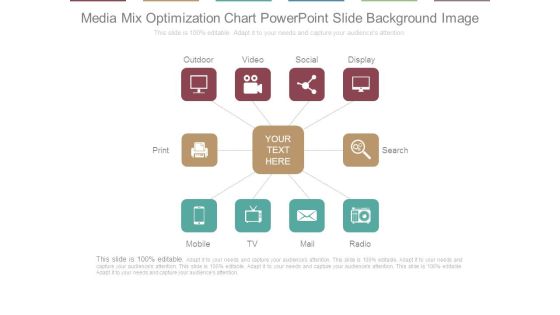
Media Mix Optimization Chart Powerpoint Slide Background Image
This is a media mix optimization chart powerpoint slide background image. This is a ten stage process. The stages in this process are outdoor, video, social, display, search, radio, mail, tv, mobile, print.

Product Roadmap Product Launch Deliverables Gantt Chart Ppt Example
This is a product roadmap product launch deliverables gantt chart ppt example. This is a three stage process. The stages in this process are product launch deliverables, product family, product.
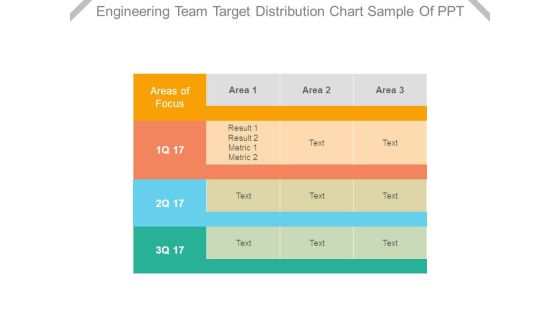
Engineering Team Target Distribution Chart Sample Of Ppt
This is a engineering team target distribution chart sample of ppt. This is a three stage process. The stages in this process are areas of focus, area, result, metric.

Changes In Competitive Environment Bar Chart Sample Of Ppt Presentation
This is a changes in competitive environment bar chart sample of ppt presentation. This is a four stage process. The stages in this process are engagement, brand, monthly, weekly.
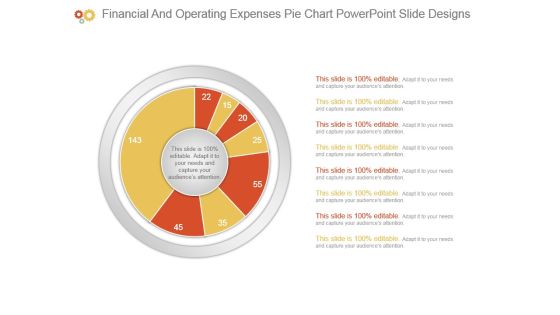
Financial And Operating Expenses Pie Chart Powerpoint Slide Designs
This is a financial and operating expenses pie chart powerpoint slide designs. This is a eight stage process. The stages in this process are business, diagram, marketing, management, presentation.
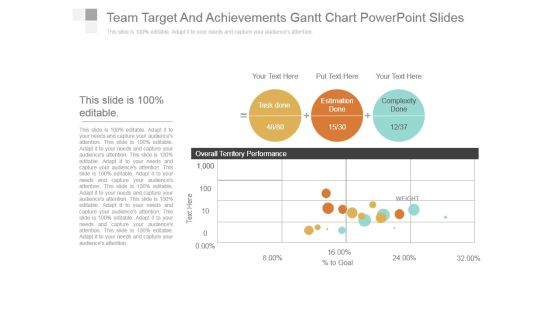
Team Target And Achievements Gantt Chart Powerpoint Slides
This is a team target and achievements gantt chart powerpoint slides. This is a three stage process. The stages in this process are task done, estimation done, complexity done, overall territory performance.

Comparison Chart For Male And Female Employment Powerpoint Shapes
This is a comparison chart for male and female employment powerpoint shapes. This is a two stage process. The stages in this process are female 72 percent, male 54 percent.

Hierarchy Chart For Sales Team Ppt PowerPoint Presentation Samples
This is a hierarchy chart for sales team ppt powerpoint presentation samples. This is a six stage process. The stages in this process are business, marketing, technology, product, management.

Competitive Analysis Template 6 Scatter Chart Ppt PowerPoint Presentation Shapes
This is a competitive analysis template 6 scatter chart ppt powerpoint presentation shapes. This is a one stage process. The stages in this process are users interface, data import, example, pricing, support update, tutorials, easy to use.
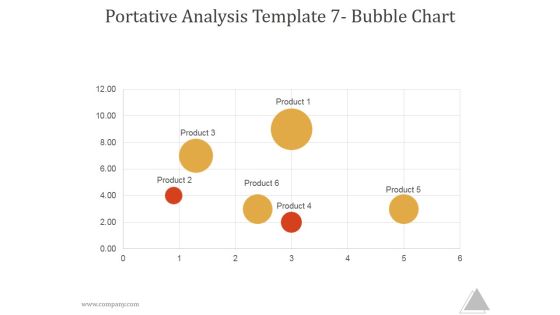
Portative Analysis Template 7 Bubble Chart Ppt PowerPoint Presentation Picture
This is a portative analysis template 7 bubble chart ppt powerpoint presentation picture. This is a six stage process. The stages in this process are product, business, marketing, management.

Competitive Analysis Matrix Chart Template 1 Ppt PowerPoint Presentation Deck
This is a competitive analysis matrix chart template 1 ppt powerpoint presentation deck. This is a six stage process. The stages in this process are product quality, product fidelity, after sales service, customer service, shipping speed.

Competitive Analysis Scatter Chart Template 2 Ppt PowerPoint Presentation Files
This is a competitive analysis scatter chart template 2 ppt powerpoint presentation files. This is a nine stage process. The stages in this process are users interface, data import, example, pricing, support, update.
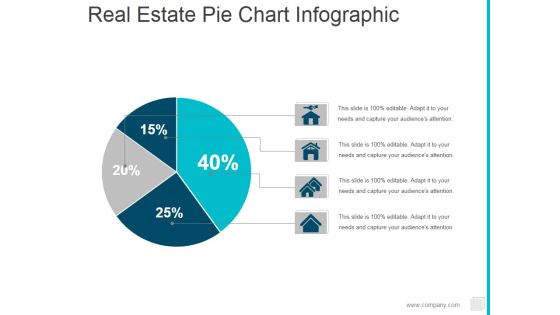
Real Estate Pie Chart Infographic Ppt PowerPoint Presentation Ideas Shapes
This is a real estate pie chart infographic ppt powerpoint presentation ideas shapes. This is a four stage process. The stages in this process are pie, finance, marketing, percentage.
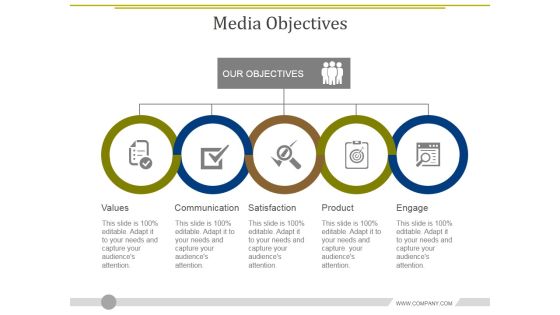
Media Objectives Template 2 Ppt PowerPoint Presentation Diagram Graph Charts
This is a media objectives template 2 ppt powerpoint presentation diagram graph charts. This is a five stage process. The stages in this process are values, communication, satisfaction, product, engage.

Basic Gap Analysis Chart Ppt PowerPoint Presentation Pictures Design Ideas
This is a basic gap analysis chart ppt powerpoint presentation pictures design ideas. This is a five stage process. The stages in this process are business, finance, marketing, analysis, investment.

Customer Services Management Chart Ppt PowerPoint Presentation Show Slides
This is a customer services management chart ppt powerpoint presentation show slides. This is a two stage process. The stages in this process are finance manager, graphic designer, ceo director, product manager.

Bar Chart Ppt PowerPoint Presentation Pictures Background Image
This is a bar chart ppt powerpoint presentation pictures background image. This is a seven stage process. The stages in this process are financial years, sales in percentage, graph, business.

Donut Pie Chart Ppt PowerPoint Presentation Infographic Template Layout Ideas
This is a donut pie chart ppt powerpoint presentation infographic template layout ideas. This is a five stage process. The stages in this process are product, business, finance, marketing.
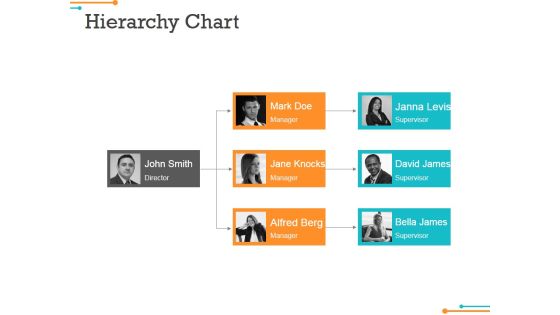
Hierarchy Chart Ppt Powerpoint Presentation Portfolio Slide Portrait
This is a hierarchy chart ppt powerpoint presentation portfolio slide portrait. This is a three stage process. The stages in this process are john smith director, mark doe manager, jane knocks manager.

Organization Chart Ppt PowerPoint Presentation Gallery Graphics Example
This is a organization chart ppt powerpoint presentation gallery graphics example. This is a five stage process. The stages in this process are chris tucker, sofia william, peter lee, marry graves, john graves.

High Low Close Chart Ppt PowerPoint Presentation Professional Background Images
This is a high low close chart ppt powerpoint presentation professional background images. This is a five stage process. The stages in this process are close, high, volume, low, open.

Scatter Bubble Chart Ppt PowerPoint Presentation Diagram Ppt
This is a scatter bubble chart ppt powerpoint presentation diagram ppt. This is a two stage process. The stages in this process are product, in price, highest sale, percentage, business, marketing.
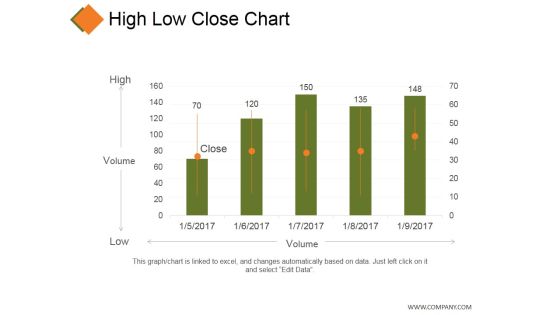
High Low Close Chart Ppt PowerPoint Presentation Model Grid
This is a high low close chart ppt powerpoint presentation model grid. This is a five stage process. The stages in this process are business, high, volume, low, marketing.

Line Bubble Chart Ppt PowerPoint Presentation Professional Infographic Template
This is a line bubble chart ppt powerpoint presentation professional infographic template. This is a five stage process. The stages in this process are product, in price, highest sale, business, finance.
Donut Pie Chart Ppt PowerPoint Presentation Icon Slide Portrait
This is a donut pie chart ppt powerpoint presentation icon slide portrait. This is a five stage process. The stages in this process are product, percentage, finance, donut, business.

High Low Close Chart Ppt PowerPoint Presentation Styles Display
This is a high low close chart ppt powerpoint presentation styles display. This is a ten stage process. The stages in this process are high, volume, low, close, finance.
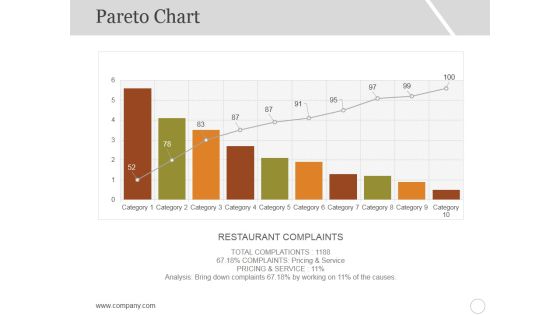
Pareto Chart Template 1 Ppt PowerPoint Presentation Ideas Graphics
This is a pareto chart template 1 ppt powerpoint presentation ideas graphics. This is a ten stage process. The stages in this process are restaurant complaints, category, business, graph.
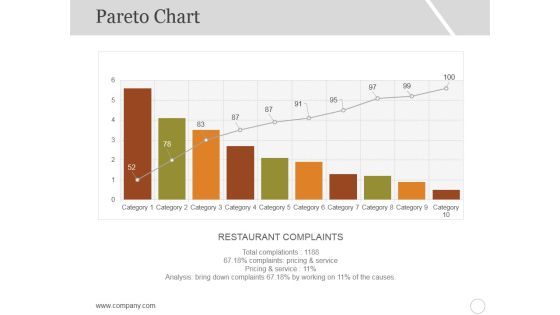
Pareto Chart Template 2 Ppt PowerPoint Presentation Portfolio Gallery
This is a pareto chart template 2 ppt powerpoint presentation portfolio gallery. This is a ten stage process. The stages in this process are restaurant complaints, category, business, graph.
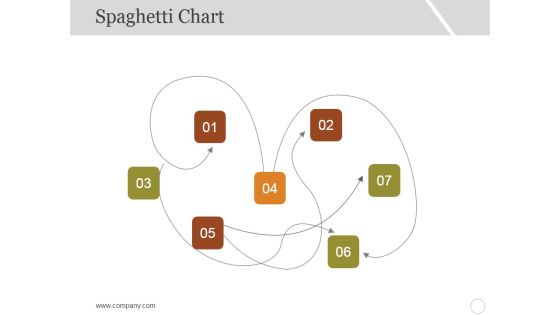
Spaghetti Chart Template 1 Ppt PowerPoint Presentation Slides Graphics Example
This is a spaghetti chart template 1 ppt powerpoint presentation slides graphics example. This is a seven stage process. The stages in this process are business, marketing, management, numbering.
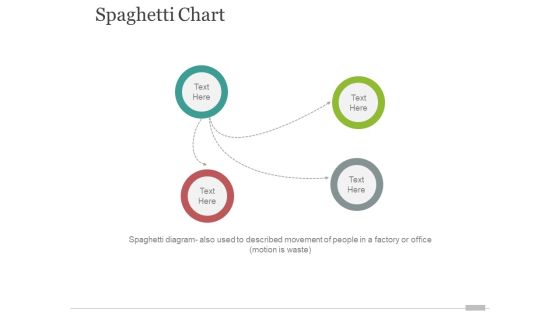
spaghetti chart template 1 ppt powerpoint presentation styles design inspiration
This is a spaghetti chart template 1 ppt powerpoint presentation styles design inspiration. This is a three stage process. The stages in this process are business, marketing, circle, management.

High Low Close Chart Ppt PowerPoint Presentation Infographic Template Vector
This is a high low close chart ppt powerpoint presentation infographic template vector. This is a ten stage process. The stages in this process are high, volume, low, product, close.

Volume High Low Close Chart Ppt PowerPoint Presentation Gallery Shapes
This is a volume high low close chart ppt powerpoint presentation gallery shapes. This is a five stage process. The stages in this process are high, volume, low, close, finance.
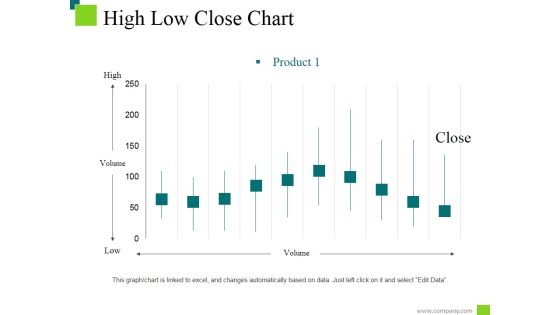
High Low Close Chart Ppt PowerPoint Presentation Styles Information
This is a high low close chart ppt powerpoint presentation styles information. This is a ten stage process. The stages in this process are low, high, product, volume, close.
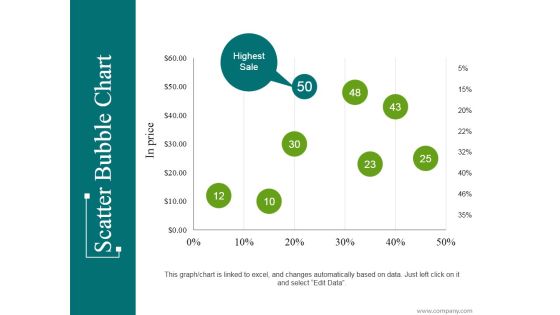
Scatter Bubble Chart Ppt PowerPoint Presentation Infographic Template Introduction
This is a scatter bubble chart ppt powerpoint presentation infographic template introduction. This is a eight stage process. The stages in this process are highest sale, business, marketing, percentage, finance.
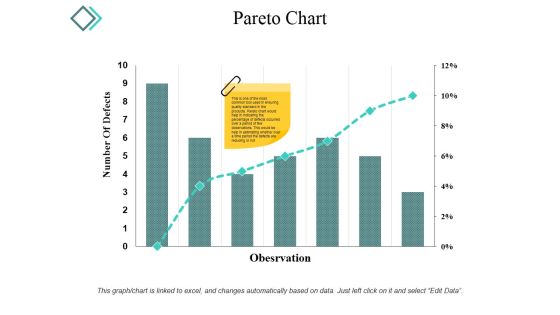
Pareto Chart Ppt PowerPoint Presentation Infographic Template Microsoft
This is a pareto chart ppt powerpoint presentation infographic template microsoft. This is a seven stage process. The stages in this process are number of defects, observation, graph, percentage, business.

High Low Close Chart Ppt PowerPoint Presentation Show Ideas
This is a high low close chart ppt powerpoint presentation show ideas. This is a ten stage process. The stages in this process are high, volume, low, close, finance.

Combo Chart Ppt PowerPoint Presentation Ideas Visual Aids
This is a combo chart ppt powerpoint presentation ideas visual aids. This is a three stage process. The stages in this process are product, sales, bar graph, business, marketing.
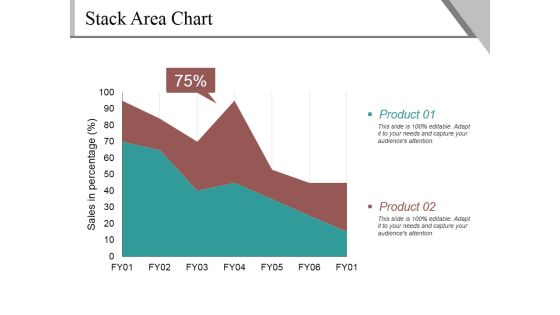
Stack Area Chart Ppt PowerPoint Presentation Gallery Guidelines
This is a stack area chart ppt powerpoint presentation gallery guidelines. This is a two stage process. The stages in this process are sales in percentage, product, percentage, business.

Stack Area Chart Ppt PowerPoint Presentation Example File
This is a stack area chart ppt powerpoint presentation example file. This is a two stage process. The stages in this process are product, sales in percentage, percentage, finance.
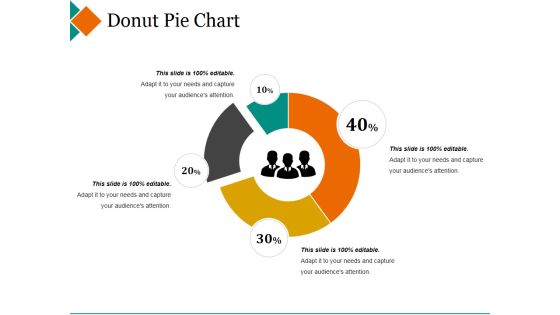
Donut Pie Chart Ppt PowerPoint Presentation Pictures Design Inspiration
This is a donut pie chart ppt powerpoint presentation pictures design inspiration. This is a four stage process. The stages in this process are maximum, donut, minimum, percentage, finance.
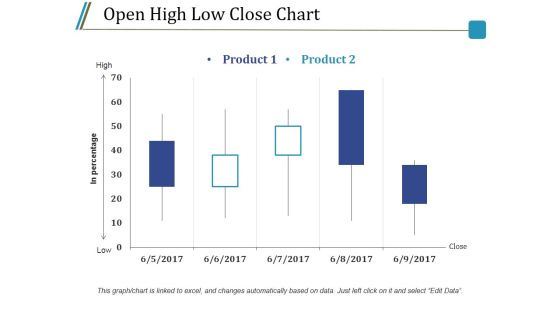
Open High Low Close Chart Ppt PowerPoint Presentation Styles Model
This is a open high low close chart ppt powerpoint presentation styles model. This is a five stage process. The stages in this process are product, high, low, in percentage, close.

Stock Chart Template 2 Ppt PowerPoint Presentation Infographic Template Styles
This is a stock chart template 2 ppt powerpoint presentation infographic template styles. This is a one stage process. The stages in this process are high, volume, low, product, volume.
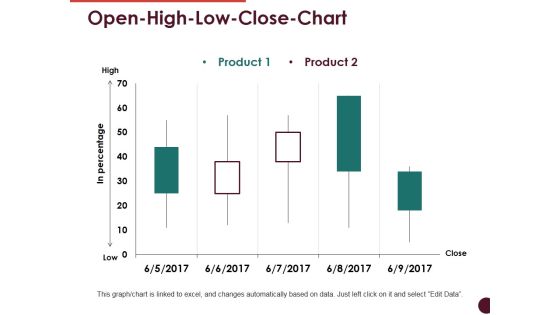
Open High Low Close Chart Ppt PowerPoint Presentation Professional Visuals
This is a open high low close chart ppt powerpoint presentation professional visuals. This is a two stage process. The stages in this process are high, low, in percentage, product, close.

Volume High Low Close Chart Ppt PowerPoint Presentation Infographics Good
This is a volume high low close chart ppt powerpoint presentation infographics good. This is a two stage process. The stages in this process are high, volume, low, product, close.
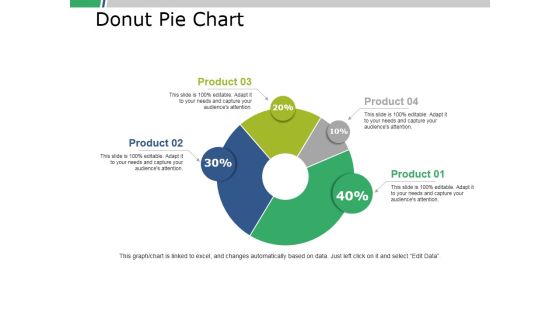
Donut Pie Chart Ppt PowerPoint Presentation Portfolio Slide Download
This is a donut pie chart ppt powerpoint presentation portfolio slide download. This is a four stage process. The stages in this process are business, marketing, finance, percent, donut.
Management Organizational Chart Ppt PowerPoint Presentation Portfolio Icon
This is a management organizational chart ppt powerpoint presentation portfolio icon. This is a three stage process. The stages in this process are tony williams, bill durbin, david johnson, robert fowler, kate jeter.
Management Organizational Chart Ppt PowerPoint Presentation Icon Background Images
This is a management organizational chart ppt powerpoint presentation icon background images. This is a three stage process. The stages in this process are marketing communication manager, marketing director, employee, bill durbin, robert fowler.
