AI PPT Maker
Templates
PPT Bundles
Design Services
Business PPTs
Business Plan
Management
Strategy
Introduction PPT
Roadmap
Self Introduction
Timelines
Process
Marketing
Agenda
Technology
Medical
Startup Business Plan
Cyber Security
Dashboards
SWOT
Proposals
Education
Pitch Deck
Digital Marketing
KPIs
Project Management
Product Management
Artificial Intelligence
Target Market
Communication
Supply Chain
Google Slides
Research Services
 One Pagers
All Categories
-
Home
- Customer Favorites
- Content Calendar
Content Calendar
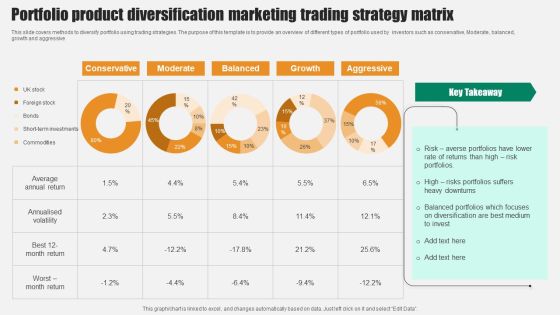
Portfolio Product Diversification Marketing Trading Strategy Matrix Clipart PDF
This slide covers methods to diversify portfolio using trading strategies. The purpose of this template is to provide an overview of different types of portfolio used by investors such as conservative, Moderate, balanced, growth and aggressive. Pitch your topic with ease and precision using this Portfolio Product Diversification Marketing Trading Strategy Matrix Clipart PDF. This layout presents information on Conservative, Moderate, Balanced, Growth, Aggressive. It is also available for immediate download and adjustment. So, changes can be made in the color, design, graphics or any other component to create a unique layout.

Customer Experience Analysis Survey Outcome Percentage Portrait PDF
The following slide highlights percentage of results to analyze and enhance customer experience. It includes key elements such as customer experience with product, global net promoter score, regional sales agent performance, satisfaction channel, quarterly NPS, etc. Pitch your topic with ease and precision using this Customer Experience Analysis Survey Outcome Percentage Portrait PDF. This layout presents information on Customer Experience, Promoter Score, Regional Sales. It is also available for immediate download and adjustment. So, changes can be made in the color, design, graphics or any other component to create a unique layout.

Customer Service Satisfaction Survey Outcome In Percentage Microsoft PDF
The slide showcases percentage result of customer satisfaction to identify service improvement areas. It includes key questions related to service satisfaction, service recommendation, business type and service improvement areas. Pitch your topic with ease and precision using this Customer Service Satisfaction Survey Outcome In Percentage Microsoft PDF. This layout presents information on Customer Service, Satisfaction Survey, Outcome In Percentage. It is also available for immediate download and adjustment. So, changes can be made in the color, design, graphics or any other component to create a unique layout.
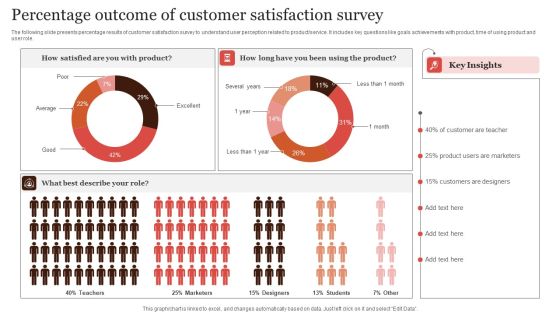
Percentage Outcome Of Customer Satisfaction Survey Infographics PDF
The following slide presents percentage results of customer satisfaction survey to understand user perception related to product or service. It includes key questions like goals achievements with product, time of using product and user role. Pitch your topic with ease and precision using this Percentage Outcome Of Customer Satisfaction Survey Infographics PDF. This layout presents information on Percentage Outcome, Customer Satisfaction Survey. It is also available for immediate download and adjustment. So, changes can be made in the color, design, graphics or any other component to create a unique layout.

Product Market Research Survey Outcome Percentage Elements PDF
This slide showcases percentage of results of market research and analysis survey to effectively understand customer behavior towards product or service. It includes key elements like customer profession, customer by countries and customer responses. Pitch your topic with ease and precision using this Product Market Research Survey Outcome Percentage Elements PDF. This layout presents information on Customer By Countries, Customer Professions, Customer Responses. It is also available for immediate download and adjustment. So, changes can be made in the color, design, graphics or any other component to create a unique layout.
Email Advertising Report Growth Dashboard Formats PDF
This slide dashboard is helpful for managers, executives, and stakeholders to display the effectiveness of an email marketing strategy. It includes active accounts, deleted accounts, and unsubscribed accounts in a month and a year. Pitch your topic with ease and precision using this Email Advertising Report Growth Dashboard Formats PDF. This layout presents information on Email Advertising, Report Growth Dashboard . It is also available for immediate download and adjustment. So, changes can be made in the color, design, graphics or any other component to create a unique layout.
KPI Dashboard To Monitor Land Asset Management Practices Clipart PDF
Following slide demonstrate KPI dashboard for tracking expenses incurred on real estate asset maintenance and to reduce operational cost. It includes elements such as net income, monthly income and expenses, last quarter rent collection status, rental revenue , budget, etc. Pitch your topic with ease and precision using this KPI Dashboard To Monitor Land Asset Management Practices Clipart PDF. This layout presents information on Revenue, Budget, Income. It is also available for immediate download and adjustment. So, changes can be made in the color, design, graphics or any other component to create a unique layout.
Project Management Lifecycle Return On Investment Analysis Demonstration PDF
This slide depicts ROI of maturity in project lifecycle which helps in evaluating feasibility, efficiency and effectiveness of project. It include maturities such as met goals, within budget, on time, scope creep and project failure. Pitch your topic with ease and precision using this Project Management Lifecycle Return On Investment Analysis Demonstration PDF. This layout presents information on Implementation, Execution Of Process, Budget. It is also available for immediate download and adjustment. So, changes can be made in the color, design, graphics or any other component to create a unique layout.

Assessment Of Amazon Brand Performance KPI Dashboard To Track Amazon Elements PDF
This slide provides information regarding dashboard to monitor Amazon performance. The KPIs include tracking of product sales, conversion rate, advertising spends, session, organic sales, etc. Slidegeeks is one of the best resources for PowerPoint templates. You can download easily and regulate Assessment Of Amazon Brand Performance KPI Dashboard To Track Amazon Elements PDF for your personal presentations from our wonderful collection. A few clicks is all it takes to discover and get the most relevant and appropriate templates. Use our Templates to add a unique zing and appeal to your presentation and meetings. All the slides are easy to edit and you can use them even for advertisement purposes.
Global Medicare Outpatients Inpatients Kpi Dashboard Template PDF
This slide shows global healthcare KPIs related to outpatients-inpatients through dashboard. It include Key performance indicators such as average global patients, average treatment cost etc. Pitch your topic with ease and precision using this Global Medicare Outpatients Inpatients Kpi Dashboard Template PDF. This layout presents information on Average Treatment Cost, Average Global Patients, Average Available Staff. It is also available for immediate download and adjustment. So, changes can be made in the color, design, graphics or any other component to create a unique layout.

Corporate Scam Risk Analysis Report KPI Dashboard Themes PDF
Following slides show the report dashboard on corporate fraud risk which will assist in creating fraud prevention strategies .It includes KPI such as risk matrix, transaction split , transaction alert, etc. Pitch your topic with ease and precision using this Corporate Scam Risk Analysis Report KPI Dashboard Themes PDF. This layout presents information on Global Transaction Flow, Risk Matrix, Transaction Split, Analysis Report Kpi Dashboard. It is also available for immediate download and adjustment. So, changes can be made in the color, design, graphics or any other component to create a unique layout.
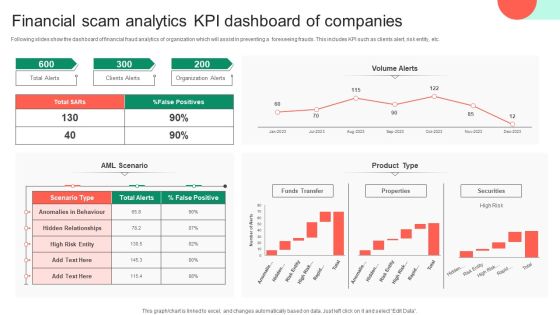
Financial Scam Analytics KPI Dashboard Of Companies Clipart PDF
Following slides show the dashboard of financial fraud analytics of organization which will assist in preventing a foreseeing frauds. This includes KPI such as clients alert, risk entity, etc. Pitch your topic with ease and precision using this Financial Scam Analytics KPI Dashboard Of Companies Clipart PDF. This layout presents information on Financial Scam Analytics, Kpi Dashboard Of Companies. It is also available for immediate download and adjustment. So, changes can be made in the color, design, graphics or any other component to create a unique layout.
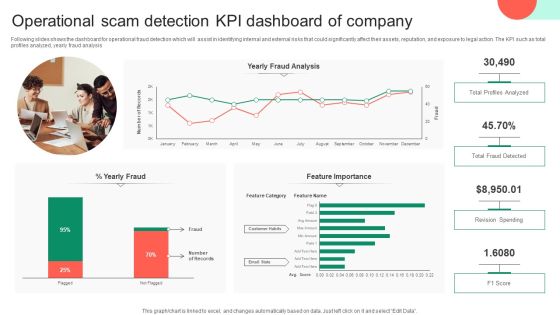
Operational Scam Detection KPI Dashboard Of Company Topics PDF
Following slides shows the dashboard for operational fraud detection which will assist in identifying internal and external risks that could significantly affect their assets, reputation, and exposure to legal action. The KPI such as total profiles analyzed, yearly fraud analysis. Pitch your topic with ease and precision using this Operational Scam Detection KPI Dashboard Of Company Topics PDF. This layout presents information on Profiles Analyzed, Operational Scam Detection, Kpi Dashboard Of Company. It is also available for immediate download and adjustment. So, changes can be made in the color, design, graphics or any other component to create a unique layout.

Scam Prevention Startup KPI Dashboard For Ecommerce Themes PDF
Following slides show the startup dashboard for fraud protection in e-commerce which will assist in identifies developing and fresh fraud attacks. The KPI such as active merchants, covered merchants, approved volume. Pitch your topic with ease and precision using this Scam Prevention Startup KPI Dashboard For Ecommerce Themes PDF. This layout presents information on Approved Volume, Chargebacks Rate, Kpi Dashboard For Ecommerce. It is also available for immediate download and adjustment. So, changes can be made in the color, design, graphics or any other component to create a unique layout.
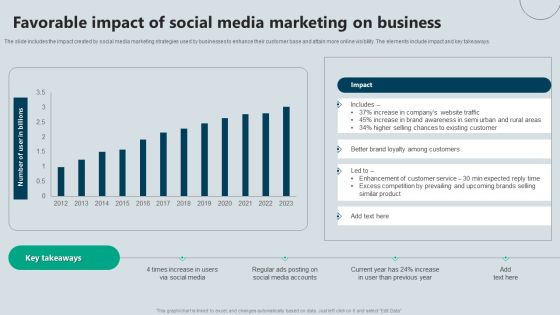
Favorable Impact Of Social Media Marketing On Business Themes PDF
The slide includes the impact created by social media marketing strategies used by businesses to enhance their customer base and attain more online visibility. The elements include impact and key takeaways. Pitch your topic with ease and precision using this Favorable Impact Of Social Media Marketing On Business Themes PDF. This layout presents information on Impact, Business, Existing Customer. It is also available for immediate download and adjustment. So, changes can be made in the color, design, graphics or any other component to create a unique layout.
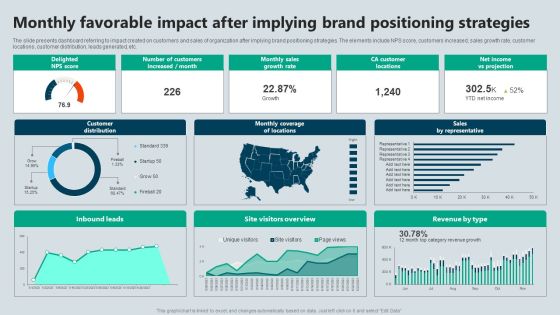
Monthly Favorable Impact After Implying Brand Positioning Strategies Demonstration PDF
The slide presents dashboard referring to impact created on customers and sales of organization after implying brand positioning strategies. The elements include NPS score, customers increased, sales growth rate, customer locations, customer distribution, leads generated, etc. Pitch your topic with ease and precision using this Monthly Favorable Impact After Implying Brand Positioning Strategies Demonstration PDF. This layout presents information on Strategies, Projection, Growth Rate. It is also available for immediate download and adjustment. So, changes can be made in the color, design, graphics or any other component to create a unique layout.
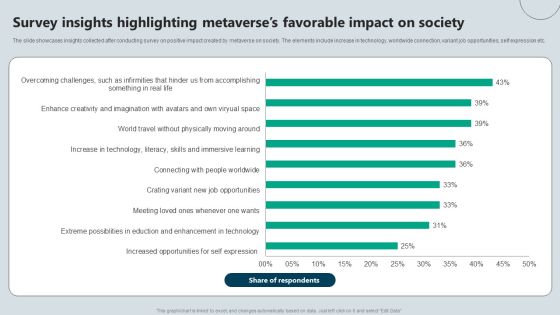
Survey Insights Highlighting Metaverses Favorable Impact On Society Background PDF
The slide showcases insights collected after conducting survey on positive impact created by metaverse on society. The elements include increase in technology, worldwide connection, variant job opportunities, self expression etc. Pitch your topic with ease and precision using this Survey Insights Highlighting Metaverses Favorable Impact On Society Background PDF. This layout presents information on Respondents, Society, Survey. It is also available for immediate download and adjustment. So, changes can be made in the color, design, graphics or any other component to create a unique layout.

Customer Feedback Statistics In Owned Media Diagrams PDF
Following slide brings forth the customer feedback statistics by using earned media. Top customer responses include visit website, search for more reviews, visit business location, continue with search and contact the business Pitch your topic with ease and precision using this Customer Feedback Statistics In Owned Media Diagrams PDF. This layout presents information on Key Takeaways, Media, Customer. It is also available for immediate download and adjustment. So, changes can be made in the color, design, graphics or any other component to create a unique layout.

Dashboard To Track Effectiveness Of Owned Media Marketing Structure PDF
This slide illustrates a dashboard which can be used by brand managers to track the effectiveness of earned media in the domain of digital marketing. The key elements include brand mentions, social media reach, customer interactions, positive and negative feedback Pitch your topic with ease and precision using this Dashboard To Track Effectiveness Of Owned Media Marketing Structure PDF. This layout presents information on Brand Mentions, Social Media, Marketing. It is also available for immediate download and adjustment. So, changes can be made in the color, design, graphics or any other component to create a unique layout.
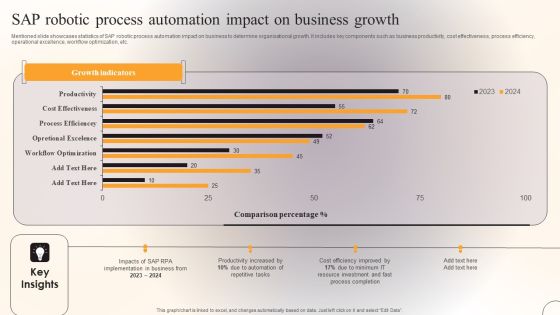
SAP Robotic Process Automation Impact On Business Growth Template PDF
Mentioned slide showcases statistics of SAP robotic process automation impact on business to determine organisational growth. It includes key components such as business productivity, cost effectiveness, process efficiency, operational excellence, workflow optimization, etc. Pitch your topic with ease and precision using this SAP Robotic Process Automation Impact On Business Growth Template PDF. This layout presents information on Productivity, Process Completion, Resource Investment. It is also available for immediate download and adjustment. So, changes can be made in the color, design, graphics or any other component to create a unique layout.

Business Units Risk Ratings And Analysis Software Dashboard Ideas PDF
This slide covers risk distribution among different business units. It also includes inherent risk ratings for anti-bribery, commodity markets, competition, cyber security along with residual risk distribution matrix. Pitch your topic with ease and precision using this Business Units Risk Ratings And Analysis Software Dashboard Ideas PDF. This layout presents information on Risk Dashboard, Inherent Risk Medium, Controls Rising Weak. It is also available for immediate download and adjustment. So, changes can be made in the color, design, graphics or any other component to create a unique layout.

Chinese Tourists Duration Of Stay In Indonesia Compared To ASEAN Tourists Brochure PDF
This slide showcases the length of stay of chinese tourists in indonesia compared to ASEAN tourists to identify the characteristics and performance of chinese tourists in indonesia. It also includes the length of stay for various reasons such as holiday, education, shopping, etc. Pitch your topic with ease and precision using this Chinese Tourists Duration Of Stay In Indonesia Compared To ASEAN Tourists Brochure PDF. This layout presents information on Chinese Tourists Duration, Indonesia Compared, Asean Tourists. It is also available for immediate download and adjustment. So, changes can be made in the color, design, graphics or any other component to create a unique layout.
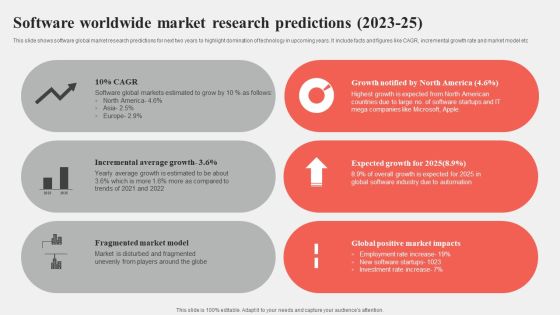
Software Worldwide Market Research Predictions 2023 25 Graphics PDF
This slide shows software global market research predictions for next two years to highlight domination of technology in upcoming years. It include facts and figures like CAGR, incremental growth rate and market model etc Pitch your topic with ease and precision using this Software Worldwide Market Research Predictions 2023 25 Graphics PDF. This layout presents information on Average Growth, Market Model, Market Impacts. It is also available for immediate download and adjustment. So, changes can be made in the color, design, graphics or any other component to create a unique layout.
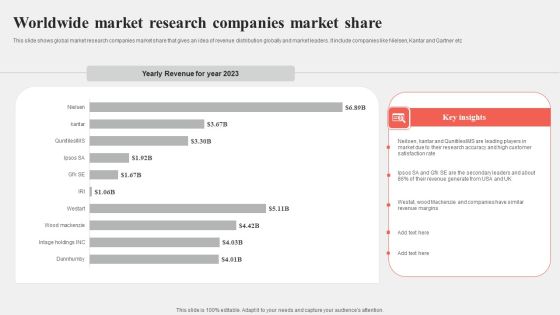
Worldwide Market Research Companies Market Share Portrait PDF
This slide shows global market research companies market share that gives an idea of revenue distribution globally and market leaders. It include companies like Nielsen, Kantar and Gartner etc Pitch your topic with ease and precision using this Worldwide Market Research Companies Market Share Portrait PDF. This layout presents information on Market Share, Key Insights, Worldwide. It is also available for immediate download and adjustment. So, changes can be made in the color, design, graphics or any other component to create a unique layout.
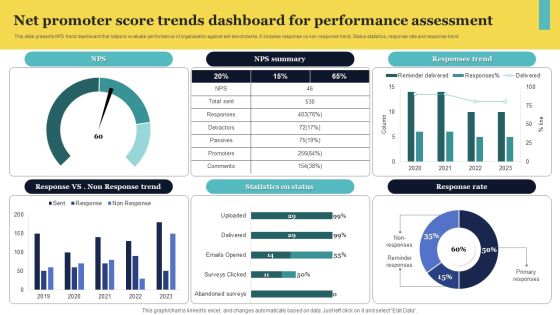
Net Promoter Score Trends Dashboard For Performance Assessment Elements PDF
This slide presents NPS trend dashboard that helps to evaluate performance of organisation against set benchmarks. It includes response vs non-response trend, Status statistics, response rate and response trend Pitch your topic with ease and precision using this Net Promoter Score Trends Dashboard For Performance Assessment Elements PDF. This layout presents information on Response Trend, Summary, Status. It is also available for immediate download and adjustment. So, changes can be made in the color, design, graphics or any other component to create a unique layout.
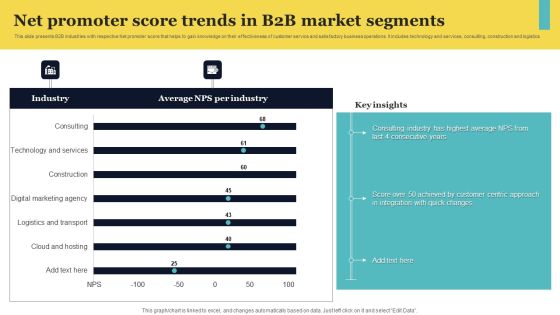
Net Promoter Score Trends In B2b Market Segments Pictures PDF
This slide presents B2B industries with respective Net promoter score that helps to gain knowledge on their effectiveness of customer service and satisfactory business operations. It includes technology and services, consulting, construction and logistics Pitch your topic with ease and precision using this Net Promoter Score Trends In B2b Market Segments Pictures PDF. This layout presents information on Key Insights, Segments, Promoter. It is also available for immediate download and adjustment. So, changes can be made in the color, design, graphics or any other component to create a unique layout.

Shareholder Capital Structure For Food Company Inspiration PDF
The slide carries a shareholder structure to understand the food companys share capital and voting rights. Various components included are percentage of share capital and percentage of voting rights owned by each shareholder of the company. Pitch your topic with ease and precision using this Shareholder Capital Structure For Food Company Inspiration PDF. This layout presents information on Shareholder Capital Structure, Food Company. It is also available for immediate download and adjustment. So, changes can be made in the color, design, graphics or any other component to create a unique layout.
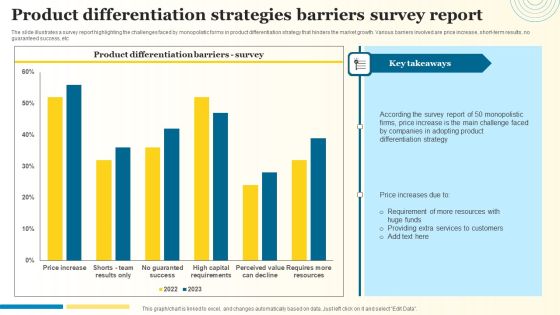
Product Differentiation Strategies Barriers Survey Report Introduction PDF
The slide illustrates a survey report highlighting the challenges faced by monopolistic forms in product differentiation strategy that hinders the market growth. Various barriers involved are price increase, short-term results, no guaranteed success, etc. Pitch your topic with ease and precision using this Product Differentiation Strategies Barriers Survey Report Introduction PDF. This layout presents information on Differentiation Strategy, Adopting Product, Price Increase. It is also available for immediate download and adjustment. So, changes can be made in the color, design, graphics or any other component to create a unique layout.

Key Statistics Showing Resource Recovery Equipment Marketing Blueprint Graphics PDF
This template shows a graphical analysis of the recycling market. The purpose of this slide is to. It includes such as metal, plastic, construction waste, paper, rubber, etc. Pitch your topic with ease and precision using this Key Statistics Showing Resource Recovery Equipment Marketing Blueprint Graphics PDF. This layout presents information on Equipment, Environment, Marketing Blueprint. It is also available for immediate download and adjustment. So, changes can be made in the color, design, graphics or any other component to create a unique layout.

Average Talent Attrition Cost By Profession Diagrams PDF
This slide illustrates a survey report of professionals facing high turnover cost along with the average rate of all roles. It includes professions such as human resources, research, product management, marketing and consulting. Pitch your topic with ease and precision using this Average Talent Attrition Cost By Profession Diagrams PDF. This layout presents information on Human Resource Manager, Key Highlights, Bad Management. It is also available for immediate download and adjustment. So, changes can be made in the color, design, graphics or any other component to create a unique layout.

Forecasted RPA Impact On Telecommunications Business Professional PDF
Mentioned slide showcases impact of robotic process automation of different industries productivity and growth. It includes key components such as forecasted productivity and predicted businesses revenue growth. Pitch your topic with ease and precision using this Forecasted RPA Impact On Telecommunications Business Professional PDF. This layout presents information on Forecasted Productivity, Predicted Revenue Growth, Telecom Business. It is also available for immediate download and adjustment. So, changes can be made in the color, design, graphics or any other component to create a unique layout.
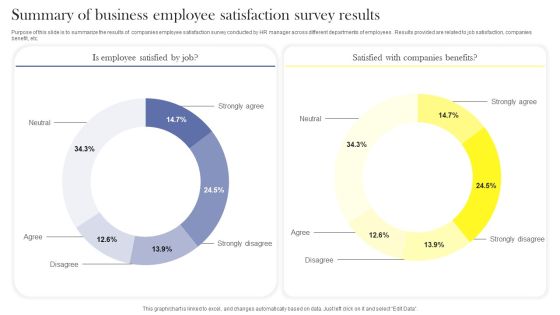
Summary Of Business Employee Satisfaction Survey Results Survey SS
Purpose of this slide is to summarize the results of companies employee satisfaction survey conducted by HR manager across different departments of employees . Results provided are related to job satisfaction, companies benefit, etc. Pitch your topic with ease and precision using this Summary Of Business Employee Satisfaction Survey Results Survey SS. This layout presents information on Neutral, Strongly Agree, Strongly Disagree, Disagree, Agree. It is also available for immediate download and adjustment. So, changes can be made in the color, design, graphics or any other component to create a unique layout.
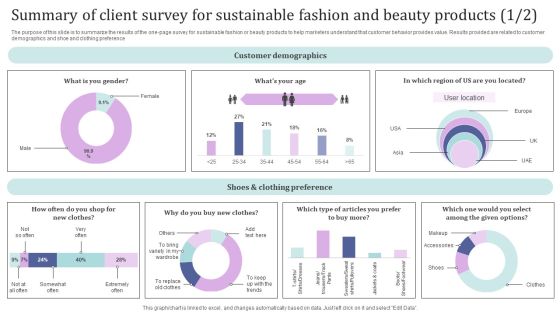
Summary Of Client Survey For Sustainable Fashion And Beauty Products Survey SS
The purpose of this slide is to summarize the results of the one-page survey for sustainable fashion or beauty products to help marketers understand that customer behavior provides value. Results provided are related to customer demographics and shoe and clothing preference. Pitch your topic with ease and precision using this Summary Of Client Survey For Sustainable Fashion And Beauty Products Survey SS. This layout presents information on Customer Demographics, Shoes And Clothing Preference, User Location. It is also available for immediate download and adjustment. So, changes can be made in the color, design, graphics or any other component to create a unique layout.
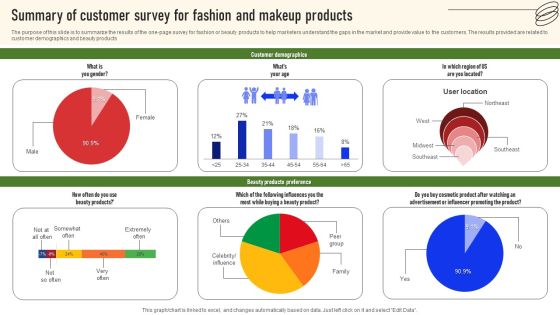
Summary Of Customer Survey For Fashion And Makeup Products Survey SS
The purpose of this slide is to summarize the results of the one-page survey for fashion or beauty products to help marketers understand the gaps in the market and provide value to the customers. The results provided are related to customer demographics and beauty products. Pitch your topic with ease and precision using this Summary Of Customer Survey For Fashion And Makeup Products Survey SS. This layout presents information on Customer Demographics, Beauty Products Preference. It is also available for immediate download and adjustment. So, changes can be made in the color, design, graphics or any other component to create a unique layout.
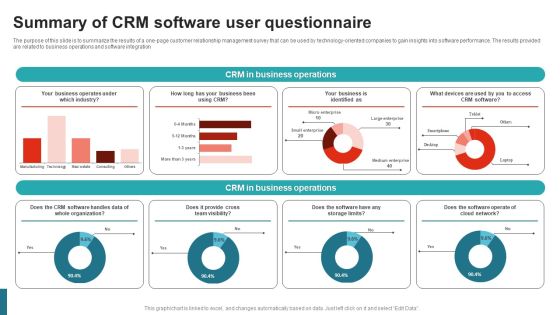
Summary Of CRM Software User Questionnaire Survey SS
The purpose of this slide is to summarize the results of a one-page customer relationship management survey that can be used by technology-oriented companies to gain insights into software performance. The results provided are related to business operations and software integration. Pitch your topic with ease and precision using this Summary Of CRM Software User Questionnaire Survey SS. This layout presents information on CRM In Business Operations, Industry, Cloud Network, Team Visibility. It is also available for immediate download and adjustment. So, changes can be made in the color, design, graphics or any other component to create a unique layout.
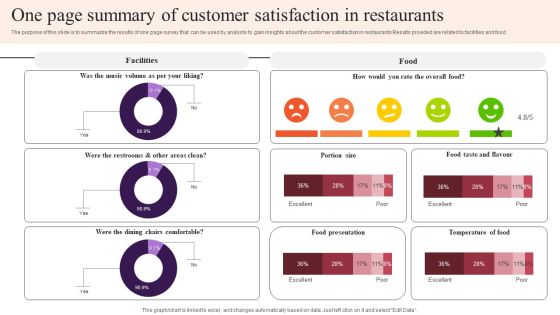
One Page Summary Of Customer Satisfaction In Restaurants Survey SS
The purpose of this slide is to summarize the results of one page survey that can be used by analysts to gain insights about the customer satisfaction in restaurants Results provided are related to facilities and food. Pitch your topic with ease and precision using this One Page Summary Of Customer Satisfaction In Restaurants Survey SS. This layout presents information on Facilities, Food Presentation, Temperature Of Food, Food Taste And Flavour. It is also available for immediate download and adjustment. So, changes can be made in the color, design, graphics or any other component to create a unique layout.

Summary Of Post Event Experience Survey Survey SS
The purpose of this slide is to summarize the results of one-page survey that can be used by businesses and event organizations to gather feedback about current events and make improvements in successive ones. The results provided are related to general questions and event questions. Pitch your topic with ease and precision using this Summary Of Post Event Experience Survey Survey SS. This layout presents information on General Questions, Event Questions, Location Of The Event, Social Media. It is also available for immediate download and adjustment. So, changes can be made in the color, design, graphics or any other component to create a unique layout.

Summary Of Restaurant Experience Survey Results Survey SS
This slide summarizing the overall result of restaurant survey conduct by owner to enhance customer experience. Results are provided related to quality of service provided by owner, server, beverage products, etc. Pitch your topic with ease and precision using this Summary Of Restaurant Experience Survey Results Survey SS. This layout presents information on Quality Of Food Items, Quality Of Restaurant Cleanliness, Quality Of Beverage Products. It is also available for immediate download and adjustment. So, changes can be made in the color, design, graphics or any other component to create a unique layout.

Summary Of Financial Performance Of Present Business Survey SS
The purpose of this slide is to summarize the results of a one-page survey that can be used by policymakers to gain insights into the financial performance of all the businesses operating in the service industry to gain insights and take action accordingly. The results provided are related to executions and staffing. Pitch your topic with ease and precision using this Summary Of Financial Performance Of Present Business Survey SS. This layout presents information on Business Executions, Business Employees, Organization, Officers, Managers, Staff. It is also available for immediate download and adjustment. So, changes can be made in the color, design, graphics or any other component to create a unique layout.
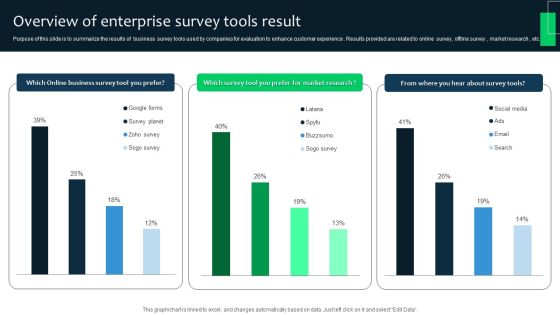
Overview Of Enterprise Survey Tools Result Survey SS
Purpose of this slide is to summarize the results of business survey tools used by companies for evaluation to enhance customer experience . Results provided are related to online survey, offline survey , market research , etc. Pitch your topic with ease and precision using this Overview Of Enterprise Survey Tools Result Survey SS. This layout presents information on Online Business Survey Tool, Market Research, Survey Tools, Social Media. It is also available for immediate download and adjustment. So, changes can be made in the color, design, graphics or any other component to create a unique layout.

Business Sales Procedures Improvement Dashboard Designs PDF
Following slide shows the dashboard for reengineering business sales processes which assist in accelerated processing times, lower costs, better customer service, and stronger employee retention. The KPI are proposals ,opportunities, etc. Pitch your topic with ease and precision using this Business Sales Procedures Improvement Dashboard Designs PDF. This layout presents information on Deals Opportunities Ratios, Opportunity, Deals Conversion Ratio. It is also available for immediate download and adjustment. So, changes can be made in the color, design, graphics or any other component to create a unique layout.

Dashboard Illustrating Attrition Risk And Expenses Of Employee Attrition Clipart PDF
This slide represents a dashboard that help predict attrition risks and turnover costs incurred by companies. It includes various aspects such as current high risk employees, key prospects at high risk for leaving, cost of turnover, risk by country, etc. Pitch your topic with ease and precision using this Dashboard Illustrating Attrition Risk And Expenses Of Employee Attrition Clipart PDF. This layout presents information on Dashboard Illustrating Attrition Risk, Expenses Of Employee Attrition . It is also available for immediate download and adjustment. So, changes can be made in the color, design, graphics or any other component to create a unique layout.
Investment Annual Returns Performance Report Icons PDF
This slide presents a report highlighting performance of returns from investments in multiple funds to analyze and measure portfolio. It includes key components such as annual returns of funds, corporate bonds, equity, cash and market mood index and G-sec. Pitch your topic with ease and precision using this Investment Annual Returns Performance Report Icons PDF. This layout presents information on Cash, Quity, Corporate Bonds. It is also available for immediate download and adjustment. So, changes can be made in the color, design, graphics or any other component to create a unique layout.
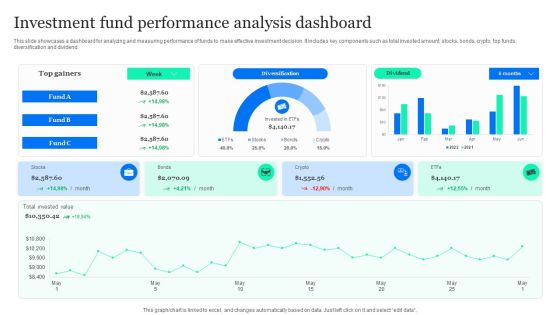
Investment Fund Performance Analysis Dashboard Professional PDF
This slide showcases a dashboard for analyzing and measuring performance of funds to make effective investment decision. It includes key components such as total invested amount, stocks, bonds, crypto, top funds, diversification and dividend. Pitch your topic with ease and precision using this Investment Fund Performance Analysis Dashboard Professional PDF. This layout presents information on Diversification, Invested Value, Bonds. It is also available for immediate download and adjustment. So, changes can be made in the color, design, graphics or any other component to create a unique layout.
Investment Fund Performance Tracking Dashboard Microsoft PDF
This slide showcases a dashboard to track and supervise funds performance for portfolio balancing . it includes key components such as amount invested in funds, number of invested funds, rate of return, annual investments and rating wise investments. Pitch your topic with ease and precision using this Investment Fund Performance Tracking Dashboard Microsoft PDF. This layout presents information on Amount Invented Funds, Rate Return, Rating Wise Investments. It is also available for immediate download and adjustment. So, changes can be made in the color, design, graphics or any other component to create a unique layout.
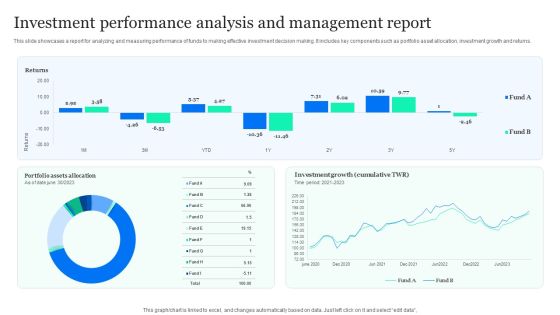
Investment Performance Analysis And Management Report Sample PDF
This slide showcases a report for analyzing and measuring performance of funds to making effective investment decision making. It includes key components such as portfolio asset allocation, investment growth and returns. Pitch your topic with ease and precision using this Investment Performance Analysis And Management Report Sample PDF. This layout presents information on Portfolio Assets Allocation, Investment Growth, Returns. It is also available for immediate download and adjustment. So, changes can be made in the color, design, graphics or any other component to create a unique layout.

Dashboard For Brand Marketing Governance Strategy Portrait PDF
The following slide highlights strategy for brand management to support companies to improve revenue, brand recognition etc. It includes components such as customers, campaigns, customer value, demographic breakdown, brand mentions, advertising, web conversion rate, loan to value, customer acquisition cost etc. Pitch your topic with ease and precision using this Dashboard For Brand Marketing Governance Strategy Portrait PDF. This layout presents information on Brand, Customers, Campaigns. It is also available for immediate download and adjustment. So, changes can be made in the color, design, graphics or any other component to create a unique layout.

Degree Of Bookkeeping And Finance Activities Automation Graphics PDF
The following slide highlights automation of finance and accounting activities using software. It includes tasks such as external reporting and financial controlling, cash disbursement, revenue management, tax, general accounting and analysis, general accounting operations, treasury, risk management etc. Pitch your topic with ease and precision using this Degree Of Bookkeeping And Finance Activities Automation Graphics PDF. This layout presents information on Tax Automation, Business Intelligence, Revenue Management. It is also available for immediate download and adjustment. So, changes can be made in the color, design, graphics or any other component to create a unique layout.

Key Statistics Associated With Bookkeeping Automation Demonstration PDF
The following slide highlights accounting automation statistics to improve efficiency and productivity. It includes components such as top automated services used for accounting firms, firms undertaking cloud-based finance and accounting software according to size, major accounting firms in the USA etc. Pitch your topic with ease and precision using this Key Statistics Associated With Bookkeeping Automation Demonstration PDF. This layout presents information on Key Statistics Associated, Bookkeeping Automation. It is also available for immediate download and adjustment. So, changes can be made in the color, design, graphics or any other component to create a unique layout.
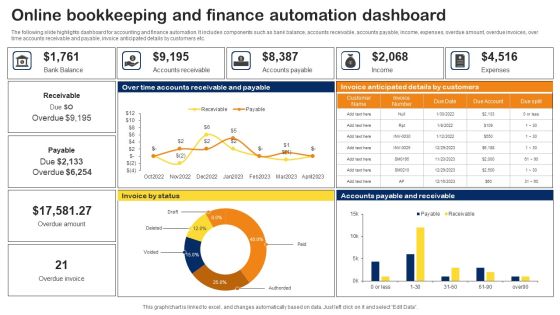
Online Bookkeeping And Finance Automation Dashboard Topics PDF
The following slide highlights dashboard for accounting and finance automation. It includes components such as bank balance, accounts receivable, accounts payable, income, expenses, overdue amount, overdue invoices, over time accounts receivable and payable, invoice anticipated details by customers etc. Pitch your topic with ease and precision using this Online Bookkeeping And Finance Automation Dashboard Topics PDF. This layout presents information on Online Bookkeeping, Finance Automation Dashboard. It is also available for immediate download and adjustment. So, changes can be made in the color, design, graphics or any other component to create a unique layout.

Dashboard To Track Impact Of Extensive Diversity Training On Workplace Management Portrait PDF
This slide showcases dashboard to track impact of diversity training on workplace management. Key metrics included here are gender distribution level, hire by gender, ethinicity distribution, promotion rate, termination rate etc. Pitch your topic with ease and precision using this Dashboard To Track Impact Of Extensive Diversity Training On Workplace Management Portrait PDF. This layout presents information on Dashboard To Track Impact, Extensive Diversity Training, Workplace Management. It is also available for immediate download and adjustment. So, changes can be made in the color, design, graphics or any other component to create a unique layout.
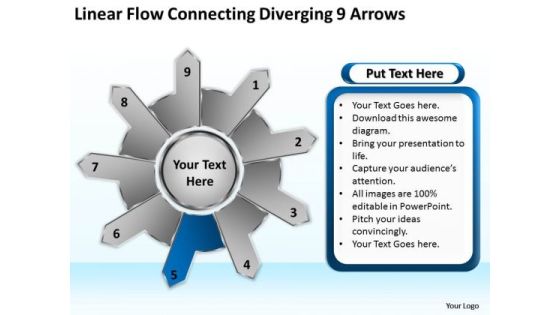
Linear Flow Connecting Diverging 9 Arrows Cycle Circular Spoke Network PowerPoint Slides
We present our linear flow connecting diverging 9 arrows cycle Circular Spoke Network PowerPoint Slides.Use our Shapes PowerPoint Templates because it demonstrates the seeds of many of our successes. Use our Flow charts PowerPoint Templates because your brain is always churning out ideas like cogs in a wheel. Download and present our Process and Flows PowerPoint Templates because with the help of our Slides you can Illustrate your plans to your listeners with the same accuracy. Present our Arrows PowerPoint Templates because with the help of our Slides you can Illustrate your plans on using the many social media modes available to inform soceity at large of the benefits of your product. Use our Success PowerPoint Templates because you have come up with a brilliant breakthrough idea. you can also visualise the interest it will generate.Use these PowerPoint slides for presentations relating to Access, arrow, background,banner, blue, bright, business, chart,circle, color, colorful, concept,conceptual, connection, corporate,creative, cycle, design, different, element,empty, form, frame, graphic, green,group, idea, illustration, match,message, order, part, piece, place,process, red, shape, solution, special,speech, strategy, symbol. The prominent colors used in the PowerPoint template are Blue navy, Gray, White. People tell us our linear flow connecting diverging 9 arrows cycle Circular Spoke Network PowerPoint Slides are Royal. Customers tell us our banner PowerPoint templates and PPT Slides are Elegant. Professionals tell us our linear flow connecting diverging 9 arrows cycle Circular Spoke Network PowerPoint Slides help you meet deadlines which are an element of today's workplace. Just browse and pick the slides that appeal to your intuitive senses. Presenters tell us our background PowerPoint templates and PPT Slides are Youthful. Use our linear flow connecting diverging 9 arrows cycle Circular Spoke Network PowerPoint Slides are Striking. Presenters tell us our background PowerPoint templates and PPT Slides are Majestic.

Arrow 5 Stages Diverging Process Diagram Circular Flow PowerPoint Slides
We present our arrow 5 stages diverging process diagram Circular Flow PowerPoint Slides.Download our Arrows PowerPoint Templates because it is all there in bits and pieces. Download our Business PowerPoint Templates because maximising sales of your product is the intended destination. Download and present our Process and flows PowerPoint Templates because you can present your opinions in this field using our impressive templates. Present our Ring Charts PowerPoint Templates because with the help of our Slides you can Illustrate your plans on using the many social media modes available to inform soceity at large of the benefits of your product. Present our Business PowerPoint Templates because your fledgling career is in the chrysallis stage. Nurture it and watch it grow into a beautiful butterfly.Use these PowerPoint slides for presentations relating to Arrow, arrow circle, arrow color circle, blue, business concept, career, center stage, chart, circle, circle arrow diagram, color full, connection, contrast, cycle, diagram, direction, dot line, flow, flowchart, future, glowing, graph, green, icon, illness, illustration, isolate, isolated, job, life, loop, plan for success, recycle, recycling, refresh, ring, rotation, sick, sign, symbol. The prominent colors used in the PowerPoint template are Gray, black, White. You can be sure our arrow 5 stages diverging process diagram Circular Flow PowerPoint Slides are Fancy. Presenters tell us our concept PowerPoint templates and PPT Slides are Swanky. We assure you our arrow 5 stages diverging process diagram Circular Flow PowerPoint Slides are Breathtaking. Customers tell us our concept PowerPoint templates and PPT Slides are Multicolored. Presenters tell us our arrow 5 stages diverging process diagram Circular Flow PowerPoint Slides are Awesome. You can be sure our circle PowerPoint templates and PPT Slides are Multicolored.
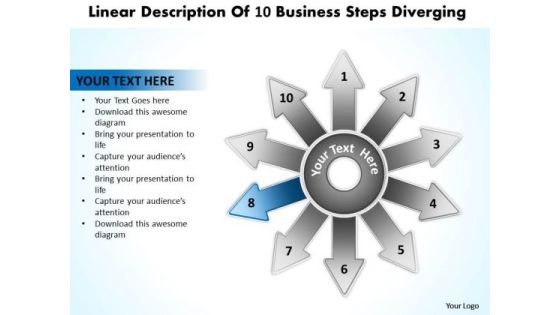
Templates Free Download Steps Diverging Circular Flow Process PowerPoint
We present our templates free download steps diverging Circular Flow Process PowerPoint.Use our Arrows PowerPoint Templates because it unravels each one for your audience while setting key timelines as you go along. Download our Business PowerPoint Templates because this layout helps you to bring some important aspects of your business process to the notice of all concerned. Streamline the flow of information across the board. Download and present our Shapes PowerPoint Templates because this helps you to chart the path ahead to arrive at your destination and acheive the goal. Download and present our Flow Charts PowerPoint Templates because this slide represents the tools of the trade. Present our Process and Flows PowerPoint Templates because it expound on why you have discarded some plans as you went along to the apex and came out with the final selection which you know will make you and your team shine.Use these PowerPoint slides for presentations relating to Action, Advertising, Arrows, Business, Design, Development, Diagram, Element, Planning, Graphic, Idea, Illustration, Management, Market, Marketing, Presentation, Process, Description, Progress, Strategy, Success, Target, Training, Vector. The prominent colors used in the PowerPoint template are Blue, White, Gray. People tell us our templates free download steps diverging Circular Flow Process PowerPoint are Versatile. People tell us our Diagram PowerPoint templates and PPT Slides will get their audience's attention. The feedback we get is that our templates free download steps diverging Circular Flow Process PowerPoint are Playful. Presenters tell us our Arrows PowerPoint templates and PPT Slides are No-nonsense. Customers tell us our templates free download steps diverging Circular Flow Process PowerPoint will save the presenter time. The feedback we get is that our Arrows PowerPoint templates and PPT Slides are Efficient.

Business Plan Methods Tools And Templates Set 2 Partner Relationship Management PRM Solution Download PDF
This slide covers the different sales channels, representatives, independent partners required to build a partner network within the organization. Presenting business plan methods tools and templates set 2 partner relationship management prm solution download pdf to provide visual cues and insights. Share and navigate important information on one stages that need your due attention. This template can be used to pitch topics like analyze kpis, growth potential, monitor sales, provide bi and analytics. In addtion, this PPT design contains high resolution images, graphics, etc, that are easily editable and available for immediate download.

Comprehensive Business Digitization Deck Stages Of Digital Transformation Plan Methodology Rules PDF
This roadmap covers the 10 steps needed in digital transformation to compete more effectively in the market. Presenting comprehensive business digitization deck stages of digital transformation plan methodology rules pdf to provide visual cues and insights. Share and navigate important information on ten stages that need your due attention. This template can be used to pitch topics like allocate funding, grow future, snowball adopt, agile methodology, build capabilities. In addtion, this PPT design contains high resolution images, graphics, etc, that are easily editable and available for immediate download.

Strategic Partnership Management Plan 6 Challenges Confronting Every Business Partnership Download PDF
This slide covers the challenges faced by business partnership due to different management styles, setting boundaries, financial problems, commitment levels, disparities in skills and personal habits. Presenting strategic partnership management plan 6 challenges confronting every business partnership download pdf to provide visual cues and insights. Share and navigate important information on six stages that need your due attention. This template can be used to pitch topics like setting boundaries, commitment levels, personal habits, disparities in skills and roles, financial problems and equity. In addtion, this PPT design contains high resolution images, graphics, etc, that are easily editable and available for immediate download.

API Outline API Management Market Size By Region World Map Representation Themes PDF
The following chart shows the Application Interface Management Market Analysis by region, over a period of years. Presenting api outline api management market size by region world map representation themes pdf to provide visual cues and insights. Share and navigate important information on two stages that need your due attention. This template can be used to pitch topics like large market size in 2019, market with highest cagr for 2019 to 2021 projected. In addition, this PPT design contains high-resolution images, graphics, etc, that are easily editable and available for immediate download.

API Ecosystem API Management Market Size By Region World Map Representation Background PDF
The following chart shows the Application Interface Management Market Analysis by region , over a period of years. Presenting api ecosystem api management market size by region world map representation background pdf to provide visual cues and insights. Share and navigate important information on one stages that need your due attention. This template can be used to pitch topics like development, management, market, growth. In addtion, this PPT design contains high resolution images, graphics, etc, that are easily editable and available for immediate download.

API Management Market API Management Market Size By Region World Map Representation Guidelines PDF
The following chart shows the Application Interface Management Market Analysis by region , over a period of years. Presenting api management market api management market size by region world map representation guidelines pdf to provide visual cues and insights. Share and navigate important information on five stages that need your due attention. This template can be used to pitch topics like management, technical, security solution accounts, market with highest cagr for 2019 2021 projected. In addtion, this PPT design contains high resolution images, graphics, etc, that are easily editable and available for immediate download.
