AI PPT Maker
Templates
PPT Bundles
Design Services
Business PPTs
Business Plan
Management
Strategy
Introduction PPT
Roadmap
Self Introduction
Timelines
Process
Marketing
Agenda
Technology
Medical
Startup Business Plan
Cyber Security
Dashboards
SWOT
Proposals
Education
Pitch Deck
Digital Marketing
KPIs
Project Management
Product Management
Artificial Intelligence
Target Market
Communication
Supply Chain
Google Slides
Research Services
 One Pagers
All Categories
-
Home
- Customer Favorites
- Content Calendar
Content Calendar

What Is Insurance Agency Offerings To Clients Template PDF
This slide provides glimpse about insurance agency offerings to its clients. The offerings are insurance products such as personal insurance, auto insurance and financial products such as mortgage products, retirement plans, etc. The What Is Insurance Agency Offerings To Clients Template PDF is a compilation of the most recent design trends as a series of slides. It is suitable for any subject or industry presentation, containing attractive visuals and photo spots for businesses to clearly express their messages. This template contains a variety of slides for the user to input data, such as structures to contrast two elements, bullet points, and slides for written information. Slidegeeks is prepared to create an impression.

Analysis Levels For Maximizing Promotion Value Template PDF
This slide defines the different levels for maximizing promotion value. It includes information related to tracking, assessment of return on investment ROI, predictive impact and analysis. Persuade your audience using this Analysis Levels For Maximizing Promotion Value Template PDF. This PPT design covers four stages, thus making it a great tool to use. It also caters to a variety of topics including Tracking Data, Roi Assessment Planning, Predictive Impact. Download this PPT design now to present a convincing pitch that not only emphasizes the topic but also showcases your presentation skills.

Best Practices In Nonprofit Advertising Strategy Ideas PDF
The following slide encompasses the best practices which can be implemented to improve the performance of marketing plan by marketers or key responsible person. The practices are to save data of donors, segment supporters, consistent branding, mobile responsiveness and social media Presenting Best Practices In Nonprofit Advertising Strategy Ideas PDF to dispense important information. This template comprises five stages. It also presents valuable insights into the topics including Consistent Branding, Mobile Responsiveness, Segment Supporters. This is a completely customizable PowerPoint theme that can be put to use immediately. So, download it and address the topic impactfully.

Continuous Strategies For Regular Improvement For Software Testing Process Diagrams PDF
The mentioned slide represents strategy for software testing process as it comprises the part of software development cycle. It also includes framing plans and stating strategies, identifying of test data, structuring analysis, automatic testing etc. Presenting Continuous Strategies For Regular Improvement For Software Testing Process Diagrams PDF to dispense important information. This template comprises six stages. It also presents valuable insights into the topics including Structure Analysis, Automatic Testing, Strong Communication Between Teams. This is a completely customizable PowerPoint theme that can be put to use immediately. So, download it and address the topic impactfully.

Medical Insurance Claim Processing Workflow Slides PDF
This slide outlines claim processing flowchart aimed at helping processor check for its completeness, accuracy and ensure service is covered under the plan. It covers route of claim processing through NHAI towards CEO and office providers. Presenting Medical Insurance Claim Processing Workflow Slides PDF to dispense important information. This template comprises seven stages. It also presents valuable insights into the topics including Fulfilment, Vetting, Data Entry. This is a completely customizable PowerPoint theme that can be put to use immediately. So, download it and address the topic impactfully.

Investment Raising Pitch Deck Funds Allocation Fundraiser Event With Funds Usage Introduction PDF
This slide provides the glimpse about the fundraiser event details based on event goal, total income, expenditure, actual income and amount to achieve along with fundraiser sources and other information. Deliver an awe-inspiring pitch with this creative investment raising pitch deck funds allocation fundraiser event with funds usage introduction pdf bundle. Topics like event goal, total income, expenditure, actual income, information can be discussed with this completely editable template. It is available for immediate download depending on the needs and requirements of the user.

New Product Introduction In Market Existing Concerns Due To Ineffective Product Themes PDF
This slide provides information regarding present concerns faced by firm due to ineffective product introduction in terms of rise in product development cost, product failures and product delays. This slide provides information regarding present concerns faced by firm due to ineffective product introduction in terms of rise in product development cost, product failures and product delays. Deliver and pitch your topic in the best possible manner with this new product introduction in market existing concerns due to ineffective product themes pdf. Use them to share invaluable insights on product development cost, management team and impress your audience. This template can be altered and modified as per your expectations. So, grab it now.

Outstanding Payment Recovery Dashboards With Outbound And Inbound Communications Graphics PDF
This slide represents visually shows the loan recovery initiatives success in terms of debts breakdowns, amount pending, weekly inbound and outbound calls information. Pitch your topic with ease and precision using this outstanding payment recovery dashboards with outbound and inbound communications graphics pdf. This layout presents information on outstanding payment recovery dashboards with outbound and inbound communications. It is also available for immediate download and adjustment. So, changes can be made in the color, design, graphics or any other component to create a unique layout.

Inbound Marketing Channel KPI Dashboard To Measure Brand Measurement Awareness Pictures PDF
Mentioned slide highlights a inbound marketing dashboard which can be used by managers to measure brand campaign performance. Information covered in this slide is related to total visits, page views, web mentions, social shares, inbound traffic to the company website etc. Pitch your topic with ease and precision using this inbound marketing channel kpi dashboard to measure brand measurement awareness pictures pdf. This layout presents information on inbound marketing channel kpi dashboard to measure brand measurement awareness. It is also available for immediate download and adjustment. So, changes can be made in the color, design, graphics or any other component to create a unique layout.
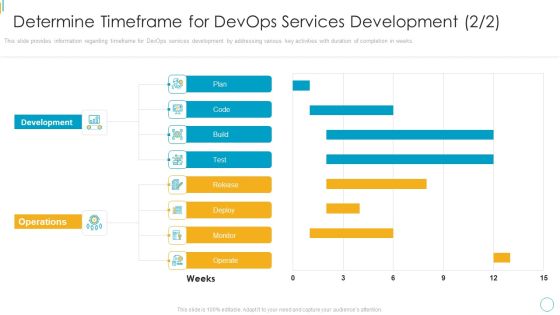
Devops Services Spectrum Proposal IT Determine Timeframe For Devops Services Development Pictures PDF
This slide provides information regarding timeframe for DevOps services development by addressing various key activities with duration of completion in weeks. This slide provides information regarding timeframe for DevOps services development by addressing various key activities with duration of completion in weeks. Deliver and pitch your topic in the best possible manner with this devops services spectrum proposal it determine timeframe for devops services development pictures pdf. Use them to share invaluable insights on cloud governance, cloud shared services, components and impress your audience. This template can be altered and modified as per your expectations. So, grab it now.
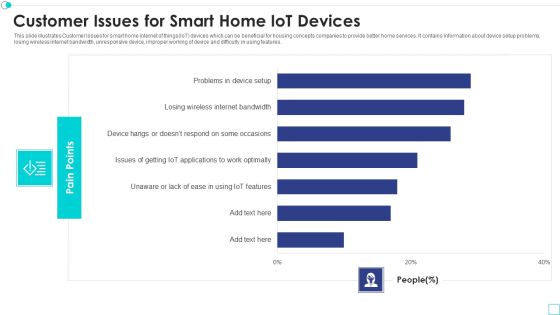
Customer Issues For Smart Home Iot Devices Designs PDF
This slide illustrates Customer Issues for smart home internet of things IoT devices which can be beneficial for housing concepts companies to provide better home services. It contains information about device setup problems, losing wireless internet bandwidth, unresponsive device, improper working of device and difficulty in using features. Pitch your topic with ease and precision using this stomer issues for smart home iot devices designs pdf. This layout presents information on customer issues for smart home iot devices. It is also available for immediate download and adjustment. So, changes can be made in the color, design, graphics or any other component to create a unique layout.

Flowchart Of Customer Journey With Painpoints Mapping Download PDF
This slide illustrates flowchart of customer journey with painpoints mapping beneficial for marketers to redesign customer experience in shopping. It contains information about customer, search, discovery, purchase, positive experience and painpoints. Pitch your topic with ease and precision using this flowchart of customer journey with painpoints mapping download pdf. This layout presents information on flowchart of customer journey with painpoints mapping. It is also available for immediate download and adjustment. So, changes can be made in the color, design, graphics or any other component to create a unique layout.
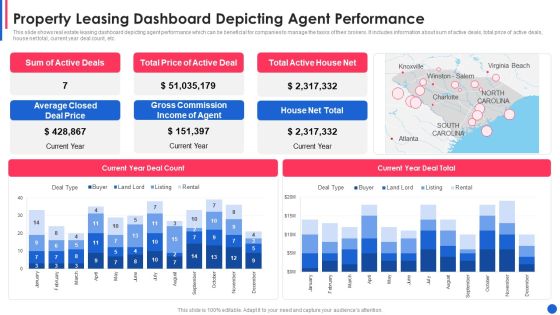
Property Leasing Dashboard Depicting Agent Performance Guidelines PDF
This slide shows real estate leasing dashboard depicting agent performance which can be beneficial for companies to manage the tasks of their brokers. It includes information about sum of active deals, total price of active deals, house net total, current year deal count, etc.Pitch your topic with ease and precision using this property leasing dashboard depicting agent performance guidelines pdf This layout presents information on average closed deal price, gross commission income, total active house net It is also available for immediate download and adjustment. So, changes can be made in the color, design, graphics or any other component to create a unique layout.

Real Estate Property Management Dashboard With Leasing Status Graphics PDF
This slide shows real estate property management dashboard with leasing status which can be referred by companies to have an overview about their performance. It includes information about revenue, properties, recent tasks, expired leases, outstanding balances, etc.Pitch your topic with ease and precision using this real estate property management dashboard with leasing status graphics pdf This layout presents information on property revenue overview, leases which are expiring, recent tasks It is also available for immediate download and adjustment. So, changes can be made in the color, design, graphics or any other component to create a unique layout.
SFA Dashboard To Track Performance Ppt PowerPoint Presentation Icon Example File PDF
This Slide visually represents sales force automation dashboard to track performance which can be utilized by marketing managers to streamline the process of automated selling. It includes information about sales pipeline, competitors, opportunities, key competitors, etc. Pitch your topic with ease and precision using this sfa dashboard to track performance ppt powerpoint presentation icon example file pdf. This layout presents information on sales pipeline, sales pipeline by sales rep, key competitors, forecast by month, key opportunities. It is also available for immediate download and adjustment. So, changes can be made in the color, design, graphics or any other component to create a unique layout.

Cyber Phishing Scams And Attacks Dashboard With Improvement Curve Sample PDF
Mentioned slide showcases a comprehensive dashboard used to measure the cyber phishing attacks. Information covered in this slide is related to organization health risk, attack vendors, most vulnerable employees to attacks, improvement curve. Pitch your topic with ease and precision using this cyber phishing scams and attacks dashboard with improvement curve sample pdf. This layout presents information on cyber phishing scams and attacks dashboard with improvement curve. It is also available for immediate download and adjustment. So, changes can be made in the color, design, graphics or any other component to create a unique layout.
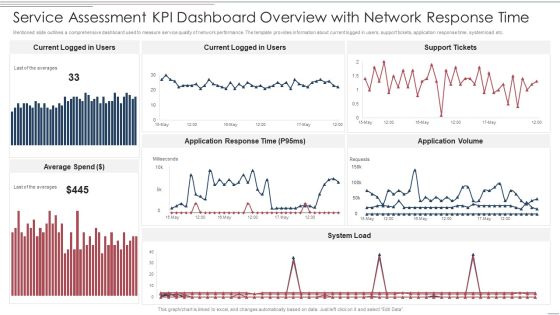
Service Assessment Kpi Dashboard Overview With Network Response Time Themes PDF
Mentioned slide outlines a comprehensive dashboard used to measure service quality of network performance. The template provides information about current logged in users, support tickets, application response time, system load etc. Pitch your topic with ease and precision using this Service Assessment Kpi Dashboard Overview With Network Response Time Themes PDF. This layout presents information on Average Spend, System Load, Application Response Time. It is also available for immediate download and adjustment. So, changes can be made in the color, design, graphics or any other component to create a unique layout.
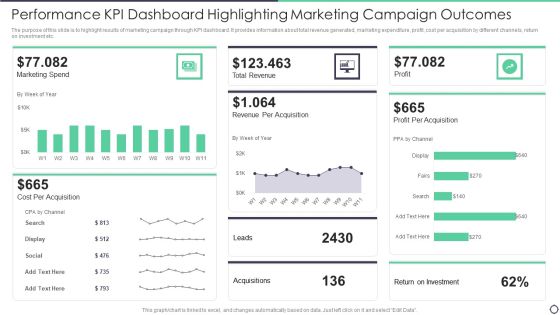
Performance Kpi Dashboard Highlighting Marketing Campaign Outcomes Topics PDF
The purpose of this slide is to highlight results of marketing campaign through KPI dashboard. It provides information about total revenue generated, marketing expenditure, profit, cost per acquisition by different channels, return on investment etc. Pitch your topic with ease and precision using this Performance Kpi Dashboard Highlighting Marketing Campaign Outcomes Topics PDF. This layout presents information on Cost, Marketing, Revenue. It is also available for immediate download and adjustment. So, changes can be made in the color, design, graphics or any other component to create a unique layout.
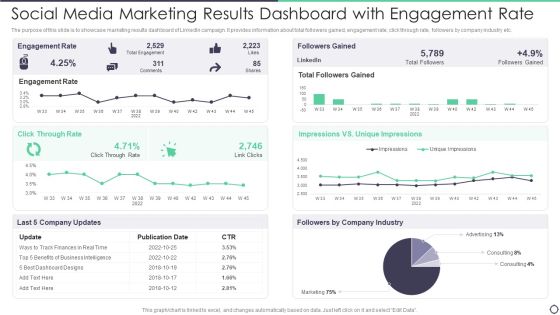
Social Media Marketing Results Dashboard With Engagement Rate Brochure PDF
The purpose of this slide is to showcase marketing results dashboard of LinkedIn campaign. It provides information about total followers gained, engagement rate, click through rate, followers by company industry etc. Pitch your topic with ease and precision using this Social Media Marketing Results Dashboard With Engagement Rate Brochure PDF. This layout presents information on Social Media Marketing Results Dashboard With Engagement Rate. It is also available for immediate download and adjustment. So, changes can be made in the color, design, graphics or any other component to create a unique layout.
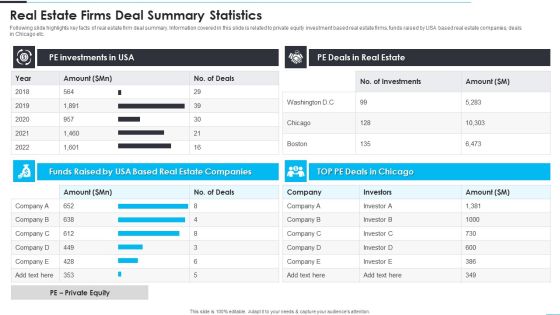
Real Estate Firms Deal Summary Statistics Demonstration PDF
Following slide highlights key facts of real estate firm deal summary. Information covered in this slide is related to private equity investment based real estate firms, funds raised by USA based real estate companies, deals in Chicago etc. Pitch your topic with ease and precision using this Real Estate Firms Deal Summary Statistics Demonstration PDF. This layout presents information on Real Estate Firms Deal Summary Statistics. It is also available for immediate download and adjustment. So, changes can be made in the color, design, graphics or any other component to create a unique layout.

Marketing Analytics Dashboard With Conversion Rate Summary PDF
The purpose of this slide is to outline marketing analytics dashboard. The dashboard provides information about key metrices such as total impressions, clicks, cost, conversion value, rate, ROAS, market share by different ad platforms etc. Pitch your topic with ease and precision using this Marketing Analytics Dashboard With Conversion Rate Summary PDF. This layout presents information on Marketing Analytics Dashboard With Conversion Rate. It is also available for immediate download and adjustment. So, changes can be made in the color, design, graphics or any other component to create a unique layout.

Team Mentoring Dashboard With Client And Training Details Sample PDF
This slide covers all the information related to the clients to whom coaching has been provided and in certain number of hours how many sessions they attended. It also includes the total earnings , coaching hours and the name of top clients.Pitch your topic with ease and precision using this Team Mentoring Dashboard With Client And Training Details Sample PDF This layout presents information on Team Mentoring Dashboard With Client And Training Details It is also available for immediate download and adjustment. So, changes can be made in the color, design, graphics or any other component to create a unique layout.
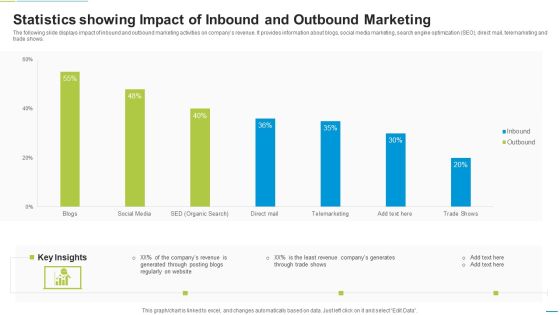
Statistics Showing Impact Of Inbound And Outbound Marketing Diagrams PDF
The following slide displays impact of inbound and outbound marketing activities on companys revenue. It provides information about blogs, social media marketing, search engine optimization SEO, direct mail, telemarketing and trade shows. Pitch your topic with ease and precision using this Statistics Showing Impact Of Inbound And Outbound Marketing Diagrams PDF. This layout presents information on Telemarketing, Social Media, Blogs. It is also available for immediate download and adjustment. So, changes can be made in the color, design, graphics or any other component to create a unique layout.

Online Audit Dashboard With Ad Cost And Conversions Themes PDF
Following slide outlines digital audit dashboard which will assist the company to track results of all paid campaigns. This dashboard provides information about various KPIs which the auditor can track such as AD cost, clicks, impressions, click through rate, cost per conversion, conversion rate etc. Pitch your topic with ease and precision using this Online Audit Dashboard With Ad Cost And Conversions Themes PDF. This layout presents information on Conversations, Impressions, Cost. It is also available for immediate download and adjustment. So, changes can be made in the color, design, graphics or any other component to create a unique layout.
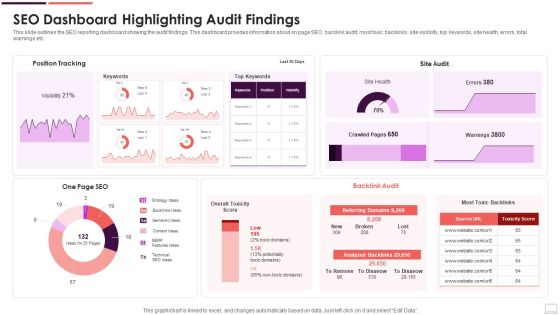
SEO Dashboard Highlighting Audit Findings Mockup PDF
This slide outlines the SEO reporting dashboard showing the audit findings. This dashboard provides information about on page SEO, backlink audit, most toxic backlinks, site visibility, top keywords, site health, errors, total warnings etc. Pitch your topic with ease and precision using this SEO Dashboard Highlighting Audit Findings Mockup PDF. This layout presents information on Strategy Ideas, Backlinks Ideas, Semantic Ideas. It is also available for immediate download and adjustment. So, changes can be made in the color, design, graphics or any other component to create a unique layout.

Skill Evaluation Dashboard With Turnover Rate Ideas PDF
Mentioned slide delineates talent assessment dashboard which will assist companies to frame efficient recruitment strategy. This dashboard provides detail information about hiring stats, talent turnover rate, talent rating, fired talents etc.Pitch your topic with ease and precision using this Skill Evaluation Dashboard With Turnover Rate Ideas PDF This layout presents information on Talent Management, Talent Satisfaction, Talent Rating It is also available for immediate download and adjustment. So, changes can be made in the color, design, graphics or any other component to create a unique layout.
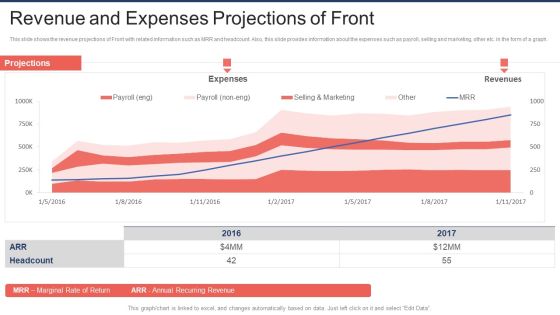
Front Capital Funding Revenue And Expenses Projections Of Front Ppt Portfolio Graphic Tips PDF
This slide shows the revenue projections of Front with related information such as MRR and headcount. Also, this slide provides information about the expenses such as payroll, selling and marketing, other etc. in the form of a graph. Deliver an awe inspiring pitch with this creative Front Capital Funding Revenue And Expenses Projections Of Front Ppt Portfolio Graphic Tips PDF bundle. Topics like Selling AND Marketing, Payroll Eng, Annual Recurring Revenue can be discussed with this completely editable template. It is available for immediate download depending on the needs and requirements of the user.

Workforce Department Performance Graph Ppt Model Graphics Pictures PDF
This slide shows performance graph of HR department. Information covered in this slide is related to total hirings and turnover in the last four years. Pitch your topic with ease and precision using this Workforce Department Performance Graph Ppt Model Graphics Pictures PDF. This layout presents information on New Hiring, Continuous Increase, Employee Turnover, 2019 To 2022. It is also available for immediate download and adjustment. So, changes can be made in the color, design, graphics or any other component to create a unique layout.

Leveraging Potential Technologies Beneficial To Ensure Cognitive Computing Background PDF
This slide provides information regarding leveraging potential technologies in order to ensure cognitive computing in order to optimize its overall functioning in terms of advanced digital analytics, customer insights, predictive analytics, etc. This slide provides information regarding at what extent the firm using the mentioned technologies and how much it will upgrade in upcoming months. Deliver and pitch your topic in the best possible manner with this Leveraging Potential Technologies Beneficial To Ensure Cognitive Computing Background PDF. Use them to share invaluable insights on Advanced Digital, Customer Insights, Predictive Analytics and impress your audience. This template can be altered and modified as per your expectations. So, grab it now.

Customers Declining Graph In Offline Store Ppt PowerPoint Presentation Professional Clipart PDF
This slide contains the information related to the number of numbers that are shifting form in-store purchasing to online shopping because of some factors. Pitch your topic with ease and precision using this Customers Declining Graph In Offline Store Ppt PowerPoint Presentation Professional Clipart PDF. This layout presents information on Customers Choosing, Store Purchase, Time Saving. It is also available for immediate download and adjustment. So, changes can be made in the color, design, graphics or any other component to create a unique layout.

Fashion Marketing And Advertisement Analysis Dashboard Ppt PowerPoint Presentation Gallery Topics PDF
This slide defines the dashboard for fashion marketing and Advertisement revenue analysis . It includes information related to the revenue, sales, brands and gender breakdown. Pitch your topic with ease and precision using this Fashion Marketing And Advertisement Analysis Dashboard Ppt PowerPoint Presentation Gallery Topics PDF. This layout presents information on Total Revenue, Total Brands, Total Sales. It is also available for immediate download and adjustment. So, changes can be made in the color, design, graphics or any other component to create a unique layout.

Business Performance Review Dashboard With Customer Acquisition Cost Diagrams PDF
The following slide highlights KPI dashboard which can be used for quarterly business review QBR. It provides detailed information about actual revenue vs target, number of new customers, average revenue per customer, customer acquisition cost CAC etc. Pitch your topic with ease and precision using this Business Performance Review Dashboard With Customer Acquisition Cost Diagrams PDF. This layout presents information on Revenue, Customer Acquisition Cost, Current Quarter. It is also available for immediate download and adjustment. So, changes can be made in the color, design, graphics or any other component to create a unique layout.

Business Performance Review Report To Evaluate Performance Of Sales Rep Infographics PDF
The following slide highlights quarterly business review QBR report which can be used by firm to evaluate the efficiency of sales rep. information covered in this slide is related to total sales by employees in different quarters, number of calls made. Pitch your topic with ease and precision using this Business Performance Review Report To Evaluate Performance Of Sales Rep Infographics PDF. This layout presents information on Revenue Sales, Tim Paine, Number Colds Calls. It is also available for immediate download and adjustment. So, changes can be made in the color, design, graphics or any other component to create a unique layout.

Financial Unsatisfactory Performance Dashboard With Accounting Ratios Diagrams PDF
This slide contains the information of the financial sector of the company to know where it stands and what needs to be done to improve the performance.It includes multiple ratios ROA, ROE, working capital ration and debt-equity ratio. Pitch your topic with ease and precision using this Financial Unsatisfactory Performance Dashboard With Accounting Ratios Diagrams PDF. This layout presents information on Return Assets, Working Capital, Return Equity. It is also available for immediate download and adjustment. So, changes can be made in the color, design, graphics or any other component to create a unique layout.

CIO For IT Cost Optimization Techniques Cios Initiative 5 Enabling Project Portfolio Management Designs PDF
This slide provides information regarding CIOs initiative for project portfolio management in order to handle various project on prioritizing them based on success rate, risk, resource allocated, etc. in order to increase savings to maximize innovation. Deliver and pitch your topic in the best possible manner with this CIO For IT Cost Optimization Techniques Cios Initiative 5 Enabling Project Portfolio Management Designs PDF. Use them to share invaluable insights on Innovation, Assessing Potential Projects, Determine Information and impress your audience. This template can be altered and modified as per your expectations. So, grab it now.
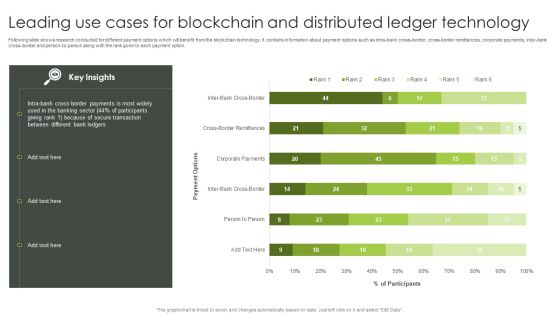
Leading Use Cases For Blockchain And Distributed Ledger Technology Slides PDF
Following slide shows research conducted for different payment options which will benefit from the blockchain technology. It contains information about payment options such as intra-bank cross-border, cross-border remittances, corporate payments, inter-bank cross-border and person-to-person along with the rank given to each payment option. Pitch your topic with ease and precision using this Leading Use Cases For Blockchain And Distributed Ledger Technology Slides PDF. This layout presents information on Person To Person, Corporate Payments, Cross Border Remittances. It is also available for immediate download and adjustment. So, changes can be made in the color, design, graphics or any other component to create a unique layout.

Social Network Promotion Campaign Performance Report Demonstration PDF
The purpose of this slide is to highlight the digital marketing campaigning performance report to track information in real-time like new leads acquired, total leads, and revenue on monthly basis. The leads generated through various platforms are Twitter, Facebook, LinkedIn, etc. Pitch your topic with ease and precision using this Social Network Promotion Campaign Performance Report Demonstration PDF. This layout presents information on Sales Ready Leads, New Leads, New Revenue. It is also available for immediate download and adjustment. So, changes can be made in the color, design, graphics or any other component to create a unique layout.
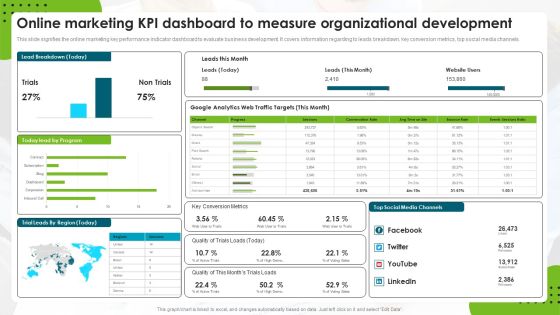
Online Marketing Kpi Dashboard To Measure Organizational Development Rules PDF
This slide signifies the online marketing key performance indicator dashboard to evaluate business development. It covers information regarding to leads breakdown, key conversion metrics, top social media channels. Pitch your topic with ease and precision using this Online Marketing Kpi Dashboard To Measure Organizational Development Rules PDF. This layout presents information on Web Traffic Targets, Google Analytics, Social Media Channels. It is also available for immediate download and adjustment. So, changes can be made in the color, design, graphics or any other component to create a unique layout.

Insider Threat In Cyber Security Discovery Flowchart Of IT Company Template PDF
This slide shows information technology company flowchart indicating insider threat discovery. It provides information such as user request for service, authentication check, starting session, role based access control RBAC, permission checks, etc. Persuade your audience using this Insider Threat In Cyber Security Discovery Flowchart Of IT Company Template PDF. This PPT design covers one stages, thus making it a great tool to use. It also caters to a variety of topics including Terminate Session, Allow Access, Authentication Service. Download this PPT design now to present a convincing pitch that not only emphasizes the topic but also showcases your presentation skills.
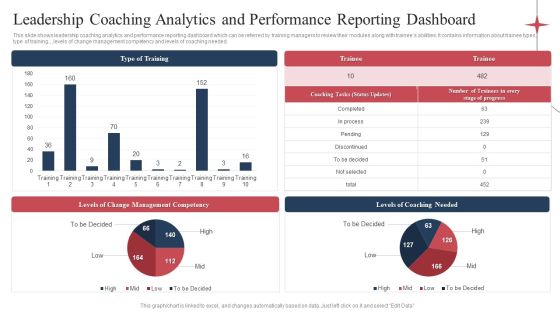
Leadership Coaching Analytics And Performance Reporting Dashboard Demonstration PDF
This slide shows leadership coaching analytics and performance reporting dashboard which can be referred by training managers to review their modules along with trainees abilities. It contains information about trainee types, type of training., ,levels of change management competency and levels of coaching needed. Pitch your topic with ease and precision using this Leadership Coaching Analytics And Performance Reporting Dashboard Demonstration PDF. This layout presents information on Levels Coaching Needed, Levels Change Management, Type Training. It is also available for immediate download and adjustment. So, changes can be made in the color, design, graphics or any other component to create a unique layout.

Commodity Marketing KPI Dashboard For International Business Expansion Formats PDF
This slide signifies the product marketing key performance indicator dashboard for international business expansion. It covers information about sales, target, target achievement, gross profit margin, sales by region, growth and inventory outstanding.Pitch your topic with ease and precision using this Commodity Marketing KPI Dashboard For International Business Expansion Formats PDF. This layout presents information on Target Achievement, Receivale Days, Gross Profit. It is also available for immediate download and adjustment. So, changes can be made in the color, design, graphics or any other component to create a unique layout.

Key Statistics For Commodity Expansion In International Market Pictures PDF
This slide signifies the key stats for business commodity expansion in international market. It covers information about goods like food delivery, hygiene, household cleaning, clothing and health care products.Pitch your topic with ease and precision using this Key Statistics For Commodity Expansion In International Market Pictures PDF. This layout presents information on Product Expansion, Household Cleaning, Items Ranges. It is also available for immediate download and adjustment. So, changes can be made in the color, design, graphics or any other component to create a unique layout.

Oil Production And Manufacturing Annual Growth By Region Graphics PDF
This slide covers the information on the region wise. annual growth of crude oil manufacturing. It also includes 4 regions Europe, Middle East, Latin America and Asia. Pitch your topic with ease and precision using this Oil Production And Manufacturing Annual Growth By Region Graphics PDF. This layout presents information on Average Production, Manufacturing Annual Growth. It is also available for immediate download and adjustment. So, changes can be made in the color, design, graphics or any other component to create a unique layout.
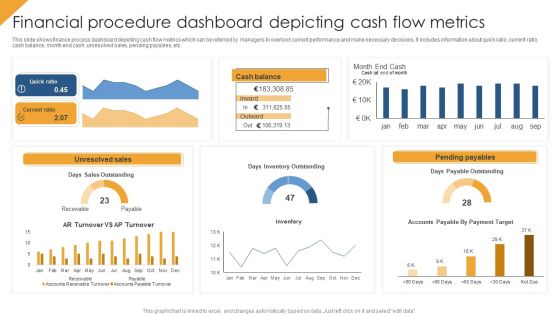
Financial Procedure Dashboard Depicting Cash Flow Metrics Structure PDF
This slide shows finance process dashboard depicting cash flow metrics which can be referred by managers to overlook current performance and make necessary decisions. It includes information about quick ratio, current ratio, cash balance, month end cash, unresolved sales, pending payables, etc. Pitch your topic with ease and precision using this Financial Procedure Dashboard Depicting Cash Flow Metrics Structure PDF. This layout presents information on Quick Ratio, Unresolved Sales, Pending Payables. It is also available for immediate download and adjustment. So, changes can be made in the color, design, graphics or any other component to create a unique layout.

Kpi Dashboard To Track Video Promotion Techniques Ppt Summary Guide PDF
This slide signifies the key performance indicator dashboard to measure video promotion techniques. It covers information regarding to the page visit, post reach, summary, click action on page. Pitch your topic with ease and precision using this Kpi Dashboard To Track Video Promotion Techniques Ppt Summary Guide PDF. This layout presents information on Page Visit, Page Summary, Post Overview. It is also available for immediate download and adjustment. So, changes can be made in the color, design, graphics or any other component to create a unique layout.

Video Promotion Techniques To Enhance Customer Engagement Rate Ppt Portfolio Images PDF
This slide signifies the key statistics on video promotion techniques to increase customer engagement rate. It covers information regarding to Twitter, Facebook, YouTube, Instagram and Snapchat. Pitch your topic with ease and precision using this Video Promotion Techniques To Enhance Customer Engagement Rate Ppt Portfolio Images PDF. This layout presents information on Facebook, Snapchat, Instagram, YouTube. It is also available for immediate download and adjustment. So, changes can be made in the color, design, graphics or any other component to create a unique layout.

KPI Dashboard To Measure Performance Post Implementing Video Promotion Techniques Ideas PDF
This slide signifies the key performance indicator dashboard to measure performance post implementing video promotion techniques. It covers information regarding to the engagement rate, audience retention, views and click through rate. Pitch your topic with ease and precision using this KPI Dashboard To Measure Performance Post Implementing Video Promotion Techniques Ideas PDF. This layout presents information on Engagement, Audience Retention, Watch Time. It is also available for immediate download and adjustment. So, changes can be made in the color, design, graphics or any other component to create a unique layout.

Dashboard For Analyzing Hiring Status In Organization Ppt PowerPoint Presentation Gallery Images PDF
This slide defines the analysis dashboard for recruitment status. It includes information related to hiring funnel, age of applicants, and male and female ratio. Pitch your topic with ease and precision using this Dashboard For Analyzing Hiring Status In Organization Ppt PowerPoint Presentation Gallery Images PDF. This layout presents information on Recruitment Funnel, Time To Hire, Age Applicants. It is also available for immediate download and adjustment. So, changes can be made in the color, design, graphics or any other component to create a unique layout.

Vendor Management To Handle Purchase Impact Analysis Of Vendors Performance Improvement Designs PDF
The following slide showcases impact analysis of vendors performance improvement. It provides information about delivery, efficient production process, flexibility, quality of products, integration with information systems, etc. Deliver and pitch your topic in the best possible manner with this Vendor Management To Handle Purchase Impact Analysis Of Vendors Performance Improvement Designs PDF. Use them to share invaluable insights on Improvement Areas, Improvement Witnessed, Production Processes and impress your audience. This template can be altered and modified as per your expectations. So, grab it now.

Improve IT Service Desk Service Desk Dashboard For Monitoring IT Infrastructure Introduction PDF
This slide illustrates service desk dashboard for monitoring information technology IT infrastructure. It provides information about issues, safety inspection, problem servers, workstations, operating system, Windows, Mac, Linux, etc.Deliver and pitch your topic in the best possible manner with this Improve IT Service Desk Service Desk Dashboard For Monitoring IT Infrastructure Introduction PDF. Use them to share invaluable insights on Problem Servers, Problem Workstations, Operating System and impress your audience. This template can be altered and modified as per your expectations. So, grab it now.

Business To Business Model Lead Management Dashboard Ppt Portfolio Backgrounds PDF
This slide showcases business to business b2b lead management dashboard. It provides information about lead funnel, pipeline, sales, opportunities, campaign, status, primary offer, etc. Pitch your topic with ease and precision using this Business To Business Model Lead Management Dashboard Ppt Portfolio Backgrounds PDF. This layout presents information on Leads Generated, Pipeline Generated, Sales Generated, Opportunities. It is also available for immediate download and adjustment. So, changes can be made in the color, design, graphics or any other component to create a unique layout.

Monthly Business Operational Expenditure Bar Graph With Projected And Actual Expenses Introduction PDF
This slide shows monthly operating expenditure opex with projected and actual expenses which can be referred by companies to align budget with expenses effectively. It also provides information about machinery rent, personnel benefits, building rent, equipment, professional fees, etc. Pitch your topic with ease and precision using this Monthly Business Operational Expenditure Bar Graph With Projected And Actual Expenses Introduction PDF. This layout presents information on Projected Expenses, Costs, Service. It is also available for immediate download and adjustment. So, changes can be made in the color, design, graphics or any other component to create a unique layout.

Business Operational Expenditure Dashboard Indicating Revenue And Costs Metrics Pictures PDF
This slide shows operating expenses OPEX dashboard indicating revenue and costs metrics which can be referred by companies to manage various operating expenses of various departments. It contains information about cost center, revenue per company, company code, etc. Pitch your topic with ease and precision using this Business Operational Expenditure Dashboard Indicating Revenue And Costs Metrics Pictures PDF. This layout presents information on Business Operational, Costs Metrics, Revenue. It is also available for immediate download and adjustment. So, changes can be made in the color, design, graphics or any other component to create a unique layout.

Business Revenue Bar Graph With Business Operational Expenditure Details Summary PDF
This slide represents business revenue bar graph with OPEX details which can be referred by companies to earn more revenue by controlling expenditures. It also provides information about marketing and sales, research and development, administration, total revenue, etc. Pitch your topic with ease and precision using this Business Revenue Bar Graph With Business Operational Expenditure Details Summary PDF. This layout presents information on Cost Of Marketing, Sales, Highest Amount. It is also available for immediate download and adjustment. So, changes can be made in the color, design, graphics or any other component to create a unique layout.

KPI Dashboard To Measure Performance Of B2B Promotional Communication Strategy Mockup PDF
The following slides outline the key performance indicator dashboard to track performance of B2B marketing communication approach. It covers information about pipeline deals, revenue by campaign, email engagement and landing page completion. Pitch your topic with ease and precision using this KPI Dashboard To Measure Performance Of B2B Promotional Communication Strategy Mockup PDF. This layout presents information on Pipeline Deals, Engagement Health, Email Engagement. It is also available for immediate download and adjustment. So, changes can be made in the color, design, graphics or any other component to create a unique layout.
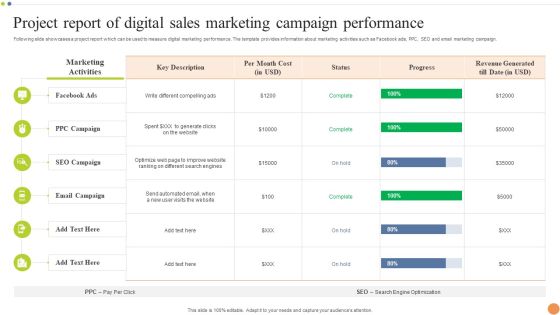
Project Report Of Digital Sales Marketing Campaign Performance Professional PDF
Following slide showcases a project report which can be used to measure digital marketing performance. The template provides information about marketing activities such as Facebook ads, PPC, SEO and email marketing campaign. Pitch your topic with ease and precision using this Project Report Of Digital Sales Marketing Campaign Performance Professional PDF. This layout presents information on Email Campaign, SEO Campaign, Marketing Activities. It is also available for immediate download and adjustment. So, changes can be made in the color, design, graphics or any other component to create a unique layout.

Managing Cyber Security Incident Response KPI Dashboard Ppt Layouts Shapes PDF
This slide covers cyber security incident response KPI dashboard. It involves details such as intent alarm, event trend sources, event trend, sensor activity, major operating systems and asset information. Pitch your topic with ease and precision using this Managing Cyber Security Incident Response KPI Dashboard Ppt Layouts Shapes PDF. This layout presents information on Top Alarms Method, Alarms Intent, Timely Event Trend. It is also available for immediate download and adjustment. So, changes can be made in the color, design, graphics or any other component to create a unique layout.
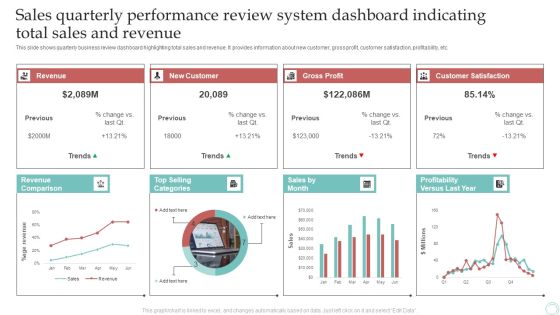
Sales Quarterly Performance Review System Dashboard Indicating Total Sales And Revenue Download PDF
This slide shows quarterly business review dashboard highlighting total sales and revenue. It provides information about new customer, gross profit, customer satisfaction, profitability, etc. Pitch your topic with ease and precision using this Sales Quarterly Performance Review System Dashboard Indicating Total Sales And Revenue Download PDF. This layout presents information on Revenue, New Customer, Gross Profit. It is also available for immediate download and adjustment. So, changes can be made in the color, design, graphics or any other component to create a unique layout.

Change Order Administration Dashboard With Priority Assessment Ppt Portfolio Inspiration PDF
This slide showcases change order management dashboard with priority assessment. It provides information about order stats, summary, latest change orders and priority according to rank. Pitch your topic with ease and precision using this Change Order Administration Dashboard With Priority Assessment Ppt Portfolio Inspiration PDF. This layout presents information on Change Orders Priority, Change Order Stats, Change Orders Summary. It is also available for immediate download and adjustment. So, changes can be made in the color, design, graphics or any other component to create a unique layout.

Continuous Integration Dashboard For Automated Testing Framework Ppt Layouts Layout Ideas PDF
This slide shows continuous integration dashboard for test automation framework which can be referred by authors to review their testing performance. It contains information about weekly change volume by author, monthly change volume by author, repository, etc. Pitch your topic with ease and precision using this Continuous Integration Dashboard For Automated Testing Framework Ppt Layouts Layout Ideas PDF. This layout presents information on Total Changes Volume, Monthly Change Volume, Weekly Change Volume. It is also available for immediate download and adjustment. So, changes can be made in the color, design, graphics or any other component to create a unique layout.
