AI PPT Maker
Templates
PPT Bundles
Design Services
Business PPTs
Business Plan
Management
Strategy
Introduction PPT
Roadmap
Self Introduction
Timelines
Process
Marketing
Agenda
Technology
Medical
Startup Business Plan
Cyber Security
Dashboards
SWOT
Proposals
Education
Pitch Deck
Digital Marketing
KPIs
Project Management
Product Management
Artificial Intelligence
Target Market
Communication
Supply Chain
Google Slides
Research Services
 One Pagers
All Categories
-
Home
- Customer Favorites
- Conclusion
Conclusion

Mergers And Acquisitions Strategies Diagram Ppt Sample Presentations
This is a mergers and acquisitions strategies diagram ppt sample presentations. This is a five stage process. The stages in this process are input, define your strategy, identify and initiate prospects, structure and value transaction, output.

Economic Growth Ppt Layout Powerpoint Show
This is a economic growth ppt layout powerpoint show. This is a four stage process. The stages in this process are increased savings, increased investment, economic growth, increased output.

Calendar Management Ppt Layout Powerpoint Slide Designs
This is a calendar management ppt layout powerpoint slide designs. This is a seven stage process. The stages in this process are input, level of accuracy, unit of measure, project scheduled, tools and techniques, repotting format, output.

Costing Solution Diagram Powerpoint Presentation
This is a costing solution diagram powerpoint presentation. This is a six stage process. The stages in this process are equivalent production, computation of cost, valuation of output units, raw material expenses, process costs, tool cost.
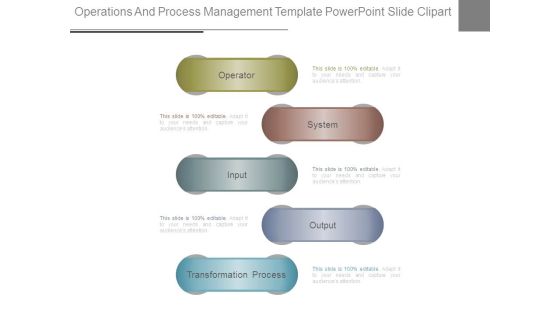
Operations And Process Management Template Powerpoint Slide Clipart
This is a operations and process management template powerpoint slide clipart. This is a five stage process. The stages in this process are operator, system, input, output, transformation process.
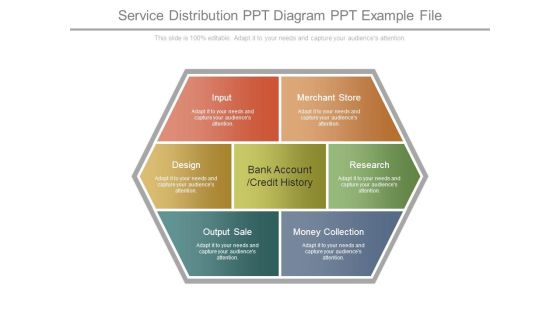
Service Distribution Ppt Diagram Ppt Example File
This is a seo service distribution ppt diagram ppt example file. This is a seven stage process. The stages in this process are input, design, output sale, bank account credit history, merchant store, research, money collection.
Sipoc Process With Icons Ppt Images Gallery
This is a sipoc process with icons ppt images gallery. This is a five stage process. The stages in this process are start, finish, suppliers, input, process, output, customer, sipoc.

Data Driven Control Chat Powerpoint Slide Themes
This is a data driven control chat powerpoint slide themes. This is a one stage process. The stages in this process are process output, upper control limit, statistical process control, lower control limit.
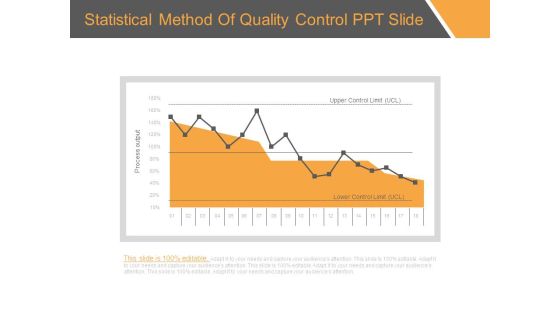
Statistical Method Of Quality Control Ppt Slide
This is a statistical method of quality control ppt slide. This is a one stage process. The stages in this process are process output, upper control limit, lower control limit.

Sipoc Process Infogarphic Chart Powerpoint Slide Influencers
This is a sipoc process infogarphic chart powerpoint slide influencers. This is a five stage process. The stages in this process are suppliers, input, process, output, customer, start, finish, sipoc.
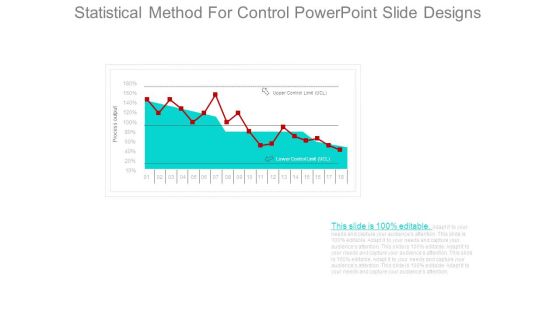
Statistical Method For Control Powerpoint Slide Designs
This is a statistical method for control powerpoint slide designs. This is a one stage process. The stages in this process are process output, upper control limit, lower control limit.
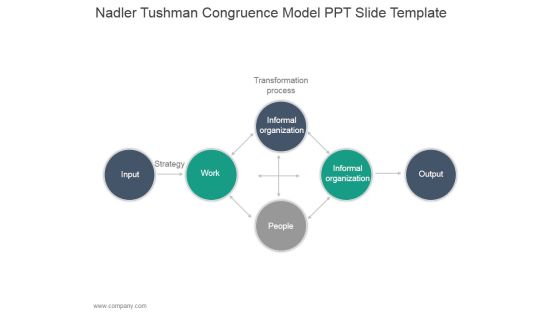
Nadler Tushman Congruence Model Ppt PowerPoint Presentation Design Ideas
This is a nadler tushman congruence model ppt powerpoint presentation design ideas. This is a six stage process. The stages in this process are transformation process, input, strategy, work, informal organization, informal organization, people, output.
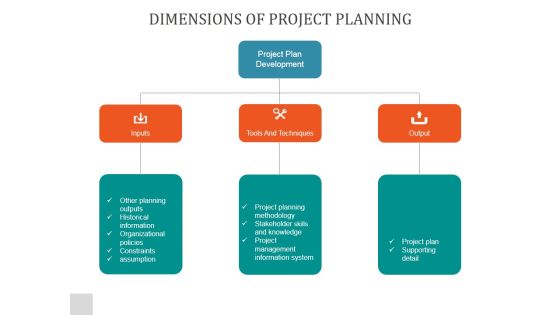
Dimensions Of Project Planning Ppt PowerPoint Presentation Outline
This is a dimensions of project planning ppt powerpoint presentation outline. This is a three stage process. The stages in this process are project plan development, inputs, tools and techniques, output.
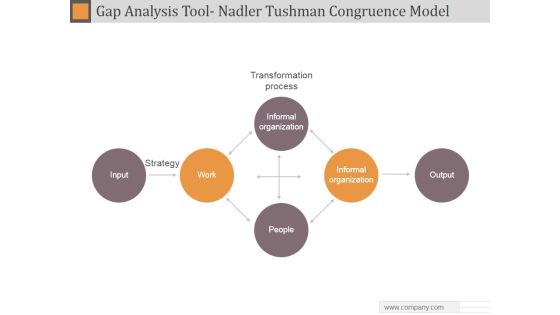
Gap Analysis Tool Nadler Tushman Congruence Model Ppt PowerPoint Presentation Samples
This is a gap analysis tool nadler tushman congruence model ppt powerpoint presentation samples. This is a four stage process. The stages in this process are transformation process, strategy, input, work, informal organization, output, people.

Auditing Quality Ppt PowerPoint Presentation Deck
This is a auditing quality ppt powerpoint presentation deck. This is a three stage process. The stages in this process are audit quality, inputs, outputs, people, auditor, regulators, users.
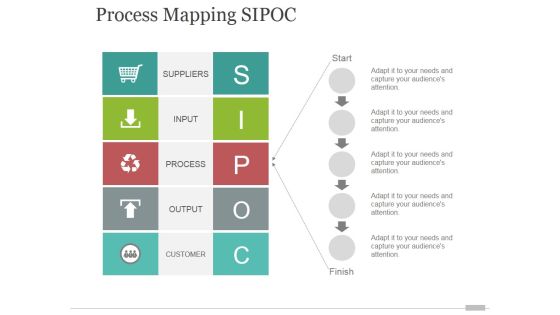
Process Mapping Sipoc Tamplate 1 Ppt PowerPoint Presentation Outline
This is a process mapping sipoc tamplate 1 ppt powerpoint presentation outline. This is a five stage process. The stages in this process are suppliers, input, process, output, customer, start, finish.

Process Mapping Sipoc Tamplate 2 Ppt PowerPoint Presentation Background Images
This is a process mapping sipoc tamplate 2 ppt powerpoint presentation background images. This is a five stage process. The stages in this process are suppliers, process, customers, input, output.

Dimensions Of Project Planning Ppt PowerPoint Presentation Styles
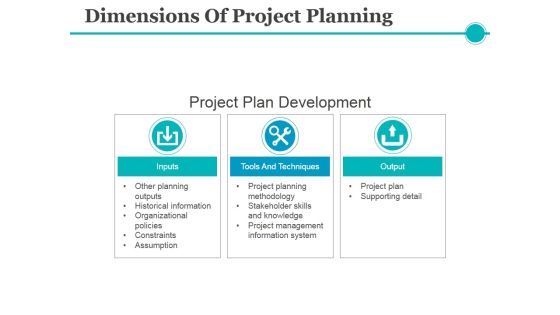
This is a dimensions of project planning ppt powerpoint presentation styles. This is a three stage process. The stages in this process are other planning outputs, historical information, organizational policies, constraints, assumption, project plan, supporting detail.

Break Even Analysis Ppt PowerPoint Presentation Deck
This is a break even analysis ppt powerpoint presentation deck. This is a five stage process. The stages in this process are key comments on the table, units of output, fixed cost, variable cost.
Dimensions Of Project Planning Ppt PowerPoint Presentation Gallery Professional
This is a dimensions of project planning ppt powerpoint presentation gallery professional. This is a three stage process. The stages in this process are inputs, tools and techniques, output.
Gap Analysis Tool Nadler Tushman Congruence Model Ppt PowerPoint Presentation Slides Guidelines
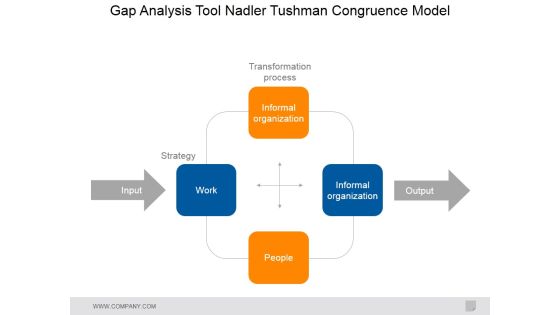
This is a gap analysis tool nadler tushman congruence model ppt powerpoint presentation slides guidelines. This is a four stage process. The stages in this process are transformation process, strategy, people, output, input, work, informal organization, informal organization.
Gap Analysis Tool Nadler Tushman Congruence Model Ppt PowerPoint Presentation Styles Display
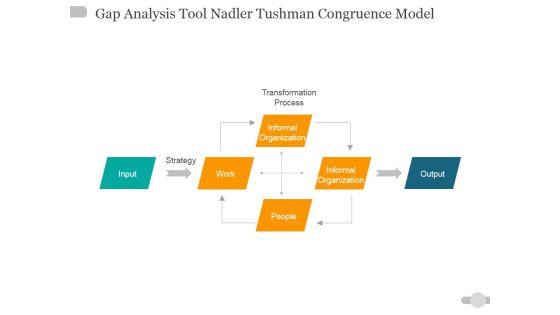
This is a gap analysis tool nadler tushman congruence model ppt powerpoint presentation styles display. This is a four stage process. The stages in this process are work, informal organization, informal organization, people, input, output.

Dimensions Of Project Planning Ppt PowerPoint Presentation Model Graphic Images
This is a dimensions of project planning ppt powerpoint presentation model graphic images. This is a three stage process. The stages in this process are inputs, tools and techniques, output.

Break Even Analysis Ppt PowerPoint Presentation Inspiration Templates
This is a break even analysis ppt powerpoint presentation inspiration templates. This is a five stage process. The stages in this process are units of output, fixed cost, variable cost, total cost, sales revenue, profit.
Gap Analysis Tool Nadler Tushman Congruence Model Ppt Powerpoint Presentation Outline Ideas
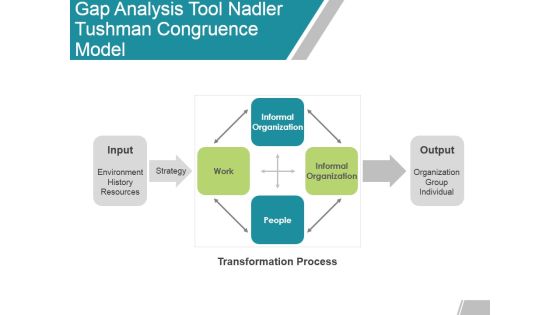
This is a gap analysis tool nadler tushman congruence model ppt powerpoint presentation outline ideas. This is a six stage process. The stages in this process are input, output, work, informal organization, people.

Break Even Analysis Ppt PowerPoint Presentation Summary Background Designs
This is a break even analysis ppt powerpoint presentation summary background designs. This is a five stage process. The stages in this process are units of output, fixed cost, variable cost, total cost, sales revenue.

Gap Analysis Tool Nadler Tushman Congruence Model Ppt PowerPoint Presentation Layouts Slides
This is a gap analysis tool nadler tushman congruence model ppt powerpoint presentation layouts slides. This is a four stage process. The stages in this process are input, strategy, work, people, output.

Breakeven Analysis Ppt PowerPoint Presentation Summary Example Introduction
This is a breakeven analysis ppt powerpoint presentation summary example introduction. This is a six stage process. The stages in this process are units of output, key comments on the table, data, table, analysis.

Process Mapping Sipoc Template 1 Ppt PowerPoint Presentation Layouts Example Topics
This is a process mapping sipoc template 1 ppt powerpoint presentation layouts example topics. This is a five stage process. The stages in this process are customers, output, process, input, suppliers.

Process Mapping Sipoc Template 2 Ppt PowerPoint Presentation Show Outfit
This is a process mapping sipoc template 2 ppt powerpoint presentation show outfit. This is a five stage process. The stages in this process are suppliers, input, process, output, customers.

Statistical Process Control Ppt PowerPoint Presentation Portfolio Design Ideas
This is a statistical process control ppt powerpoint presentation portfolio design ideas. This is a one stage process. The stages in this process are process output, upper control limit, series, business, marketing.

Breakeven Analysis Ppt PowerPoint Presentation Professional Design Templates
This is a breakeven analysis ppt powerpoint presentation professional design templates. This is a six stage process. The stages in this process are units of output, fixed cost, variable cost, total cost, sales revenue.

Break Even Analysis Ppt PowerPoint Presentation Layouts Portrait
This is a break even analysis ppt powerpoint presentation layouts portrait. This is a six stage process. The stages in this process are key comments on the table, units of output, total cost, sales revenue, profit.
Sipoc Analysis Ppt PowerPoint Presentation Icon Information
This is a sipoc analysis ppt powerpoint presentation icon information. This is a two stage process. The stages in this process are process project name, suppliers, inputs, process, outputs.

Break Even Analysis Ppt PowerPoint Presentation Portfolio Clipart
This is a break even analysis ppt powerpoint presentation portfolio clipart. This is a five stage process. The stages in this process are fixed cost, variable cost, sales revenue, profit, key comments on the table, units of output.

Break Even Analysis Ppt PowerPoint Presentation Styles Influencers
This is a break even analysis ppt powerpoint presentation styles influencers. This is a five stage process. The stages in this process are units of output, fixed cost, variable cost, total cost, sales revenue.

Break Even Analysis Ppt PowerPoint Presentation Styles Template
This is a break even analysis ppt powerpoint presentation styles template. This is a five stage process. The stages in this process are fixed cost, variable cost, key comments on the table, units of output, business.

Design Section Work Ppt PowerPoint Presentation Ideas Icon
This is a design section work ppt powerpoint presentation ideas icon. This is a six stage process. The stages in this process are sketching, improve design, final output, concept, brainstorm.

Design Section Work Ppt PowerPoint Presentation Portfolio Graphics
This is a design section work ppt powerpoint presentation portfolio graphics. This is a six stage process. The stages in this process are sketching, brainstorm, improve design, final output, concept.

Design Section Work Ppt PowerPoint Presentation Layouts Objects
This is a design section work ppt powerpoint presentation layouts objects. This is a six stage process. The stages in this process are concept, time and schedule, brainstorm, sketching, improve design, final output.

Design Section Work Ppt PowerPoint Presentation Show Background Image
This is a design section work ppt powerpoint presentation show background image. This is a six stage process. The stages in this process are concept, time and schedule, brainstorm, sketching, improve design, final output.

Break Even Analysis Ppt PowerPoint Presentation Outline Example Topics
This is a break even analysis ppt powerpoint presentation outline example topics. This is a five stage process. The stages in this process are units of output, variable, fixed cost, total cost, sales revenue.

Break Even Analysis Ppt PowerPoint Presentation Pictures Good
This is a break even analysis ppt powerpoint presentation pictures good. This is a five stage process. The stages in this process are key comments on the table, units of output, fixed cost, variable cost, sales revenue.

Break Even Analysis Ppt PowerPoint Presentation Portfolio Graphics Design
This is a break even analysis ppt powerpoint presentation portfolio graphics design. This is a five stage process. The stages in this process are units of output, fixed cost, variable cost, total cost, sales revenue.
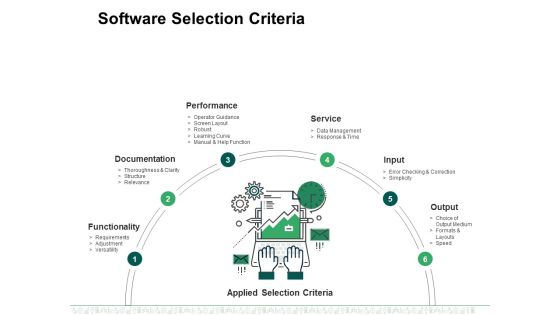
Software Selection Criteria Template 2 Ppt PowerPoint Presentation Visual Aids Pictures
This is a software selection criteria template 2 ppt powerpoint presentation visual aids pictures. This is a six stage process. The stages in this process are functionality, documentation, performance, service, output.

Control Charts Time Sequence Ppt PowerPoint Presentation Layouts Microsoft
This is a control charts time sequence ppt powerpoint presentation layouts microsoft. This is a one stage process. The stages in this process are average output, upper control limit, lower control limit, finance, business.

Post Merger Integration Business Process Heterogeneity Ppt PowerPoint Presentation Ideas Topics
This is a post merger integration business process heterogeneity ppt powerpoint presentation ideas topics. This is a four stage process. The stages in this process are products, customers, regions, output ratio, business.

Customer Requirements Icons Process Ppt PowerPoint Presentation Outline Graphic Images
This is a customer requirements icons process ppt powerpoint presentation outline graphic images. This is a five stage process. The stages in this process are supplier, input, process, outputs, customer.

Business Process Efficiency And Innovation Ppt Powerpoint Presentation Infographics Slide Portrait
This is a business process efficiency and innovation ppt powerpoint presentation infographics slide portrait. This is a five stage process. The stages in this process are productivity improvement, output improvement, productivity enhancement.

Business Strategy For Innovation And Operational Efficiency Ppt Powerpoint Presentation Slides Picture
This is a business strategy for innovation and operational efficiency ppt powerpoint presentation slides picture. This is a four stage process. The stages in this process are productivity improvement, output improvement, productivity enhancement.

Data Collection And Analysis Ppt Powerpoint Presentation Icon Example Topics
This is a data collection and analysis ppt powerpoint presentation icon example topics. This is a four stage process. The stages in this process are productivity improvement, output improvement, productivity enhancement.
Growth Arrows With Dollar Signs For Operational Efficiency Ppt Powerpoint Presentation Icon Smartart
This is a growth arrows with dollar signs for operational efficiency ppt powerpoint presentation icon smartart. This is a five stage process. The stages in this process are productivity improvement, output improvement, productivity enhancement..

Innovation Model Of Productivity Enhancement Ppt Powerpoint Presentation Pictures Summary
This is a innovation model of productivity enhancement ppt powerpoint presentation pictures summary. This is a four stage process. The stages in this process are productivity improvement, output improvement, productivity enhancement.
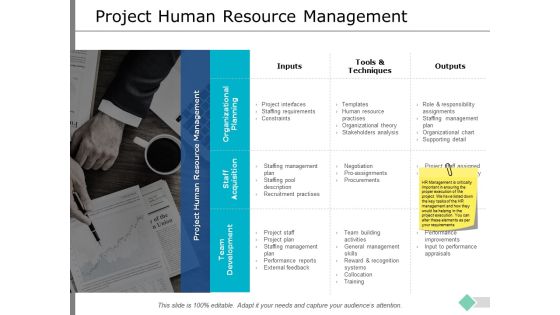
Project Human Resource Management Ppt PowerPoint Presentation Infographic Template Graphics Example
This is a project human resource management ppt powerpoint presentation infographic template graphics example. This is a three stage process. The stages in this process are inputs, outputs, staff acquisition, organizational planning, team development.

Quarterly Project Summary Progress Overview Demonstration PDF
This slide illustrates status review board of software project status in the current quarter. It includes components like budget, schedule, quality, scope, risks etc. Pitch your topic with ease and precision using this Quarterly Project And Progress Report Infographics PDF. This layout presents information on Budget, Schedule, Quality. It is also available for immediate download and adjustment. So, changes can be made in the color, design, graphics or any other component to create a unique layout.

Ppt Seventh Layer Of How To Create Marketing PowerPoint Presentation Process Templates
PPT seventh layer of how to create marketing powerpoint presentation process Templates-This Chart is a simple Diagram that provides a graphical, time-phased overview of a continuing sequence of stages, tasks, or events. Use This Sequentially Demonstrated PowerPoint Diagram having seven steps displaying using arrow pointing towards East direction. It signifies the completion of the procedure and attaining success.-PPT seventh layer of how to create marketing powerpoint presentation process Templates-action, black, chain, collapse, concepts, consequence, continuity, destruction, domino, effect, fall, game, impact, motion, move, nobody, parallelepiped, play, rectangle, reflection, row, sequence, white

Internet Security Incident Analysis Report Template PDF
This slide exhibits security data breach incident report. It includes multiple steps such as- report the number of personal data record lost, analyze the possible effects of personal data breaches and so on. Showcasing this set of slides titled internet security incident analysis report template pdf. The topics addressed in these templates are data breach details, consequences, measures. All the content presented in this PPT design is completely editable. Download it and make adjustments in color, background, font etc. as per your unique business setting.

Threat Management Strategy With Proposed Treatment Structure PDF
This slide focuses on the risk mitigation plan which covers title, category, owner, objective, description, threat and vulnerabilities, consequences, treatments and their effectiveness with responsible person, date for implementation, risk level, etc. Showcasing this set of slides titled Threat Management Strategy With Proposed Treatment Structure PDF. The topics addressed in these templates are Risk Title, Risk Category, Risk Owner. All the content presented in this PPT design is completely editable. Download it and make adjustments in color, background, font etc. as per your unique business setting.

IT System Migration Risk Assessment Matrix Ppt PowerPoint Presentation Model Graphics PDF
The following slide highlights the major threats in it system migration to minimize its effect. It also includes elements such as risk source, consequences, control actions, its impact, likelihood and level. Showcasing this set of slides titled IT System Migration Risk Assessment Matrix Ppt PowerPoint Presentation Model Graphics PDF. The topics addressed in these templates are Technical Support, Detailed Information, Perplex Structure. All the content presented in this PPT design is completely editable. Download it and make adjustments in color, background, font etc. as per your unique business setting.
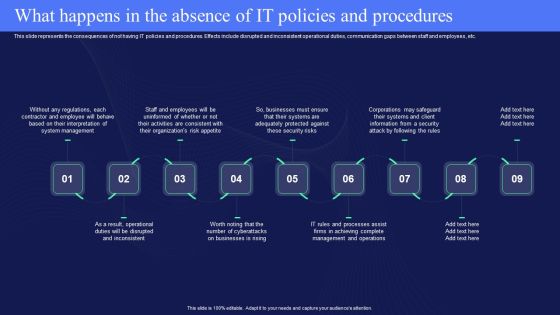
What Happens In The Absence Of IT Policies And Procedures Template PDF
This slide represents the consequences of not having IT policies and procedures. Effects include disrupted and inconsistent operational duties, communication gaps between staff and employees, etc. Want to ace your presentation in front of a live audience Our What Happens In The Absence Of IT Policies And Procedures Template PDF can help you do that by engaging all the users towards you. Slidegeeks experts have put their efforts and expertise into creating these impeccable powerpoint presentations so that you can communicate your ideas clearly. Moreover, all the templates are customizable, and easy-to-edit and downloadable. Use these for both personal and commercial use.
