AI PPT Maker
Templates
PPT Bundles
Design Services
Business PPTs
Business Plan
Management
Strategy
Introduction PPT
Roadmap
Self Introduction
Timelines
Process
Marketing
Agenda
Technology
Medical
Startup Business Plan
Cyber Security
Dashboards
SWOT
Proposals
Education
Pitch Deck
Digital Marketing
KPIs
Project Management
Product Management
Artificial Intelligence
Target Market
Communication
Supply Chain
Google Slides
Research Services
 One Pagers
All Categories
-
Home
- Customer Favorites
- Components
Components
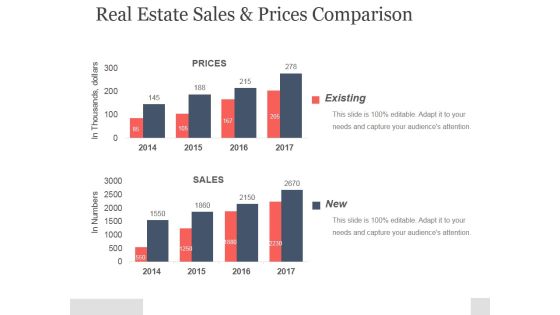
Real Estate Sales And Prices Comparison Ppt PowerPoint Presentation Example
This is a real estate sales and prices comparison ppt powerpoint presentation example. This is a two stage process. The stages in this process are existing, prices, sales, in thousands, dollars.

Current State Analysis Financial Comparison Ppt PowerPoint Presentation Gallery Professional
This is a current state analysis financial comparison ppt powerpoint presentation gallery professional. This is a five stage process. The stages in this process are business, marketing, process, growth, management.

Revenue Cost Per Employee Comparison Ppt PowerPoint Presentation Diagram Lists
This is a revenue cost per employee comparison ppt powerpoint presentation diagram lists. This is a seven stage process. The stages in this process are year, graph, management, finance, company rpe.

Competitor Analysis Comparison Table Ppt PowerPoint Presentation Outline Slides
This is a competitor analysis comparison table ppt powerpoint presentation outline slides. This is a two stage process. The stages in this process are revenue, profit, market share, main activity, number of employee, product quality.

Competitor Analysis Comparison Table Ppt PowerPoint Presentation Infographic Template Graphics
This is a competitor analysis comparison table ppt powerpoint presentation infographic template graphics. This is a seven stage process. The stages in this process are profit, revenue, market share, main activity, criteria.

Competitor Analysis Comparison Table Ppt PowerPoint Presentation Icon Designs Download
This is a competitor analysis comparison table ppt powerpoint presentation icon designs download. This is a seven stage process. The stages in this process are revenue, profit, market share, main activity, number of employee, product quality.

Competitor Analysis Comparison Table Ppt PowerPoint Presentation Infographics Design Inspiration
This is a competitor analysis comparison table ppt powerpoint presentation infographics design inspiration. This is a seven stage process. The stages in this process are revenue, profit, market share, main activity.

Budgeting Planned Actual Comparison Ppt PowerPoint Presentationpictures Files
This is a budgeting planned actual comparison ppt powerpoint presentationpictures files. This is a two stage process. The stages in this process are deviation, planned costs vs actual costs, planned cost, actual cost.

Competitor Analysis Comparison Table Ppt PowerPoint Presentation Show Grid
This is a competitor analysis comparison table ppt powerpoint presentation show grid. This is a seven stage process. The stages in this process are revenue, profit, market share, main activity, number of employee.

Competition Comparison Table Ppt PowerPoint Presentation Pictures File Formats
This is a competition comparison table ppt powerpoint presentation pictures file formats. This is a seven stage process. The stages in this process are revenue, profit, market share, main activity, number of employee, product quality.

Current State Analysis Financial Comparison Ppt PowerPoint Presentation Inspiration Good
This is a current state analysis financial comparison ppt powerpoint presentation inspiration good. This is a five stage process. The stages in this process are revenue, profits, cash balance, competitor.

Budgeting Planned Actual Comparison Ppt PowerPoint Presentation Pictures Elements
This is a budgeting planned actual comparison ppt powerpoint presentation pictures elements. This is a two stage process. The stages in this process are type of cost, planned cost, actual cost, value difference.

competition comparison table ppt powerpoint presentation infographics design inspiration
This is a competition comparison table ppt powerpoint presentation infographics design inspiration. This is a seven stage process. The stages in this process are revenue, profit, market share, main activity, number of employee.
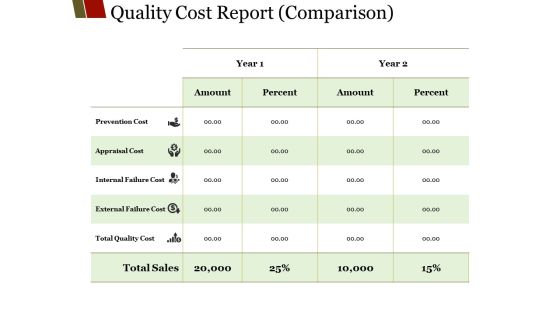
Quality Cost Report Comparison Ppt PowerPoint Presentation Visual Aids Model
This is a quality cost report comparison ppt powerpoint presentation visual aids model. This is a five stage process. The stages in this process are amount, percent, year, prevention cost, prevention cost.

Quality Cost Report Comparison Ppt PowerPoint Presentation Model Portfolio
This is a quality cost report comparison ppt powerpoint presentation model portfolio. This is a two stage process. The stages in this process are prevention cost, appraisal cost, internal failure cost, external failure cost, total quality cost.

Comparison Based On Criteria Ppt PowerPoint Presentation Outline Pictures
This is a comparison based on criteria ppt powerpoint presentation outline pictures. This is a six stage process. The stages in this process are revenue, profit, market share, main activity, number of employee.

Comparison Based On Criteria Ppt PowerPoint Presentation Show Icon
This is a comparison based on criteria ppt powerpoint presentation show icon. This is a six stage process. The stages in this process are revenue, profit, market share, main activity, number of employee.

Comparison Based On Criteria Ppt PowerPoint Presentation Gallery Themes
This is a comparison based on criteria ppt powerpoint presentation gallery themes. This is a seven stage process. The stages in this process are revenue, profit, market share, main activity, product quality.

Comparison Based On Criteria Ppt PowerPoint Presentation Gallery Sample
This is a comparison based on criteria ppt powerpoint presentation gallery sample. This is a six stage process. The stages in this process are revenue, profit, market share, main activity, number of employee.

Comparison Based On Criteria Ppt PowerPoint Presentation Icon Example Introduction
This is a comparison based on criteria ppt powerpoint presentation icon example introduction. This is a six stage process. The stages in this process are criteria, revenue, profit, market share, main activity.

Comparison Based On Criteria Ppt PowerPoint Presentation Show File Formats
This is a comparison based on criteria ppt powerpoint presentation show file formats. This is a six stage process. The stages in this process are revenue, profit, market share, main activity, number of employee.

Comparison Based On Criteria Ppt PowerPoint Presentation Infographics Graphics Download
This is a comparison based on criteria ppt powerpoint presentation infographics graphics download. This is a six stage process. The stages in this process are high value, low value, low trust, high trust.

Budgeting Planned Actual Comparison Ppt PowerPoint Presentation Portfolio Background
This is a budgeting planned actual comparison ppt powerpoint presentation portfolio background. This is a three stage process. The stages in this process are planned cost, actual cost, value difference, deviation, bar graph.

Budgeting Planned Actual Comparison Ppt PowerPoint Presentation Gallery Graphic Tips
This is a budgeting planned actual comparison ppt powerpoint presentation gallery graphic tips. This is a three stage process. The stages in this process are planned cost, actual cost, value difference.

Budgeting Planned Actual Comparison Ppt PowerPoint Presentation Visual Aids Outline
This is a budgeting planned actual comparison ppt powerpoint presentation visual aids outline. This is a three stage process. The stages in this process are planned cost, actual cost, value difference.

Budgeting Planned Actual Comparison Ppt PowerPoint Presentation Icon Clipart Images
This is a budgeting planned actual comparison ppt powerpoint presentation icon clipart images. This is a two stage process. The stages in this process are planned cost, actual cost, compare, finance, business.

Budgeting Planned Actual Comparison Ppt PowerPoint Presentation Portfolio Information
This is a budgeting planned actual comparison ppt powerpoint presentation portfolio information. This is a three stage process. The stages in this process are planned cost, actual cost, deviation.

Budgeting Planned Actual Comparison Ppt PowerPoint Presentation Portfolio Display
This is a budgeting planned actual comparison ppt powerpoint presentation portfolio display. This is a three stage process. The stages in this process are type of cost, planned cost, actual cost, deviation, value difference.

Comparison Based On Criteria Ppt PowerPoint Presentation Infographics Elements
This is a comparison based on criteria ppt powerpoint presentation infographics elements. This is a four stage process. The stages in this process are design, price, performance, product, competitor.

Comparison Based On Criteria Ppt PowerPoint Presentation Styles Show
This is a comparison based on criteria ppt powerpoint presentation styles show. This is a four stage process. The stages in this process are own business, design, price, performance, quality.

Comparison Based On Criteria Ppt PowerPoint Presentation Inspiration
This is a comparison based on criteria ppt powerpoint presentation inspiration. This is a four stage process. The stages in this process are design, price, performance, quality, additional functions.

Comparison Based On Criteria Ppt PowerPoint Presentation Inspiration Graphic Tips
This is a comparison based on criteria ppt powerpoint presentation inspiration graphic tips. This is afour stage process. The stages in this process are design, price, quality, additional functions, equipment.

Comparison Based On Criteria Ppt PowerPoint Presentation Summary Good
This is a comparison based on criteria ppt powerpoint presentation summary good. This is a four stage process. The stages in this process are product, design, price, performance, quality.

Valuation Methods Comparison Ppt PowerPoint Presentation Inspiration Background Images
This is a valuation methods comparison ppt powerpoint presentation inspiration background images. This is a two stage process. The stages in this process are valuation method, results, comments, internal rate of return, net present value.

Valuation Methods Comparison Ppt PowerPoint Presentation Ideas Picture
This is a valuation methods comparison ppt powerpoint presentation ideas picture. This is a two stage process. The stages in this process are valuation method, results, comments, business, marketing.
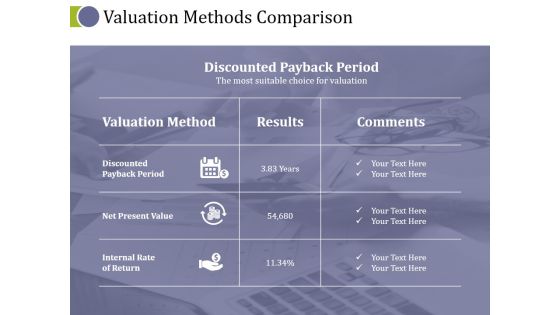
Valuation Methods Comparison Ppt PowerPoint Presentation Ideas Background Image
This is a valuation methods comparison ppt powerpoint presentation ideas background image. This is a two stage process. The stages in this process are valuation method, discounted payback period, net present value, internal rate of return.
Valuation Methods Comparison Ppt PowerPoint Presentation Icon Graphic Tips
This is a valuation methods comparison ppt powerpoint presentation icon graphic tips. This is a two stage process. The stages in this process are compare, business, marketing, strategy, management.
Quality Cost Report Comparison Ppt PowerPoint Presentation Icon Background Designs
This is a quality cost report comparison ppt powerpoint presentation icon background designs. This is a two stage process. The stages in this process are compare, business, table, marketing, strategy.
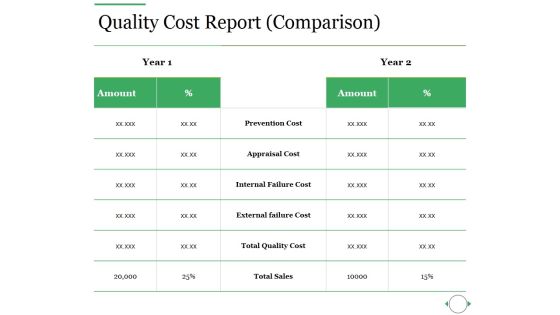
Quality Cost Report Comparison Ppt PowerPoint Presentation Ideas Slides
This is a quality cost report comparison ppt powerpoint presentation ideas slides. This is a two stage process. The stages in this process are prevention cost, appraisal cost, internal failure cost, external failure cost, total quality cost.
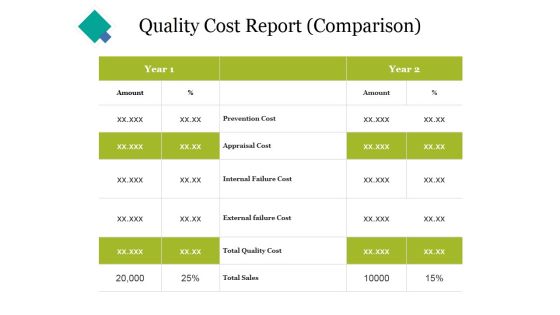
Quality Cost Report Comparison Ppt PowerPoint Presentation Portfolio Themes
This is a quality cost report comparison ppt powerpoint presentation portfolio themes. This is a two stage process. The stages in this process are prevention cost, appraisal cost, internal failure cost, external failure cost, total quality cost.

quality cost report comparison ppt powerpoint presentation portfolio information
This is a quality cost report comparison ppt powerpoint presentation portfolio information. This is a two stage process. The stages in this process are prevention cost, appraisal cost, internal failure cost, external failure cost, total quality cost.

Comparison Based On Criteria Ppt PowerPoint Presentation Slides Skills
This is a comparison based on criteria ppt powerpoint presentation slides skills. This is a five stage process. The stages in this process are revenue, profit, market share, main activity, number of employees, product quality.

Comparison Based On Criteria Ppt PowerPoint Presentation Show Outline
This is a comparison based on criteria ppt powerpoint presentation show outline. This is a six stage process. The stages in this process are revenue, profit, market share, main activity, number of employees.

Comparison Based On Criteria Ppt PowerPoint Presentation Show Graphics Pictures
This is a comparison based on criteria ppt powerpoint presentation show graphics pictures. This is a seven stage process. The stages in this process are competitor, revenue, profit, market share, main activity.

Comparison Based On Criteria Ppt PowerPoint Presentation Styles Picture
This is a comparison based on criteria ppt powerpoint presentation styles picture. This is a five stage process. The stages in this process are competitor, revenue, profit, criteria, market share.

Comparison Based On Criteria Ppt PowerPoint Presentation Styles Designs
This is a comparison based on criteria ppt powerpoint presentation styles designs. This is a three stage process. The stages in this process are revenue, profit, market share, main activity, number of employees, product quality.

Budgeting Planned Actual Comparison Ppt PowerPoint Presentation Show Background Image
This is a budgeting planned actual comparison ppt powerpoint presentation show background image. This is a three stage process. The stages in this process are planned cost, actual cost, value difference, deviation.

Comparison Based On Criteria Ppt PowerPoint Presentation Model Inspiration
This is a comparison based on criteria ppt powerpoint presentation model inspiration. This is a seven stage process. The stages in this process are revenue, profit, market share, number of employees, product quality.

Comparison Based On Criteria Ppt PowerPoint Presentation Show Background Image
This is a comparison based on criteria ppt powerpoint presentation show background image. This is a seven stage process. The stages in this process are revenue, market share, main activity, number of employees, product quality, insert your own text.

Comparison Based On Criteria Ppt PowerPoint Presentation File Templates
This is a comparison based on criteria ppt powerpoint presentation file templates. This is a seven stage process. The stages in this process are revenue, market share, main activity, number of employees, product quality, insert your own text.

Comparison Based On Criteria Ppt PowerPoint Presentation Model Layouts
This is a comparison based on criteria ppt powerpoint presentation model layouts. This is a seven stage process. The stages in this process are revenue, profit, market share, main activity, product quality.

Project Comparison Ppt PowerPoint Presentation Styles Example File
This is a project comparison ppt powerpoint presentation styles example file. This is a six stage process. The stages in this process are company xx, competitor, indirect competitor, business, marketing.

Comparison Based On Criteria Ppt PowerPoint Presentation Gallery Information
This is a comparison based on criteria ppt powerpoint presentation gallery information. This is a six stage process. The stages in this process are criteria, revenue, profit, business, competitor.

Competitor Comparison Template 1 Ppt PowerPoint Presentation Infographic Template Mockup
This is a competitor comparison template 1 ppt powerpoint presentation infographic template mockup. This is a five stage process. The stages in this process are business, marketing, graph, finance, strategy.

Competitor Comparison Template 2 Ppt PowerPoint Presentation Infographics Objects
This is a competitor comparison template 2 ppt powerpoint presentation infographics objects. This is a five stage process. The stages in this process are business, marketing, graph, finance, strategy.
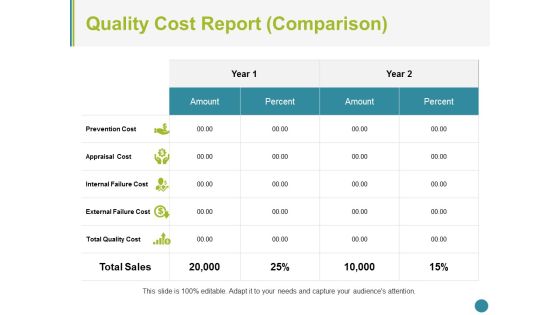
Quality Cost Report Comparison Ppt PowerPoint Presentation Summary Portfolio
This is a quality cost report comparison ppt powerpoint presentation summary portfolio. This is a two stage process. The stages in this process are prevention cost, appraisal cost, internal failure cost, external failure cost, total quality cost.

Competitor Comparison Template 1 Ppt PowerPoint Presentation Layouts Slide Portrait
This is a competitor comparison template 1 ppt powerpoint presentation layouts slide portrait. This is a four stage process. The stages in this process are business, marketing, graph, finance, strategy.

Competitor Comparison Template 2 Ppt PowerPoint Presentation Inspiration Images
This is a competitor comparison template 2 ppt powerpoint presentation inspiration images. This is a five stage process. The stages in this process are business, marketing, graph, finance, strategy.

Budgeting Planned Actual Comparison Ppt PowerPoint Presentation File Skills
This is a budgeting planned actual comparison ppt powerpoint presentation file skills. This is a three stage process. The stages in this process are value difference, planned cost, actual cost, deviation.
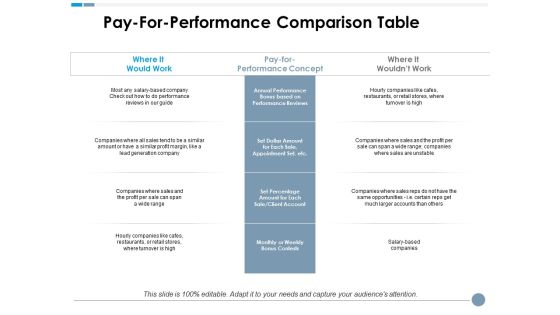
Pay For Performance Comparison Table Ppt PowerPoint Presentation Styles Summary
This is a pay for performance comparison table ppt powerpoint presentation styles summary. This is a three stage process. The stages in this process are business, where it would work, pay for performance concept, where it would t work, marketing.
