AI PPT Maker
Templates
PPT Bundles
Design Services
Business PPTs
Business Plan
Management
Strategy
Introduction PPT
Roadmap
Self Introduction
Timelines
Process
Marketing
Agenda
Technology
Medical
Startup Business Plan
Cyber Security
Dashboards
SWOT
Proposals
Education
Pitch Deck
Digital Marketing
KPIs
Project Management
Product Management
Artificial Intelligence
Target Market
Communication
Supply Chain
Google Slides
Research Services
 One Pagers
All Categories
-
Home
- Customer Favorites
- Components
Components

Project Metrics Dashboard For Software Development Designs PDF
This slide shows the project management dashboard for developing software which focuses on health status such as time, cost, workload, risks, issues and changes with comparison of actual and planned expenses with budget. It also shows the risks, issues ad changes. Pitch your topic with ease and precision using this Project Metrics Dashboard For Software Development Designs PDF. This layout presents information on Risks, Budget, Cost. It is also available for immediate download and adjustment. So, changes can be made in the color, design, graphics or any other component to create a unique layout.
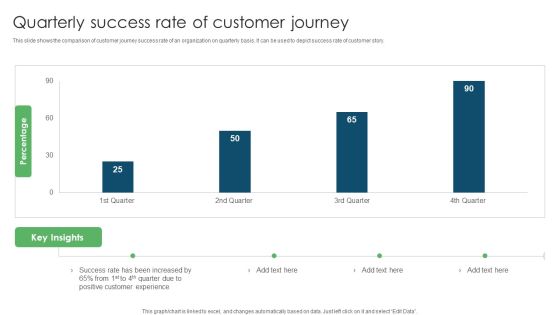
Quarterly Success Rate Of Customer Journey Ppt PowerPoint Presentation Outline Mockup PDF
This slide shows the comparison of customer journey success rate of an organization on quarterly basis. It can be used to depict success rate of customer story. Pitch your topic with ease and precision using this Quarterly Success Rate Of Customer Journey Ppt PowerPoint Presentation Outline Mockup PDF. This layout presents information on Success Rate, Increased Positive, Customer Experience. It is also available for immediate download and adjustment. So, changes can be made in the color, design, graphics or any other component to create a unique layout.
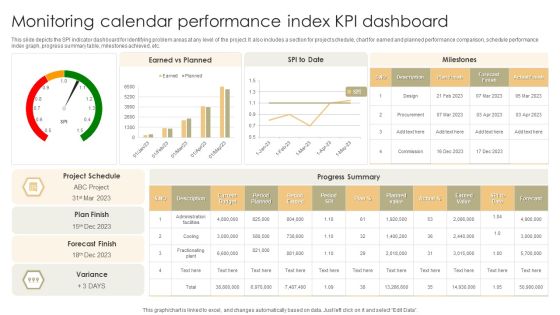
Monitoring Calendar Performance Index KPI Dashboard Slides PDF
This slide depicts the SPI indicator dashboard for identifying problem areas at any level of the project. It also includes a section for project schedule, chart for earned and planned performance comparison, schedule performance index graph, progress summary table, milestones achieved, etc. Pitch your topic with ease and precision using this Monitoring Calendar Performance Index KPI Dashboard Slides PDF. This layout presents information on Current Budget, Planned Value, Earned Value. It is also available for immediate download and adjustment. So, changes can be made in the color, design, graphics or any other component to create a unique layout.

Power Plant Energy Production Dashboard For Consumption Statistics Download PDF
This graph or chart is linked to excel, and changes automatically based on data. Just left click on it and select edit data. Pitch your topic with ease and precision using this Multiple Country Energy Consumption Statistics Comparison Dashboard Formats PDF. This layout presents information on August Year 2022, Return on Investments, Power Plan Detail . It is also available for immediate download and adjustment. So, changes can be made in the color, design, graphics or any other component to create a unique layout.

5 Years Comparative Analysis Chart Of Balance Sheet Of Organization Ppt Inspiration Slide PDF
This slider represents the five years comparison of organizations balance sheet. It includes details related to total assets and liabilities along with total equity over different years. Pitch your topic with ease and precision using this 5 Years Comparative Analysis Chart Of Balance Sheet Of Organization Ppt Inspiration Slide PDF. This layout presents information on Account Assets, Total Assets Liabilities, Total Liabilities Equity. It is also available for immediate download and adjustment. So, changes can be made in the color, design, graphics or any other component to create a unique layout.

5 Years Comparative Analysis Chart Of Liquidity Ratios Of IT Companies Ppt Portfolio Visual Aids PDF
This slide represents the table showing comparison between current and quick ratios of two IT companies over five years. It includes details related to current and quick ratios for both companies for different years along with the average of their five years ratios. Pitch your topic with ease and precision using this 5 Years Comparative Analysis Chart Of Liquidity Ratios Of IT Companies Ppt Portfolio Visual Aids PDF. This layout presents information on Current Ratio, Average, 2018 To 2022. It is also available for immediate download and adjustment. So, changes can be made in the color, design, graphics or any other component to create a unique layout.

5 Years Expenses Comparative Analysis Chart For Core Banking Solutions Ppt Portfolio Clipart Images PDF
This slide shows the table representing the five years comparison between various costs incurred in installation of core banking solutions. It includes details related to various expenses such as entry level server, increase in electricity costs etc. Pitch your topic with ease and precision using this 5 Years Expenses Comparative Analysis Chart For Core Banking Solutions Ppt Portfolio Clipart Images PDF. This layout presents information on Entry Level Server, Antivirus Server, Increase Electricity Cost. It is also available for immediate download and adjustment. So, changes can be made in the color, design, graphics or any other component to create a unique layout.

5 Years Profit And Loss Comparative Analysis Chart Of Enterprise Ppt Icon Graphics PDF
This slide represents the comparison of profit and loss of an organization for the five years. It includes details related to profit and loss from various accounts such as order fees, concession income, facility rental etc. Pitch your topic with ease and precision using this 5 Years Profit And Loss Comparative Analysis Chart Of Enterprise Ppt Icon Graphics PDF. This layout presents information on Account, 2018 To 2022, Exchange Fees. It is also available for immediate download and adjustment. So, changes can be made in the color, design, graphics or any other component to create a unique layout.

5 Years Sales And Profit Growth Comparative Analysis Chart Of Private Banks Infographics PDF
This slide shows the table representing the comparison between sales and profit growth of five years of various private banks. It includes details related to names of private banks and their five years sales growth and profit growth. Pitch your topic with ease and precision using this 5 Years Sales And Profit Growth Comparative Analysis Chart Of Private Banks Infographics PDF. This layout presents information on Private Banks, Sales Growth, Profit Growth. It is also available for immediate download and adjustment. So, changes can be made in the color, design, graphics or any other component to create a unique layout.

5 Years Technological Comparative Analysis Chart Of Service Provisioning And Operational Costs Information PDF
This slide represents the five years technological and cost based comparison for use of passive optical network. It includes details related to ONT cost, service provisioning and operational costs for five years. Pitch your topic with ease and precision using this 5 Years Technological Comparative Analysis Chart Of Service Provisioning And Operational Costs Information PDF. This layout presents information on Optical Network Termination, Service Provisioning, Operational Cost. It is also available for immediate download and adjustment. So, changes can be made in the color, design, graphics or any other component to create a unique layout.

Blockchain Technology Comparative Assessment Table With Cost Per Transaction Guidelines PDF
The purpose of this slide is to outline comparison of various blockchain technologies. The technologies mentioned in the slide are bit shares, bitcoin, Ethereum, bitcoin cash, Litecoin and dash. Pitch your topic with ease and precision using this Blockchain Technology Comparative Assessment Table With Cost Per Transaction Guidelines PDF. This layout presents information on Median Confirmation Time, Transactions Per Second, Cost Per Transaction. It is also available for immediate download and adjustment. So, changes can be made in the color, design, graphics or any other component to create a unique layout.

Comparative Assessment Of Multiple Iot Technologies Demonstration PDF
The purpose of this slide is to outline comparison of different IoT technologies. It provides information about the capabilities of technologies such as device error tracking, healthcare protocol support, operations dashboard, automated business rules etc. Pitch your topic with ease and precision using this Comparative Assessment Of Multiple Iot Technologies Demonstration PDF. This layout presents information on Capabilities, Technology, Device Error Tracking. It is also available for immediate download and adjustment. So, changes can be made in the color, design, graphics or any other component to create a unique layout.

Technology Comparative Assessment Matrix With Frequency And Bandwidth Sample PDF
The purpose of this slide is to highlight technology comparison to be used for IoT applications. Information covered in this template is related to type, standardization, availability, frequency, bandwidth etc. Pitch your topic with ease and precision using this Technology Comparative Assessment Matrix With Frequency And Bandwidth Sample PDF. This layout presents information on Technology, Downlink Bandwidth, Scalability. It is also available for immediate download and adjustment. So, changes can be made in the color, design, graphics or any other component to create a unique layout.

Wireless Technology Comparative Assessment With Key Attributes Topics PDF
The purpose of this slide is to showcase technology comparison in the case of IOT applications. The technologies are compared on key attributes such as range, throughput, power consumption, ongoing cost, module cost and topology. Pitch your topic with ease and precision using this Wireless Technology Comparative Assessment With Key Attributes Topics PDF. This layout presents information on Range, Throughput, Power Consumption, Ongoing Cost. It is also available for immediate download and adjustment. So, changes can be made in the color, design, graphics or any other component to create a unique layout.

Comparative Assessment Of Block Chain Enabled Altcoins Vs Fiat Currencies Ppt Infographics Icons PDF
This slide covers difference between crypto and fiat currencies as medium of exchanges. It includes comparison based on intermediary requirements, block chain enablement, control, circulation, etc. Pitch your topic with ease and precision using this Comparative Assessment Of Block Chain Enabled Altcoins Vs Fiat Currencies Ppt Infographics Icons PDF. This layout presents information on Cryptocurrencies, Fiat Currencies, Decentralized Control. It is also available for immediate download and adjustment. So, changes can be made in the color, design, graphics or any other component to create a unique layout.

Comparative Analysis Of Electronic Data Interchange And Internet Technologies Portrait PDF
This slide provides glimpse about comparison of transference of data through Electronic Data Interchange EDI and internet. It includes characteristics such as electronic commerce, data structure, etc.Pitch your topic with ease and precision using this Comparative Analysis Of Electronic Data Interchange And Internet Technologies Portrait PDF. This layout presents information on Electronic Commerce, Processing Speed, Investment Requirement. It is also available for immediate download and adjustment. So, changes can be made in the color, design, graphics or any other component to create a unique layout.
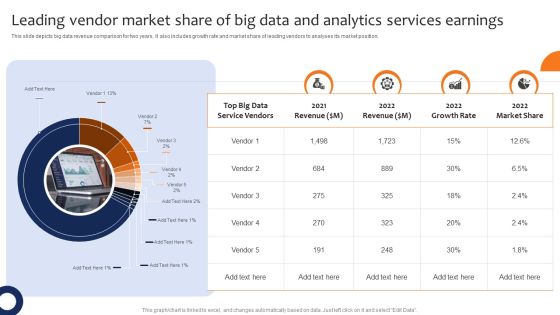
Leading Vendor Market Share Of Big Data And Analytics Services Earnings Professional PDF
This slide depicts big data revenue comparison for two years. It also includes growth rate and market share of leading vendors to analyses its market position. Pitch your topic with ease and precision using this Leading Vendor Market Share Of Big Data And Analytics Services Earnings Professional PDF. This layout presents information on Revenue, Growth Rate, Market Share. It is also available for immediate download and adjustment. So, changes can be made in the color, design, graphics or any other component to create a unique layout.

International Sourcing Employee And Operational Kpis Themes PDF
This slide shows the key performance indicators of global sourcing the products and services for getting high quality materials. It includes operational and employee related KPIs comparison of retail, manufacturing and apparel companys. Pitch your topic with ease and precision using this International Sourcing Employee And Operational Kpis Themes PDF. This layout presents information on Apparel Company, Manufacturing Company, Retail Company. It is also available for immediate download and adjustment. So, changes can be made in the color, design, graphics or any other component to create a unique layout.

Comparative Assessment Of Regulatory Compliance Report Services Clipart PDF
The following slide exhibits comparison of multiple regulatory report service providers. It provides information about dashboard, automation, data quality management, toolset, user oriented analysis, documentation, etc. Pitch your topic with ease and precision using this Comparative Assessment Of Regulatory Compliance Report Services Clipart PDF. This layout presents information on Financial Reporting Automation, Compliance Documentation, Data Quality Management. It is also available for immediate download and adjustment. So, changes can be made in the color, design, graphics or any other component to create a unique layout.

Business Unit Valuation And Development Dashboard Ppt Professional Graphic Tips PDF
This slide shows key performance indicators dashboard which represents number of assets along with their stages of development. It also includes estimated development cost and production index comparison. Pitch your topic with ease and precision using this Business Unit Valuation And Development Dashboard Ppt Professional Graphic Tips PDF. This layout presents information on Estimated Development Cost, Production Index, Development Stage. It is also available for immediate download and adjustment. So, changes can be made in the color, design, graphics or any other component to create a unique layout.

Brand Equity Valuation Of Top 10 IT Companies Ppt Portfolio Rules PDF
This slide showcase top 10 information technology companies brand value comparison chart understanding their position in market. It includes elements such as companies name, brand value, and key insights. Pitch your topic with ease and precision using this Brand Equity Valuation Of Top 10 IT Companies Ppt Portfolio Rules PDF. This layout presents information on Highest Market Value, Total Value, Brand Valuation. It is also available for immediate download and adjustment. So, changes can be made in the color, design, graphics or any other component to create a unique layout.
Tactical M And A Process And Risk Assessment Strategy Ppt Icon Ideas PDF
This slide showcases feasibility and risk assessment comparison framework of different firms. Key points included for comparative analysis are ability to finance, targets availability. Competition and capital markets reaction, technology, regulatory and macroeconomic risk. Pitch your topic with ease and precision using this Tactical M And A Process And Risk Assessment Strategy Ppt Icon Ideas PDF. This layout presents information on Sample Dimensions, Ability To Finance, Management Executability. It is also available for immediate download and adjustment. So, changes can be made in the color, design, graphics or any other component to create a unique layout.

Comparative Assessment For E Reader Product Categories Information PDF
This slide showcases capability comparison chart for organization dealing in e- reader products to help customers in understanding pros and cons of each category. It includes information about price, rating, screen size, resolution, etc. Pitch your topic with ease and precision using this Comparative Assessment For E Reader Product Categories Information PDF. This layout presents information on Price, Rating, Screen Size, Storage, Resolution. It is also available for immediate download and adjustment. So, changes can be made in the color, design, graphics or any other component to create a unique layout.
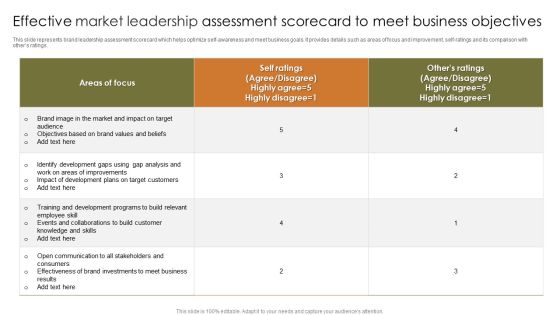
Effective Market Leadership Assessment Scorecard To Meet Business Objectives Themes PDF
This slide represents brand leadership assessment scorecard which helps optimize self awareness and meet business goals. It provides details such as areas of focus and improvement, self ratings and its comparison with others ratings. Pitch your topic with ease and precision using this Effective Market Leadership Assessment Scorecard To Meet Business Objectives Themes PDF. This layout presents information on Effective Market Leadership, Assessment Scorecard To Meet, Business Objectives. It is also available for immediate download and adjustment. So, changes can be made in the color, design, graphics or any other component to create a unique layout.

Small Company And Entrepreneurs Failture Rate Summary PDF
This slide exhibits yearly statistics indicating fail rates of business commenced after 2018. It contains percentage of business fail, yearly comparison rate of failure and average annual rate of business failure. Pitch your topic with ease and precision using this Small Company And Entrepreneurs Failture Rate Summary PDF. This layout presents information on Entrepreneurs Failture Rate, Business. It is also available for immediate download and adjustment. So, changes can be made in the color, design, graphics or any other component to create a unique layout.
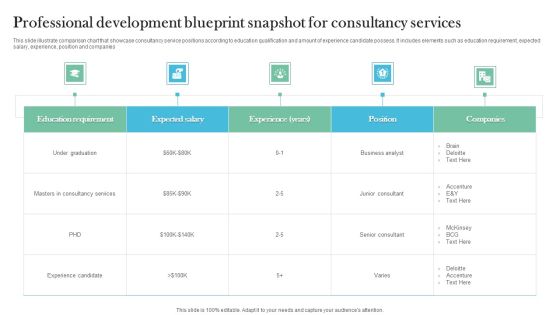
Professional Development Blueprint Snapshot For Consultancy Services Microsoft PDF
This slide illustrate comparison chart that showcase consultancy service positions according to education qualification and amount of experience candidate possess. It includes elements such as education requirement, expected salary, experience, position and companies. Pitch your topic with ease and precision using this Professional Development Blueprint Snapshot For Consultancy Services Microsoft PDF. This layout presents information on Consultancy Services, Education Requirement, Business Analyst. It is also available for immediate download and adjustment. So, changes can be made in the color, design, graphics or any other component to create a unique layout.

Business Sales Capability And Inventory Orders Matrix Themes PDF
This slide illustrates expected sales forecast of this year with comparison with previous year. It includes target units, inventory, units to order, actual sales units etc. Pitch your topic with ease and precision using this Business Sales Capability And Inventory Orders Matrix Themes PDF. This layout presents information on Business Sales, Capability And Inventory, Orders Matrix. It is also available for immediate download and adjustment. So, changes can be made in the color, design, graphics or any other component to create a unique layout.

Competitive Product Pricing Benchmarks Comparative Analysis Table Introduction PDF
This slide shows the table representing the price benchmarking comparison of various products of same categories and their vendor prices. It includes details related to products, their description, units, quantity and the prices offered by the different vendors for same product. Pitch your topic with ease and precision using this Competitive Product Pricing Benchmarks Comparative Analysis Table Introduction PDF. This layout presents information on Competitive Product Pricing, Benchmarks Comparative Analysis . It is also available for immediate download and adjustment. So, changes can be made in the color, design, graphics or any other component to create a unique layout.
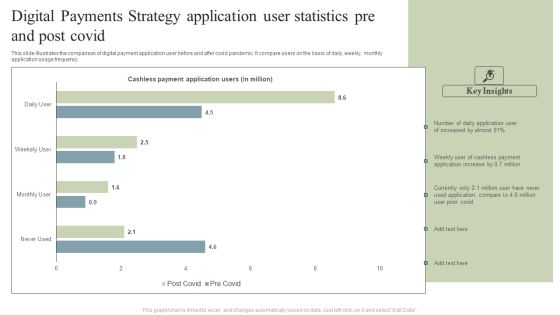
Digital Payments Strategy Application User Statistics Pre And Post Covid Pictures PDF
This slide illustrates the comparison of digital payment application user before and after covid pandemic. It compare users on the basis of daily, weekly, monthly application usage frequency. Pitch your topic with ease and precision using this Digital Payments Strategy Application User Statistics Pre And Post Covid Pictures PDF. This layout presents information on Cashless Payment, Application Users, Cashless Payment, Application Increase. It is also available for immediate download and adjustment. So, changes can be made in the color, design, graphics or any other component to create a unique layout.

Brand Competitor Analysis Grid Evaluation Information PDF
This slide showcases competitive analysis matrix to provide a clear understanding where the brand stand. The comparison is done on the basis of value proposition, audience, range of authority and stakeholder relationships.Pitch your topic with ease and precision using this Brand Competitor Analysis Grid Evaluation Information PDF. This layout presents information on Stakeholder Relationships, Value Proposition, Superior Quality. It is also available for immediate download and adjustment. So, changes can be made in the color, design, graphics or any other component to create a unique layout.

Competitor Analysis Grid Of E-Commerce Firms Professional PDF
This slide showcases comparison of e-commerce firms on the basis of performance indicators. The KPIs included are revenue, churn, conversion and bounce rate, average order value and website traffic.Pitch your topic with ease and precision using this Competitor Analysis Grid Of E-Commerce Firms Professional PDF. This layout presents information on Website Traffic, Conversion Rate, Website Traffic. It is also available for immediate download and adjustment. So, changes can be made in the color, design, graphics or any other component to create a unique layout.

Competitor Analysis Grid Of Food Manufacturing Company Information PDF
This slide showcases comparation among food manufacturing companies to analyze their strategies and marketing plan. The comparison is done on the basis of products, market share, strategies, customer ratings, strengths and weaknesses.Pitch your topic with ease and precision using this Competitor Analysis Grid Of Food Manufacturing Company Information PDF. This layout presents information on Marketing Strategies, Customer Ratings, Distribution Network. It is also available for immediate download and adjustment. So, changes can be made in the color, design, graphics or any other component to create a unique layout.

Comparative Analysis Of Traditional Vs Cloud Computing Testing Ideas PDF
This slide showcase the comparison between traditional and cloud computing method. It compares them on the basis of investment made, business acquired, delivery method and technical standards etc.Pitch your topic with ease and precision using this Comparative Analysis Of Traditional Vs Cloud Computing Testing Ideas PDF. This layout presents information on Technical Architecture, Infrastructure Cost, Architecture Included. It is also available for immediate download and adjustment. So, changes can be made in the color, design, graphics or any other component to create a unique layout.

Key Performance Indicators Of The Internal Metrics Audit Function Infographics PDF
This slide defines the graphical representation of internal audit key performance indicators. It is a comparison of the means used to evaluate the performance of the internal audit function. Pitch your topic with ease and precision using this Key Performance Indicators Of The Internal Metrics Audit Function Infographics PDF. This layout presents information on High Variance, Budget To Actual, Audit Functions. It is also available for immediate download and adjustment. So, changes can be made in the color, design, graphics or any other component to create a unique layout.

Comparative Analysis Of Automobile Insurance Price Quotations Structure PDF
This slide illustrates comparison of premium quotations of automobile insurance offered by insurance companies. It includes unmarried females of 25 years, unmarried males of 25 years, married person of 40 years, married person of 60 years etc. Pitch your topic with ease and precision using this Comparative Analysis Of Automobile Insurance Price Quotations Structure PDF. This layout presents information on Comparative Analysis Of Automobile, Insurance Price Quotations. It is also available for immediate download and adjustment. So, changes can be made in the color, design, graphics or any other component to create a unique layout.

Email Marketing Campaign Outcomes And Social Media Marketing Result Analysis Dashboard Mockup PDF
This slide depicts the dashboard for analyzing the results of email campaign and social media marketing. It includes information related to the comparison, statistics, usage, etc. Pitch your topic with ease and precision using this Email Marketing Campaign Outcomes And Social Media Marketing Result Analysis Dashboard Mockup PDF. This layout presents information on Email Marketing Campaign, Outcomes And Social Media, Marketing Result, Analysis Dashboard. It is also available for immediate download and adjustment. So, changes can be made in the color, design, graphics or any other component to create a unique layout.

Actual Vs Forecasted Budget Analysis With Variance Analysis Clipart PDF
This slide represents the table showing the comparison between the actual vs forecasted budget of an organization. It includes details related to variance between the forecasted budget for different months and the actual budget. Pitch your topic with ease and precision using this Actual Vs Forecasted Budget Analysis With Variance Analysis Clipart PDF. This layout presents information on Budget, Actual, Variance. It is also available for immediate download and adjustment. So, changes can be made in the color, design, graphics or any other component to create a unique layout.

Analysis Between Actual And Forecasted Manufacturing Overhead Costs Infographics PDF
This slide shows the table representing the comparison of actual and the forecasted manufacturing overhead costs. It includes costs related to indirect labor and plan and infrastructure costs. Pitch your topic with ease and precision using this Analysis Between Actual And Forecasted Manufacturing Overhead Costs Infographics PDF. This layout presents information on Indirect Labor, Plant And Infrastructure. It is also available for immediate download and adjustment. So, changes can be made in the color, design, graphics or any other component to create a unique layout.
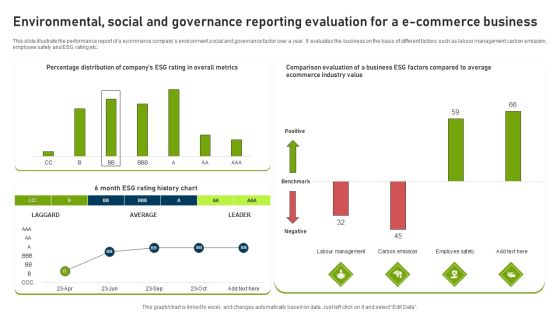
Environmental Social And Governance Reporting Evaluation For A E Commerce Business Template PDF
This slide illustrate the performance report of a ecommerce companys environment,social and governance factor over a year. It evaluates the business on the basis of different factors such as labour management,carbon emission, employee safety and ESG rating etc. Pitch your topic with ease and precision using this Environmental Social And Governance Reporting Evaluation For A E Commerce Business Template PDF. This layout presents information on Comparison Evaluation, Business, Ecommerce Industry Value. It is also available for immediate download and adjustment. So, changes can be made in the color, design, graphics or any other component to create a unique layout.

Comparative Assessment Of Batch Processing Tools Template PDF
Mentioned slide highlights comparison of various batch processing tools used for processing large amount of data. It covers information about tools name, best for, pricing range, platform, deployment, and availability of free trial. Pitch your topic with ease and precision using this Comparative Assessment Of Batch Processing Tools Template PDF. This layout presents information on Centralized Workload Automation, Reducing Manual Intervention, Deployment. It is also available for immediate download and adjustment. So, changes can be made in the color, design, graphics or any other component to create a unique layout.

Monthly Production Summary Total Production And Targets Achieved Pictures PDF
The slide shows the production report for three companies A, B and C with goals and actual production achieved. The production is shown for the annual year 2020 21 with comparison done with 2019 20 year. Pitch your topic with ease and precision using this Monthly Production Summary Total Production And Targets Achieved Pictures PDF. This layout presents information on Monthly Production Summary, Production And Targets Achieved. It is also available for immediate download and adjustment. So, changes can be made in the color, design, graphics or any other component to create a unique layout.
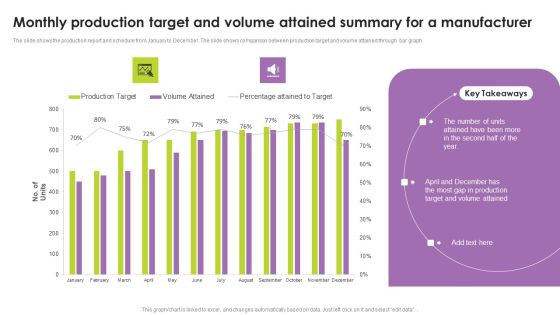
Monthly Production Target And Volume Attained Summary For A Manufacturer Portrait PDF
The slide shows the production report and schedule from January to December. The slide shows comparison between production target and volume attained through bar graph. Pitch your topic with ease and precision using this Monthly Production Target And Volume Attained Summary For A Manufacturer Portrait PDF. This layout presents information on Monthly Production Target, Volume Attained Summary, Manufacturer. It is also available for immediate download and adjustment. So, changes can be made in the color, design, graphics or any other component to create a unique layout.

Comparative Assessment Scorecard For Product Promotion Strategies Formats PDF
This slide shows a comparative assessment scorecard for different product branding strategies adopted by different competitors. It includes comparison on the basis on brand value, product quality, brand positioning, market audience, promotions, pricing and partnership. Pitch your topic with ease and precision using this Comparative Assessment Scorecard For Product Promotion Strategies Formats PDF. This layout presents information on Brand Value Proposition, Market Audience, Partnership. It is also available for immediate download and adjustment. So, changes can be made in the color, design, graphics or any other component to create a unique layout.

Comparative Assessment Of Annual Sales Result Evaluation Elements PDF
This slide signifies the comparative analysis of yearly sales result comparison to increase business growth. It includes various strategies that are being implemented by the organisation to achieve growth in each quarter Pitch your topic with ease and precision using this Comparative Assessment Of Annual Sales Result Evaluation Elements PDF. This layout presents information on Telecalling Strategy, Product Sales, Product Lower. It is also available for immediate download and adjustment. So, changes can be made in the color, design, graphics or any other component to create a unique layout.

Quarterly Result Evaluation To Measure Business Growth Introduction PDF
This slide signifies the quarterly result comparison to evaluate organisation growth. It covers information regarding to goals like increase customer engagement, production rate, revenue with various strategies implemented for growth.Pitch your topic with ease and precision using this Quarterly Result Evaluation To Measure Business Growth Introduction PDF. This layout presents information on Strategies Implemented, Enhance Company Revenue, Increase Sales. It is also available for immediate download and adjustment. So, changes can be made in the color, design, graphics or any other component to create a unique layout.
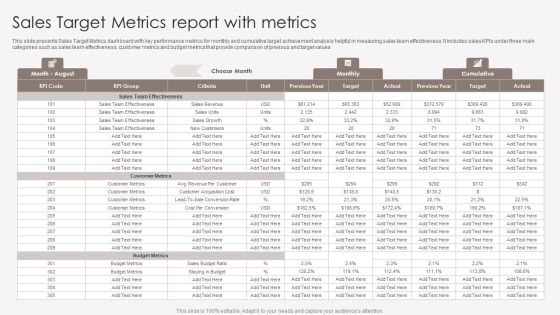
Sales Target Metrics Report With Metrics Introduction PDF
This slide presents Sales Target Metrics dashboard with key performance metrics for monthly and cumulative target achievement analysis helpful in measuring sales team effectiveness. It includes sales KPIs under three main categories such as sales team effectiveness, customer metrics and budget metrics that provide comparison of previous and target values. Pitch your topic with ease and precision using this Sales Target Metrics Report With Metrics Introduction PDF. This layout presents information on Sales Team Effectiveness, Customer Metrics, Budget Metrics. It is also available for immediate download and adjustment. So, changes can be made in the color, design, graphics or any other component to create a unique layout.
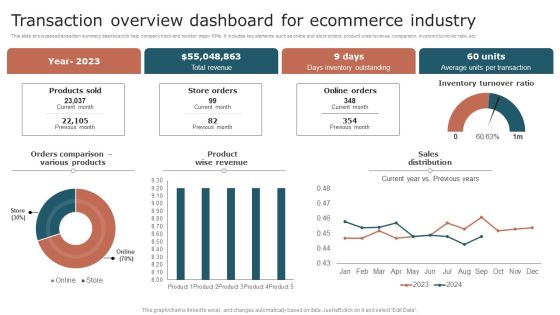
Transaction Overview Dashboard For Ecommerce Industry Summary PDF
This slide showcases transaction summary dashboard to help company track and monitor major KPIs. It includes key elements such as online and store orders, product wise revenue, comparison, inventory turnover ratio, etc. Pitch your topic with ease and precision using this Transaction Overview Dashboard For Ecommerce Industry Summary PDF. This layout presents information on Revenue, Inventory Outstanding, Transaction. It is also available for immediate download and adjustment. So, changes can be made in the color, design, graphics or any other component to create a unique layout.

Comparative Assessment Of On Premise And Cloud Technology Solutions Graphics PDF
The following slide highlights the comparison of on premise and cloud technology offerings to assess and select the most suitable. It includes elements such as software requirements, servers, internet connection, disaster recovery, maintenance etc. Pitch your topic with ease and precision using this Comparative Assessment Of On Premise And Cloud Technology Solutions Graphics PDF. This layout presents information on Internet Connection, Disaster Recovery, Server. It is also available for immediate download and adjustment. So, changes can be made in the color, design, graphics or any other component to create a unique layout.

Operational Strategy To Achieve Short Term Business Goals Inspiration PDF
This slide showcases of balance sheet items of companies with industry average. Key elements of balance sheet included for comparison purpose here are current assets, fixed assets, current liabilities and long-term liabilities etc. Pitch your topic with ease and precision using this Operational Strategy To Achieve Short Term Business Goals Inspiration PDF. This layout presents information on Business Goals, Timeline, Resources Required. It is also available for immediate download and adjustment. So, changes can be made in the color, design, graphics or any other component to create a unique layout.

Strategic Competitor Analysis And Organization Evaluation Report Ppt Ideas Clipart Images PDF
This slide displays strategic business review for market share captured by the company in comparison with its competitors for each quarter. It further includes details about key analysis. Pitch your topic with ease and precision using this Strategic Competitor Analysis And Organization Evaluation Report Ppt Ideas Clipart Images PDF. This layout presents information on Maximum Market Share, Key Insights. It is also available for immediate download and adjustment. So, changes can be made in the color, design, graphics or any other component to create a unique layout.

Customer Effort Score And NPS Comparative Analysis Matrix Ppt Portfolio Pictures PDF
The slide carries a comparison between Customer Effort Score CES, Net Promoter Score NPS and Customer Satisfaction CSAT to effectively evaluate the user experience. Various basis of difference are description, purpose, rating scale, type of questions and industrial benchmark. Pitch your topic with ease and precision using this Customer Effort Score And NPS Comparative Analysis Matrix Ppt Portfolio Pictures PDF. This layout presents information on Basis, Customer Effort Score, Net Promoter Score, Customer Satisfaction. It is also available for immediate download and adjustment. So, changes can be made in the color, design, graphics or any other component to create a unique layout.

Comparative Analysis Of Business Process Outsourcing Offshoring For IT Industries Guidelines PDF
This slide provides a comparative analysis that can be used by corporate managers prior to outsourcing the business process services in information technology sector. The factors of comparison are quantity and quality or human resources, cost considerations, language, infrastructure, pros and cons. Pitch your topic with ease and precision using this Comparative Analysis Of Business Process Outsourcing Offshoring For IT Industries Guidelines PDF. This layout presents information on Quantity Human Resources, Quality Human Resources, Cost Considerations. It is also available for immediate download and adjustment. So, changes can be made in the color, design, graphics or any other component to create a unique layout.

Stock Market Analysis Dashboard With Market Capitalization And Net Profit Elements PDF
Following slide showcase comprehensive stock market dashboard which will assist companies for the comparison purpose. The metrics covered in the slide are top stocks by market capitalization, EPS, net profit and PE ratio. Pitch your topic with ease and precision using this Stock Market Analysis Dashboard With Market Capitalization And Net Profit Elements PDF. This layout presents information on Company, Net Profit, Market Capitalization. It is also available for immediate download and adjustment. So, changes can be made in the color, design, graphics or any other component to create a unique layout.

Comparative Evaluation Of Strategic Resource Software Elements PDF
This slide provides an overview of the various sourcing software to identify suitable suppliers. The comparison is done in the basis of pros, deployment, user review and pricing. Pitch your topic with ease and precision using this Comparative Evaluation Of Strategic Resource Software Elements PDF. This layout presents information on Software, Pros, Deployment, User Review, Pricing. It is also available for immediate download and adjustment. So, changes can be made in the color, design, graphics or any other component to create a unique layout.

Digital And Physical Services Competitive Analysis Matrix Download PDF
This slide shows online and physical services comparison matrix for studying and analysing various players in the market. It include services such as mobile app, customer support and payment options, etc. Pitch your topic with ease and precision using this Digital And Physical Services Competitive Analysis Matrix Download PDF. This layout presents information on Digital Services, Physical Services, Organization. It is also available for immediate download and adjustment. So, changes can be made in the color, design, graphics or any other component to create a unique layout.

Card Interface Networks Comparative Analysis By Processing Fees Formats PDF
This slide showcases comparison between various card network enterprises on the basis of cost of transaction processing. It includes elements such as company name, interchange and assessment charge. Pitch your topic with ease and precision using this Card Interface Networks Comparative Analysis By Processing Fees Formats PDF. This layout presents information on Company Name, Interchange Fees, Assessment Fees . It is also available for immediate download and adjustment. So, changes can be made in the color, design, graphics or any other component to create a unique layout.

Enterprise Resource Planning Software Assessment To Improve Inventory Management Clipart PDF
This slide signifies the enterprise resource planning application evaluation to improve inventory management system. It covers information about software comparison through process manufacturing ERP software proposal. Pitch your topic with ease and precision using this Enterprise Resource Planning Software Assessment To Improve Inventory Management Clipart PDF. This layout presents information on Fully Supported, Paid Enhancement, Not Supported. It is also available for immediate download and adjustment. So, changes can be made in the color, design, graphics or any other component to create a unique layout.
Vendor Selection Matrix For Buyer Marketing Icons PDF
This slide presents a comparative analysis of vendors which can be used in order to select appropriate vendor for implementing marketing strategies and achieve objectives. The basis of comparison are vendor name, marketing specialization, services offered, characteristics and ranking Pitch your topic with ease and precision using this Vendor Selection Matrix For Buyer Marketing Icons PDF. This layout presents information on Vendor Name, Marketing Specialization, Characteristics . It is also available for immediate download and adjustment. So, changes can be made in the color, design, graphics or any other component to create a unique layout.

Comparing Lean Operational Excellence Strategy Manufacturing Kpis With Competitors Mockup PDF
This slide showcases manufacturing KPIs comparison of company with competitors from the industry. Key KPIs included here are total cycle time, time for changeovers, capacity utilization, suppliers quality, reportable incidents, equipment efficiency etc. Pitch your topic with ease and precision using this Comparing Lean Operational Excellence Strategy Manufacturing Kpis With Competitors Mockup PDF. This layout presents information on Parameters, Rejection Rate, Quality. It is also available for immediate download and adjustment. So, changes can be made in the color, design, graphics or any other component to create a unique layout.
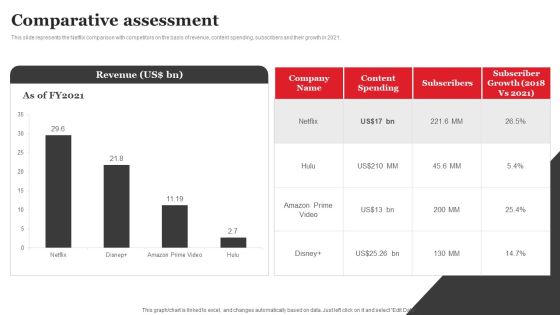
Streaming Platform Company Outline Comparative Assessment Guidelines PDF
This slide represents the Netflix comparison with competitors on the basis of revenue, content spending, subscribers and their growth in 2021. This Streaming Platform Company Outline Comparative Assessment Guidelines PDF from Slidegeeks makes it easy to present information on your topic with precision. It provides customization options, so you can make changes to the colors, design, graphics, or any other component to create a unique layout. It is also available for immediate download, so you can begin using it right away. Slidegeeks has done good research to ensure that you have everything you need to make your presentation stand out. Make a name out there for a brilliant performance.
