Compliance Dashboard
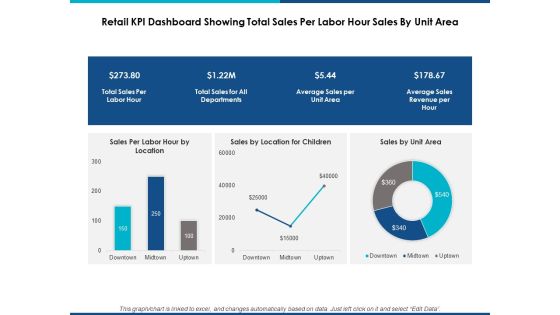
Retail Kpi Dashboard Showing Total Sales Per Labor Hour Sales By Unit Area Ppt Powerpoint Presentation Show Graphic Tips
This is a retail kpi dashboard showing total sales per labor hour sales by unit area ppt powerpoint presentation show graphic tips. This is a three stage process. The stages in this process are finance, marketing, management, investment, analysis.
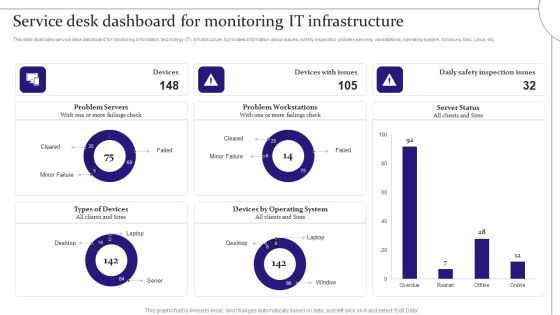
Service Desk Dashboard For Monitoring It Infrastructure Digitalization Of Service Desk Administration Ppt Summary Graphics Example PDF
This slide illustrates service desk dashboard for monitoring information technology IT infrastructure. It provides information about issues, safety inspection, problem servers, workstations, operating system, Windows, Mac, Linux, etc. Do you have to make sure that everyone on your team knows about any specific topic I yes, then you should give Service Desk Dashboard For Monitoring It Infrastructure Digitalization Of Service Desk Administration Ppt Summary Graphics Example PDF a try. Our experts have put a lot of knowledge and effort into creating this impeccable Service Desk Dashboard For Monitoring It Infrastructure Digitalization Of Service Desk Administration Ppt Summary Graphics Example PDF. You can use this template for your upcoming presentations, as the slides are perfect to represent even the tiniest detail. You can download these templates from the Slidegeeks website and these are easy to edit. So grab these today.

Healthcare Management Overview Trends Stats And Operational Areas Dashboard To Evaluate The Hospital Operations Performance Pictures PDF
The following slide showcases dashboard which can be used by the healthcare professionals to measure the performance of operational department. The KPIs covered in the slide are total patients, operational cost, available staff per division etc. There are so many reasons you need a Healthcare Management Overview Trends Stats And Operational Areas Dashboard To Evaluate The Hospital Operations Performance Pictures PDF. The first reason is you can not spend time making everything from scratch, Thus, Slidegeeks has made presentation templates for you too. You can easily download these templates from our website easily.

IT Reducing Costs And Management Tips Dashboard To Track IT Security Incidents Prevailing Across Firm Structure PDF
This slide portrays information regarding the dashboard that firm will track various incidents detected. These incidents will be managed in order to avoid security risks. Boost your pitch with our creative IT Reducing Costs And Management Tips Dashboard To Track IT Security Incidents Prevailing Across Firm Structure PDF. Deliver an awe-inspiring pitch that will mesmerize everyone. Using these presentation templates you will surely catch everyones attention. You can browse the ppts collection on our website. We have researchers who are experts at creating the right content for the templates. So you do not have to invest time in any additional work. Just grab the template now and use them.

Building An IT Strategy Plan For Business Expansion Dashboard To Track IT Security Incidents Prevailing Across Firm Infographics PDF
This slide portrays information regarding the dashboard that firm will track various incidents detected. These incidents will be managed in order to avoid security risks. There are so many reasons you need a Building An IT Strategy Plan For Business Expansion Dashboard To Track IT Security Incidents Prevailing Across Firm Infographics PDF. The first reason is you can not spend time making everything from scratch, Thus, Slidegeeks has made presentation templates for you too. You can easily download these templates from our website easily.
Cyber Security Cases Action Plan Risk Tracking Dashboard For Response Ppt PowerPoint Presentation File Graphics Example PDF
This slide highlights dashboard to identify and track security threats occurred in the company. The purpose of this template is to provide information to the management about severities of the incidents along with risk rating in form of heat map. Showcasing this set of slides titled Cyber Security Cases Action Plan Risk Tracking Dashboard For Response Ppt PowerPoint Presentation File Graphics Example PDF. The topics addressed in these templates are Risk Heat Map, Action Plan Breakdown, Risk Rating Breakdown. All the content presented in this PPT design is completely editable. Download it and make adjustments in color, background, font etc. as per your unique business setting.
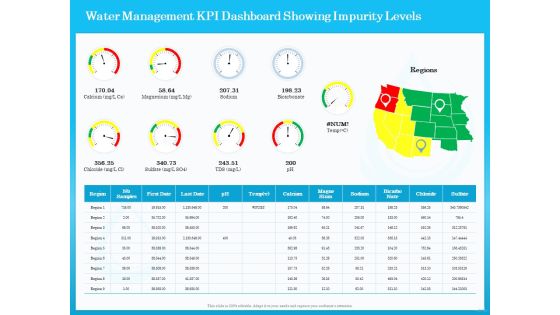
Monitoring And Evaluating Water Quality Water Management KPI Dashboard Showing Impurity Levels Ppt Show Design Inspiration PDF
Presenting this set of slides with name monitoring and evaluating water quality water management kpi dashboard showing impurity levels ppt show design inspiration pdf. The topics discussed in these slides are region, ph, magne sium, sodium, chloride, bicarbo nate. This is a completely editable PowerPoint presentation and is available for immediate download. Download now and impress your audience.
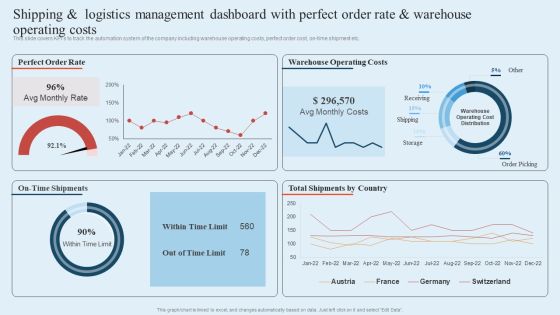
Integrating Logistics Automation Solution Shipping And Logistics Management Dashboard With Perfect Order Rate Ppt Infographics Files PDF
This slide covers KPIs to track the automation system of the company including warehouse operating costs, perfect order cost, on-time shipment etc. Crafting an eye-catching presentation has never been more straightforward. Let your presentation shine with this tasteful yet straightforward Integrating Logistics Automation Solution Shipping And Logistics Management Dashboard With Perfect Order Rate Ppt Infographics Files PDF template. It offers a minimalistic and classy look that is great for making a statement. The colors have been employed intelligently to add a bit of playfulness while still remaining professional. Construct the ideal Integrating Logistics Automation Solution Shipping And Logistics Management Dashboard With Perfect Order Rate Ppt Infographics Files PDF that effortlessly grabs the attention of your audience Begin now and be certain to wow your customers.
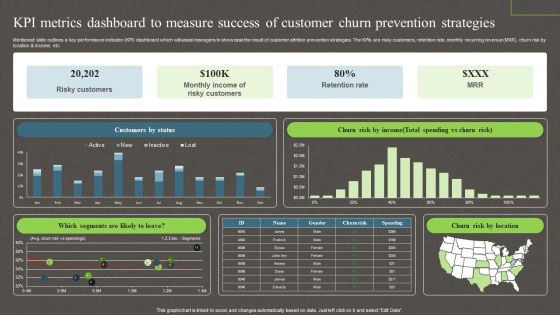
Kpi Metrics Dashboard To Measure Success Of Customer Churn Prevention Strategies Ppt PowerPoint Presentation File Model PDF
Mentioned slide outlines a key performance indicator KPI dashboard which will assist managers to showcase the result of customer attrition prevention strategies. The KPIs are risky customers, retention rate, monthly recurring revenue MRR, churn risk by location and income, etc. This Kpi Metrics Dashboard To Measure Success Of Customer Churn Prevention Strategies Ppt PowerPoint Presentation File Model PDF from Slidegeeks makes it easy to present information on your topic with precision. It provides customization options, so you can make changes to the colors, design, graphics, or any other component to create a unique layout. It is also available for immediate download, so you can begin using it right away. Slidegeeks has done good research to ensure that you have everything you need to make your presentation stand out. Make a name out there for a brilliant performance.
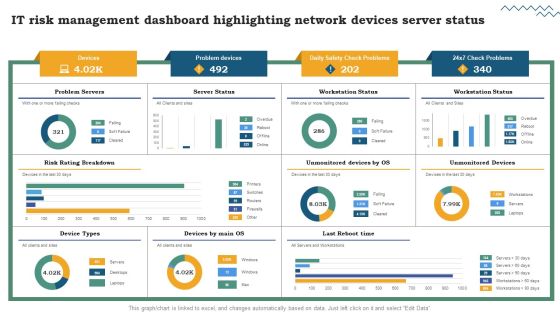
Risk Evaluation Of Information Technology Systems IT Risk Management Dashboard Highlighting Network Devices Server Status Professional PDF
If you are looking for a format to display your unique thoughts, then the professionally designed Risk Evaluation Of Information Technology Systems IT Risk Management Dashboard Highlighting Network Devices Server Status Professional PDF is the one for you. You can use it as a Google Slides template or a PowerPoint template. Incorporate impressive visuals, symbols, images, and other charts. Modify or reorganize the text boxes as you desire. Experiment with shade schemes and font pairings. Alter, share or cooperate with other people on your work. Download Risk Evaluation Of Information Technology Systems IT Risk Management Dashboard Highlighting Network Devices Server Status Professional PDF and find out how to give a successful presentation. Present a perfect display to your team and make your presentation unforgettable.

Techniques For Effective Supply Chain Management KPI Dashboard To Assess Performance Of Order And Shipments Structure PDF
This slide covers KPI dashboard to assess performance of integrating warehouse management system. It involves key details such as overall warehouse operating costs, perfect order rate and total number of shipments. Boost your pitch with our creative Techniques For Effective Supply Chain Management KPI Dashboard To Assess Performance Of Order And Shipments Structure PDF. Deliver an awe-inspiring pitch that will mesmerize everyone. Using these presentation templates you will surely catch everyones attention. You can browse the ppts collection on our website. We have researchers who are experts at creating the right content for the templates. So you do not have to invest time in any additional work. Just grab the template now and use them.

Optimizing Logistics Models To Enhance Supply Chain Management Supply Chain Dashboard To Measure Shipping Status Pictures PDF
This slide focuses on supply chain dashboard to measure shipping status which covers on time orders, orders in progress, late deliveries, average processing and order fulfillment rate, late deliveries, etc. Welcome to our selection of the Optimizing Logistics Models To Enhance Supply Chain Management Supply Chain Dashboard To Measure Shipping Status Pictures PDF. These are designed to help you showcase your creativity and bring your sphere to life. Planning and Innovation are essential for any business that is just starting out. This collection contains the designs that you need for your everyday presentations. All of our PowerPoints are 100 percent editable, so you can customize them to suit your needs. This multi purpose template can be used in various situations. Grab these presentation templates today.
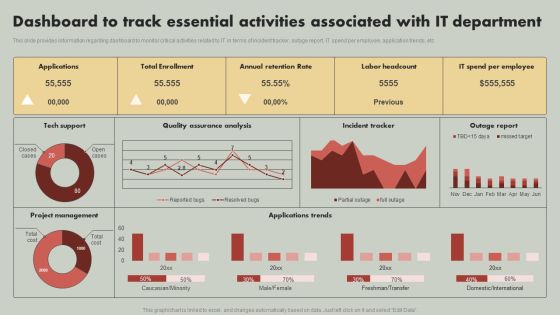
IT Reducing Costs And Management Tips Dashboard To Track Essential Activities Associated With IT Department Summary PDF
This slide provides information regarding dashboard to monitor critical activities related to IT in terms of incident tracker, outage report, IT spend per employee, application trends, etc. Are you in need of a template that can accommodate all of your creative concepts This one is crafted professionally and can be altered to fit any style. Use it with Google Slides or PowerPoint. Include striking photographs, symbols, depictions, and other visuals. Fill, move around, or remove text boxes as desired. Test out color palettes and font mixtures. Edit and save your work, or work with colleagues. Download IT Reducing Costs And Management Tips Dashboard To Track Essential Activities Associated With IT Department Summary PDF and observe how to make your presentation outstanding. Give an impeccable presentation to your group and make your presentation unforgettable.
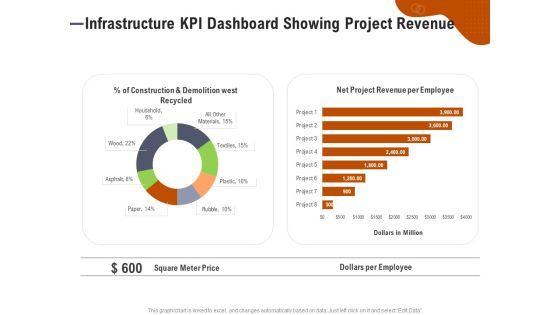
Key Features For Effective Business Management Infrastructure KPI Dashboard Showing Project Revenue Ppt Ideas File Formats PDF
Presenting this set of slides with name key features for effective business management infrastructure kpi dashboard showing project revenue ppt ideas file formats pdf. The topics discussed in these slides are construction and demolition west recycled, net project revenue per employee, square meter price, dollars per employee. This is a completely editable PowerPoint presentation and is available for immediate download. Download now and impress your audience.
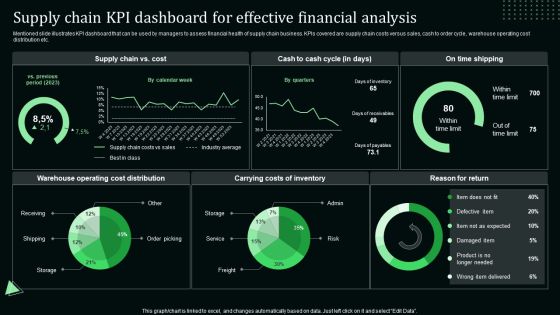
Supply Chain Kpi Dashboard For Effective Financial Analysis Stand Out Digital Supply Chain Tactics Enhancing Graphics PDF
Mentioned slide illustrates KPI dashboard that can be used by managers to assess financial health of supply chain business. KPIs covered are supply chain costs versus sales, cash to order cycle, warehouse operating cost distribution etc.Coming up with a presentation necessitates that the majority of the effort goes into the content and the message you intend to convey. The visuals of a PowerPoint presentation can only be effective if it supplements and supports the story that is being told. Keeping this in mind our experts created Supply Chain Kpi Dashboard For Effective Financial Analysis Stand Out Digital Supply Chain Tactics Enhancing Graphics PDF to reduce the time that goes into designing the presentation. This way, you can concentrate on the message while our designers take care of providing you with the right template for the situation.

Strategy To Enhance Supply Chain Operations KPI Dashboard To Assess Performance Of Order And Shipments Professional PDF
This slide covers KPI dashboard to assess performance of integrating warehouse management system. It involves key details such as overall warehouse operating costs, perfect order rate and total number of shipments. Slidegeeks has constructed Strategy To Enhance Supply Chain Operations KPI Dashboard To Assess Performance Of Order And Shipments Professional PDF after conducting extensive research and examination. These presentation templates are constantly being generated and modified based on user preferences and critiques from editors. Here, you will find the most attractive templates for a range of purposes while taking into account ratings and remarks from users regarding the content. This is an excellent jumping off point to explore our content and will give new users an insight into our top notch PowerPoint Templates.
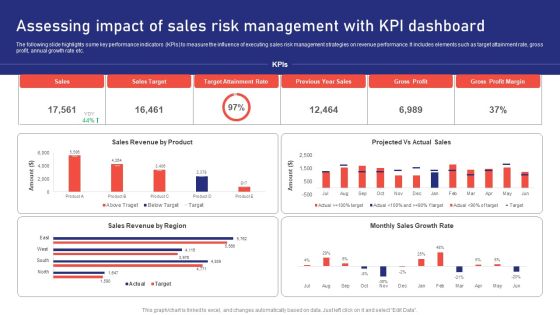
Sales Risk Assessment For Profit Maximization Assessing Impact Of Sales Risk Management With Kpi Dashboard Inspiration PDF
The following slide highlights some key performance indicators KPIs to measure the influence of executing sales risk management strategies on revenue performance. It includes elements such as target attainment rate, gross profit, annual growth rate etc. Find a pre designed and impeccable Sales Risk Assessment For Profit Maximization Assessing Impact Of Sales Risk Management With Kpi Dashboard Inspiration PDF. The templates can ace your presentation without additional effort. You can download these easy to edit presentation templates to make your presentation stand out from others. So, what are you waiting for Download the template from Slidegeeks today and give a unique touch to your presentation.
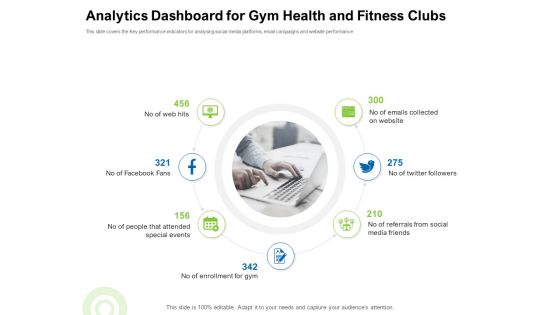
Strategies To Enter Physical Fitness Club Business Analytics Dashboard For Gym Health And Fitness Clubs Brochure PDF
This slide covers the Key performance indicators for analysing social media platforms, email campaigns and website performance This is a strategies to enter physical fitness club business analytics dashboard for gym health and fitness clubs brochure pdf template with various stages. Focus and dispense information on seven stages using this creative set, that comes with editable features. It contains large content boxes to add your information on topics like web, facebook, twitter, followers, friends. You can also showcase facts, figures, and other relevant content using this PPT layout. Grab it now.
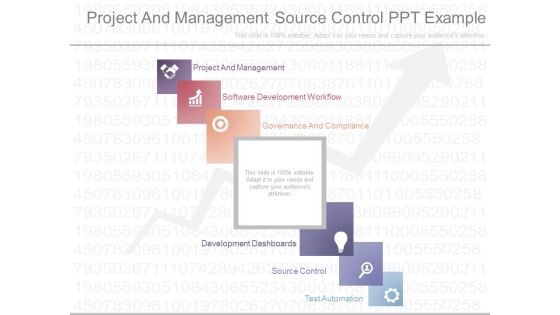
Project And Management Source Control Ppt Example
This is a project and management source control ppt example. This is a six stage process. The stages in this process are project and management, software development workflow, governance and compliance, development dashboards, source control, test automation.

Dashboards For Measuring Business Performance Ppt Icon
This is a dashboards for measuring business performance ppt icon. This is a three stage process. The stages in this process are dashboard, measuring, management, speedometer, icons, strategy.

Dashboards And Scorecards Comparison Diagram Ppt Slides
This is a dashboards and scorecards comparison diagram ppt slides. This is a three stage process. The stages in this process are dashboard, balanced scorecard, differences, performance management, periodically monthly, gps shows how will arrive, is used for, is update, in automobile it is, performance monitoring, in real time, automobile dashboard shows how your car is operating.
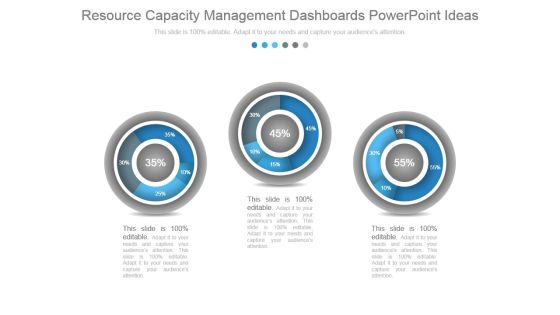
Resource Capacity Management Dashboards Powerpoint Ideas
This is a resource capacity management dashboards powerpoint ideas. This is a three stage process. The stages in this process are dashboard, percentage, measuring, business, marketing.

Business Company Dashboards Ppt Powerpoint Slide Show
This is a business company dashboards ppt powerpoint slide show. This is a four stage process. The stages in this process are presentation, finance, management, business, strategy, success.

Executive Dashboards Systems Example Of Ppt Presentation
This is a executive dashboards systems example of ppt presentation. This is a five stage process. The stages in this process are schedule management, resource management, document management, inventory management, meeting management.
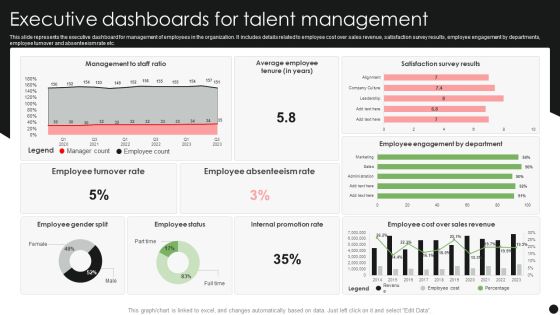
Executive Dashboards For Talent Management Pictures PDF
This slide represents the executive dashboard for management of employees in the organization. It includes details related to employee cost over sales revenue, satisfaction survey results, employee engagement by departments, employee turnover and absenteeism rate etc. Showcasing this set of slides titled Executive Dashboards For Talent Management Pictures PDF. The topics addressed in these templates are Employee Turnover Rate, Employee Absenteeism Rate, Internal Promotion Rate. All the content presented in this PPT design is completely editable. Download it and make adjustments in color, background, font etc. as per your unique business setting.

Analytical Dashboarding Ppt Powerpoint Presentation Slides Cpb
This is a analytical dashboarding ppt powerpoint presentation slides cpb. This is a five stage process. The stages in this process are analytical dashboarding.
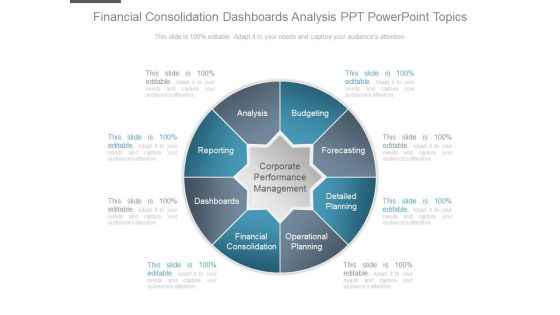
Financial Consolidation Dashboards Analysis Ppt Powerpoint Topics
This is a financial consolidation dashboards analysis ppt powerpoint topics. This is a eight stage process. The stages in this process are corporate performance management, budgeting, forecasting, detailed planning, operational planning, financial consolidation, dashboards, reporting, analysis.

Best Looking Dashboards Diagram Example File
This is a best looking dashboards diagram example file. This is a three stage process. The stages in this process are business, marketing, finance, presentation, management.

Social Media Management Analytics Dashboards Powerpoint Slides
This is a social media management analytics dashboards powerpoint slides. This is a four stage process. The stages in this process are reach and engagement, audience profile, traffic, audience size, sentiment analysis, content analysis, competitive benchmarking, community responsiveness.\n\n\n\n\n\n
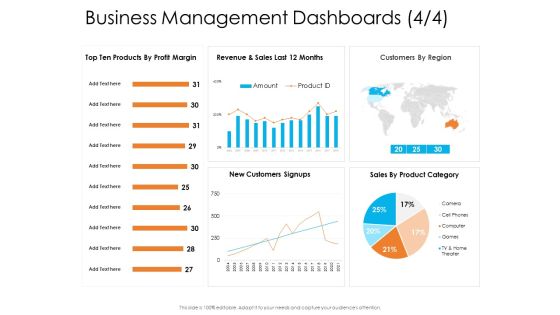
Enterprise Governance Business Management Dashboards Slides PDF
Deliver and pitch your topic in the best possible manner with this enterprise governance business management dashboards slides pdf. Use them to share invaluable insights on revenue, customers by region, sales by product category and impress your audience. This template can be altered and modified as per your expectations. So, grab it now.

Business Management Dashboards Actual Income Themes PDF
Deliver and pitch your topic in the best possible manner with this business management dashboards actual income themes pdf. Use them to share invaluable insights on actual income vs budget and impress your audience. This template can be altered and modified as per your expectations. So, grab it now.

Business Management Dashboards Manufacturing Formats PDF
Deliver an awe-inspiring pitch with this creative business management dashboards manufacturing formats pdf. bundle. Topics like revenue, manufacturing, operations, products can be discussed with this completely editable template. It is available for immediate download depending on the needs and requirements of the user.

Business Management Dashboards Revenue Designs PDF
Deliver and pitch your topic in the best possible manner with this business management dashboards revenue designs pdf. Use them to share invaluable insights on revenue and sales, sales by product category and impress your audience. This template can be altered and modified as per your expectations. So, grab it now.

Business Management Dashboards Target Portrait PDF
Deliver an awe-inspiring pitch with this creative business management dashboards target portrait pdf. bundle. Topics like target revenue, actual revenue can be discussed with this completely editable template. It is available for immediate download depending on the needs and requirements of the user.

Business Management Dashboards Ppt Gallery Guidelines PDF
Deliver an awe inspiring pitch with this creative business management dashboards ppt gallery guidelines pdf bundle. Topics like customers, sales, revenue, products can be discussed with this completely editable template. It is available for immediate download depending on the needs and requirements of the user.

Supplier Association Management Techniques Supplier Evaluation Matrix Summary PDF
This slide covers the supplier assessment matric via weighted average method including criteria such as quality, price, suppliers impression etc. Deliver and pitch your topic in the best possible manner with this supplier association management techniques supplier compliance kpi dashboard topics pdf. Use them to share invaluable insights on reduction in costs increased efficiency, increase in profitability and impress your audience. This template can be altered and modified as per your expectation. So, grab it now.
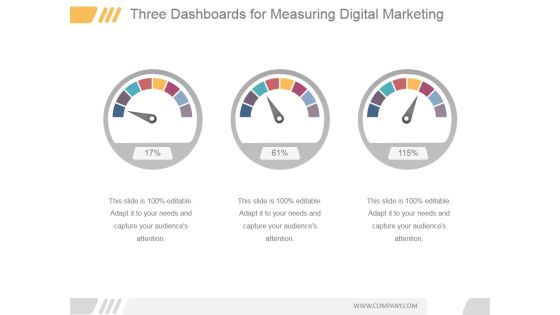
Three Dashboards For Measuring Digital Marketing Ppt PowerPoint Presentation Slide
This is a three dashboards for measuring digital marketing ppt powerpoint presentation slide. This is a three stage process. The stages in this process are dashboard, measuring, business, marketing, percentage.

Dashboards For Profit Growth Ppt PowerPoint Presentation Summary Templates
This is a dashboards for profit growth ppt powerpoint presentation summary templates. This is a four stage process. The stages in this process are task completion, assignment completion, work completion.
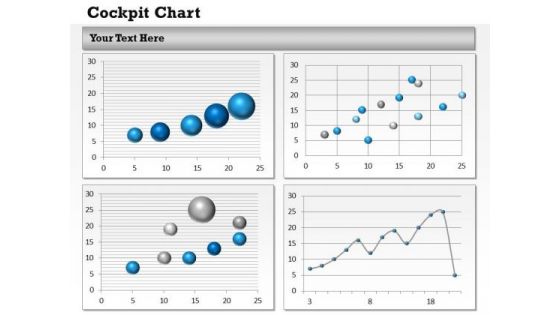
Business Diagram Performance Dashboards For Business Strategic Management
Be The Doer With Our Business Diagram Performance Dashboards For Business Strategic Management Powerpoint Templates. Put Your Thoughts Into Practice.

Dashboards For Effective Business Administration Powerpoint Slide Influencers
This is a dashboards for effective business administration powerpoint slide influencers. This is a four stage process. The stages in this process are customer, internal business processes, financial, learning and growth.

ISO 9001 Certification Procedure Quality Management System Dashboards Graphics PDF
This template covers Quality management system dashboard including KPIs such as summary details, customer complaints, documents, action plan status. Deliver an awe inspiring pitch with this creative ISO 9001 Certification Procedure Quality Management System Dashboards Graphics PDF bundle. Topics like Quality Management, System Dashboards, Customer Complaints can be discussed with this completely editable template. It is available for immediate download depending on the needs and requirements of the user.

Team Manager Administration KPI Metrics And Dashboards Microsoft Pdf
This is a team manager administration kpi metrics and dashboards microsoft pdf. template with various stages. Focus and dispense information on two stages using this creative set, that comes with editable features. It contains large content boxes to add your information on topics like kpi metrics, dashboard metrics. You can also showcase facts, figures, and other relevant content using this PPT layout. Grab it now.
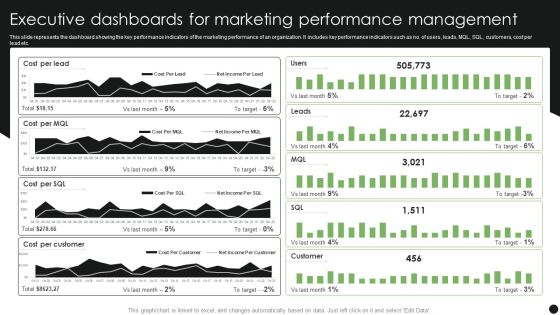
Executive Dashboards For Marketing Performance Management Slides PDF
This slide represents the dashboard showing the key performance indicators of the marketing performance of an organization. It includes key performance indicators such as no. of users, leads, MQL, SQL, customers, cost per lead etc. Pitch your topic with ease and precision using this Executive Dashboards For Marketing Performance Management Slides PDF. This layout presents information on Cost Per Lead, Cost Per Customer. It is also available for immediate download and adjustment. So, changes can be made in the color, design, graphics or any other component to create a unique layout.
Strategic Dashboards Ppt PowerPoint Presentation Slides Graphic Images Cpb
This is a strategic dashboards ppt powerpoint presentation slides graphic images cpb. This is a two stage process. The stages in this process are strategic dashboards.

Brand Dashboarding Ppt PowerPoint Presentation Inspiration Graphics Cpb
This is a brand dashboarding ppt powerpoint presentation inspiration graphics cpb. This is a twelve stage process. The stages in this process are brand dashboarding, business, management, marketing.

Supplier Relationship Management Supplier Performance Management KPI Dashboards Information PDF
This slide covers supplier performance management KPI dashboards along with metrics such as suppliers availability, supplier ratings, suppliers defence rate and type etc. Deliver an awe inspiring pitch with this creative Supplier Relationship Management Supplier Performance Management KPI Dashboards Information PDF bundle. Topics like Supplier Performance Management Kpi Dashboards can be discussed with this completely editable template. It is available for immediate download depending on the needs and requirements of the user.

Distributor Strategy Supplier Performance Management Kpi Dashboards Summary PDF
This slide covers supplier performance management KPI dashboards along with metrics such as suppliers availability, supplier ratings, suppliers defence rate and type etc. Deliver and pitch your topic in the best possible manner with this distributor strategy supplier performance management kpi dashboards summary pdf. Use them to share invaluable insights on supplier performance management kpi dashboards and impress your audience. This template can be altered and modified as per your expectations. So, grab it now.

Business Strategy Development Process Business Management Dashboards Revenue Download PDF
Deliver an awe inspiring pitch with this creative business strategy development process business management dashboards revenue download pdf bundle. Topics like business management dashboards can be discussed with this completely editable template. It is available for immediate download depending on the needs and requirements of the user.

Corporate Governance Business Management Dashboards Growth Brochure PDF
Deliver an awe inspiring pitch with this creative corporate governance business management dashboards growth brochure pdf bundle. Topics like business management dashboards can be discussed with this completely editable template. It is available for immediate download depending on the needs and requirements of the user.
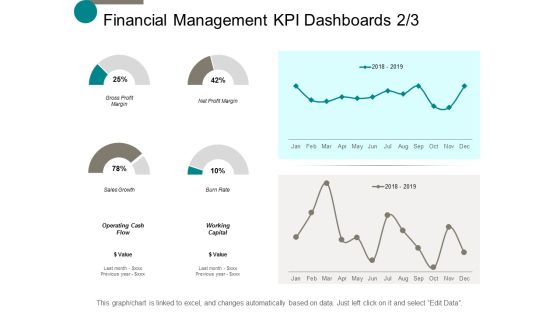
Financial Management Kpi Dashboards Marketing Ppt Powerpoint Presentation Infographics Outline
This is a financial management kpi dashboards marketing ppt powerpoint presentation infographics outline. This is a six stage process. The stages in this process are finance, marketing, management, investment, analysis.
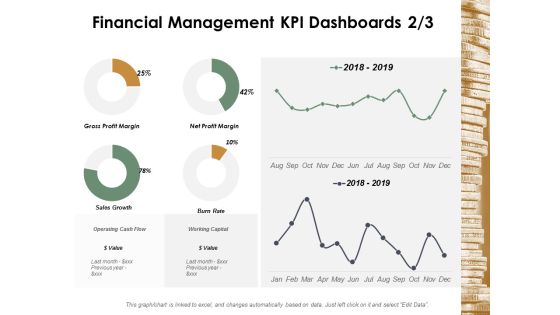
Financial Management Kpi Dashboards Management Ppt Powerpoint Presentation Slides Tips
This is a financial management kpi dashboards management ppt powerpoint presentation slides tips. This is a six stage process. The stages in this process are finance, marketing, management, investment, analysis.

Financial Management Kpi Dashboards Business Ppt Powerpoint Presentation Show Gridlines
This is a financial management kpi dashboards business ppt powerpoint presentation show gridlines. This is a four stage process. The stages in this process are finance, marketing, management, investment, analysis.
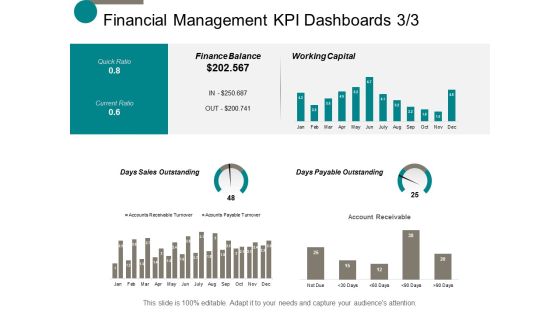
Financial Management Kpi Dashboards Finance Ppt Powerpoint Presentation Ideas Brochure
This is a financial management kpi dashboards finance ppt powerpoint presentation ideas brochure. This is a six stage process. The stages in this process are finance, marketing, management, investment, analysis.
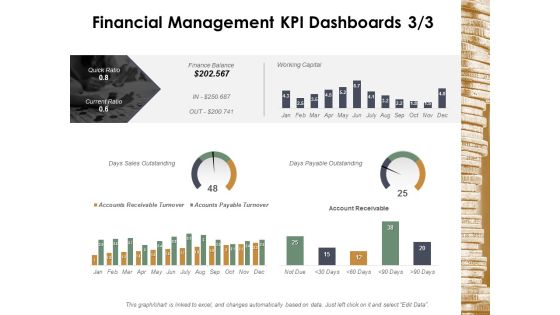
Financial Management Kpi Dashboards Marketing Ppt Powerpoint Presentation Professional Portrait
This is a financial management kpi dashboards marketing ppt powerpoint presentation professional portrait. This is a six stage process. The stages in this process are finance, marketing, management, investment, analysis.
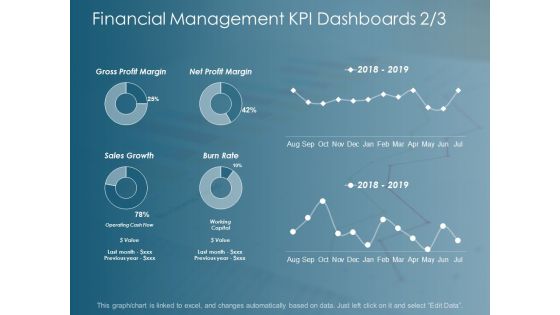
Financial Management Kpi Dashboards Business Ppt Powerpoint Presentation Inspiration Designs
This is a financial management kpi dashboards business ppt powerpoint presentation inspiration designs. This is a six stage process. The stages in this process are finance, marketing, management, investment, analysis.

Financial Management Kpi Dashboards Marketing Ppt Powerpoint Presentation Inspiration Microsoft
This is a financial management kpi dashboards marketing ppt powerpoint presentation inspiration microsoft. This is a one stage process. The stages in this process are finance, marketing, management, investment, analysis.
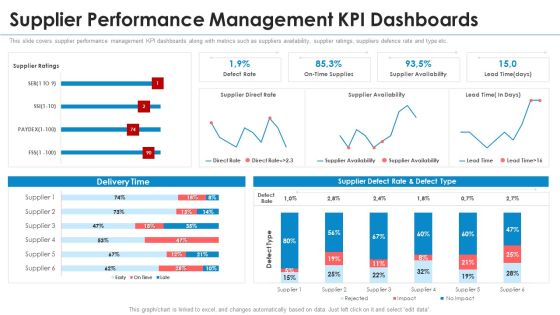
SRM Strategy Supplier Performance Management KPI Dashboards Elements PDF
This slide covers supplier performance management KPI dashboards along with metrics such as suppliers availability, supplier ratings, suppliers defence rate and type etc. Deliver and pitch your topic in the best possible manner with this srm strategy supplier performance management kpi dashboards elements pdf. Use them to share invaluable insights on rate, supplier and impress your audience. This template can be altered and modified as per your expectations. So, grab it now.
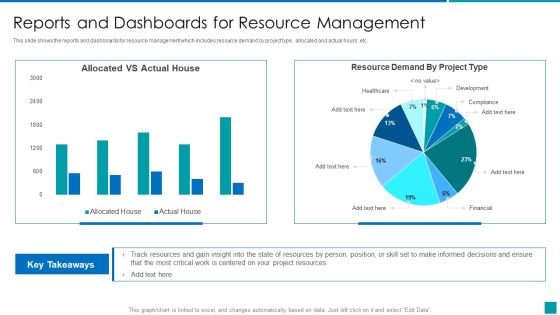
Reports And Dashboards For Resource Management Background PDF
This slide shows the reports and dashboards for resource management which includes resource demand by project type, allocated and actual hours, etc. Deliver and pitch your topic in the best possible manner with this Reports And Dashboards For Resource Management Background PDF. Use them to share invaluable insights on Resources, Project, Demand and impress your audience. This template can be altered and modified as per your expectations. So, grab it now.
Inventory Delivery On Time Dashboards Ppt PowerPoint Presentation Icon Template
This is a inventory delivery on time dashboards ppt powerpoint presentation icon template. This is a three stage process. The stages in this process are finance, marketing, management, investment, analysis.
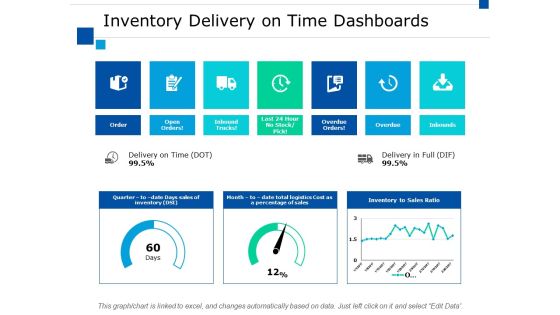
Inventory Delivery On Time Dashboards Ppt PowerPoint Presentation Slides Download
This is a inventory delivery on time dashboards ppt powerpoint presentation slides download. This is a seven stage process. The stages in this process are finance, marketing, management, investment, analysis.
 Home
Home