Comparison Table
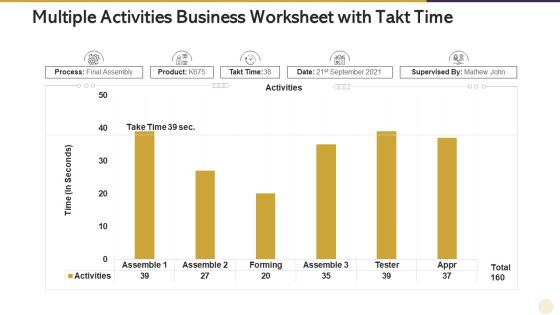
Multiple Activities Business Worksheet With Takt Time Rules PDF
Pitch your topic with ease and precision using this multiple activities business worksheet with takt time rules pdf. This layout presents information on multiple activities business worksheet with takt time. It is also available for immediate download and adjustment. So, changes can be made in the color, design, graphics or any other component to create a unique layout.
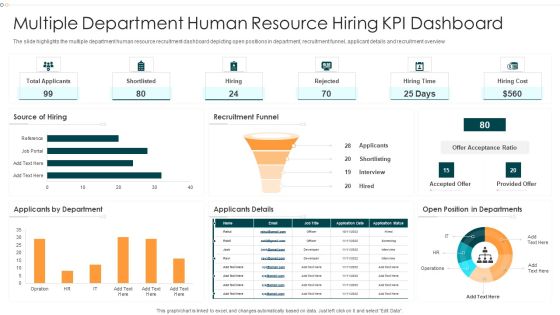
Multiple Department Human Resource Hiring KPI Dashboard Professional PDF
The slide highlights the multiple department human resource recruitment dashboard depicting open positions in department, recruitment funnel, applicant details and recruitment overview.Pitch your topic with ease and precision using this Multiple Department Human Resource Hiring KPI Dashboard Professional PDF This layout presents information on Recruitment Funnel, Position Departments, Source Of Hiring It is also available for immediate download and adjustment. So, changes can be made in the color, design, graphics or any other component to create a unique layout.

Multiple Region Customer Business Service Delivery Framework Assessment Themes PDF
Pitch your topic with ease and precision using this Multiple Region Customer Business Service Delivery Framework Assessment Themes PDF. This layout presents information on Customer, Business, Service. It is also available for immediate download and adjustment. So, changes can be made in the color, design, graphics or any other component to create a unique layout.
Project Tracking Dashboard With Multiple Metrics Pictures PDF
The following slide highlights the KPI of project management to avoid deviations. It includes elements such as schedule, tasks, issue assessment, budget and risk analysis etc. Pitch your topic with ease and precision using this Project Tracking Dashboard With Multiple Metrics Pictures PDF. This layout presents information on Projected Budget Analysis, Risk Analysis, Quality Affirmation. It is also available for immediate download and adjustment. So, changes can be made in the color, design, graphics or any other component to create a unique layout.

Dashboard To Manage Marketing Campaigns Of Multiple Brands Summary PDF
This slide showcases dashboard that can help organization to manage the marketing campaigns in multi brand strategy. Its key elements are lead breakdown, total leads, key conversion metrics etc. Presenting this PowerPoint presentation, titled Dashboard To Manage Marketing Campaigns Of Multiple Brands Summary PDF, with topics curated by our researchers after extensive research. This editable presentation is available for immediate download and provides attractive features when used. Download now and captivate your audience. Presenting this Dashboard To Manage Marketing Campaigns Of Multiple Brands Summary PDF. Our researchers have carefully researched and created these slides with all aspects taken into consideration. This is a completely customizable Dashboard To Manage Marketing Campaigns Of Multiple Brands Summary PDF that is available for immediate downloading. Download now and make an impact on your audience. Highlight the attractive features available with our PPTs.

Multiple Reasons To Plan Brand Advertisement Clipart PDF
This slide demonstrates marketing plan reasons to understand the importance of brand marketing in industry. It involves factors that are recalling brand name, building company reputation, attracting skilled workers, increase customer loyalty, construct strong firm identity, improve ROI, increase sales, etc. Pitch your topic with ease and precision using this Multiple Reasons To Plan Brand Advertisement Clipart PDF. This layout presents information on Key Insights, New Market, Advertisement. It is also available for immediate download and adjustment. So, changes can be made in the color, design, graphics or any other component to create a unique layout.

Comparative Assessment Of Operations Administrator Compensation By Multiple Countries Themes PDF
Mentioned slide showcases comparative analysis of various compensation paid to operations executive by different countries. It includes various compensation types such as basic salary, bonus, cash compensation and stock options. Pitch your topic with ease and precision using this Comparative Assessment Of Operations Administrator Compensation By Multiple Countries Themes PDF. This layout presents information on Communication Skills, Leadership, Operational Executive, Organisation Management. It is also available for immediate download and adjustment. So, changes can be made in the color, design, graphics or any other component to create a unique layout.
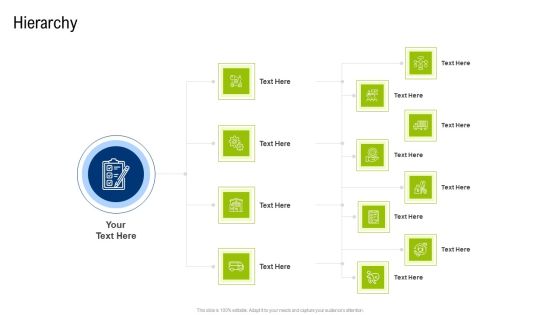
Multiple Phases For Supply Chain Management Hierarchy Ideas PDF
This is a multiple phases for supply chain management hierarchy ideas pdf template with various stages. Focus and dispense information on three stages using this creative set, that comes with editable features. It contains large content boxes to add your information on topics like hierarchy. You can also showcase facts, figures, and other relevant content using this PPT layout. Grab it now.

Multiple Phases For Supply Chain Management Performance Measures Themes PDF
This is a multiple phases for supply chain management performance measures themes pdf template with various stages. Focus and dispense information on two stages using this creative set, that comes with editable features. It contains large content boxes to add your information on topics like non financial measures, financial measures. You can also showcase facts, figures, and other relevant content using this PPT layout. Grab it now.
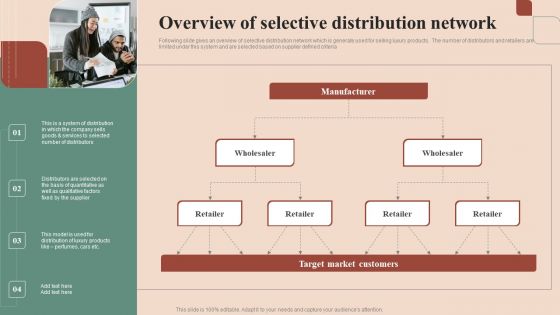
Maximizing Profit Returns With Right Distribution Source Overview Of Selective Distribution Network Information PDF
Following slide gives an overview of selective distribution network which is generally used for selling luxury products. The number of distributors and retailers are limited under this system and are selected based on supplier defined criteria. Following slide gives an overview of selective distribution network which is generally used for selling luxury products. The number of distributors and retailers are limited under this system and are selected based on supplier defined criteria. Are you searching for a Maximizing Profit Returns With Right Distribution Source Overview Of Selective Distribution Network Information PDF that is uncluttered, straightforward, and original. Its easy to edit, and you can change the colors to suit your personal or business branding. For a presentation that expresses how much effort you have put in, this template is ideal. With all of its features, including tables, diagrams, statistics, and lists, its perfect for a business plan presentation. Make your ideas more appealing with these professional slides. Download Maximizing Profit Returns With Right Distribution Source Overview Of Selective Distribution Network Information PDF from Slidegeeks today.

Detailed Analysis Of Red Ocean Vs Blue Ocean Approach Price Corridor Of The Target Mass Guidelines PDF
This template covers price corridor tool that can be used by managers to determine the right price to unlock the mass of target buyers. It is used when setting a strategic price for a product or service. Managers evaluate the trade-offs that buyers consider while making their purchasing decision, as well as the level of legal and resource protection that will block other companies from imitating their offering. Are you searching for a Detailed Analysis Of Red Ocean Vs Blue Ocean Approach Price Corridor Of The Target Mass Guidelines PDF that is uncluttered, straightforward, and original Its easy to edit, and you can change the colors to suit your personal or business branding. For a presentation that expresses how much effort you have put in, this template is ideal. With all of its features, including tables, diagrams, statistics, and lists, its perfect for a business plan presentation. Make your ideas more appealing with these professional slides. Download Detailed Analysis Of Red Ocean Vs Blue Ocean Approach Price Corridor Of The Target Mass Guidelines PDF from Slidegeeks today.
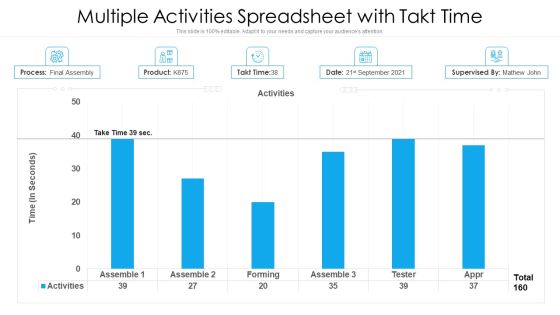
Multiple Activities Spreadsheet With Takt Time Ppt PowerPoint Presentation Slides Template PDF
Pitch your topic with ease and precision using this multiple activities spreadsheet with takt time ppt powerpoint presentation slides template pdf. This layout presents information on multiple activities spreadsheet with takt time. It is also available for immediate download and adjustment. So, changes can be made in the color, design, graphics or any other component to create a unique layout.

US Internet Access By Multiple Platform And Age Categories Pictures PDF
Pitch your topic with ease and precision using this US Internet Access By Multiple Platform And Age Categories Pictures PDF. This layout presents information on US Internet Access, Multiple Platform, Age Categories. It is also available for immediate download and adjustment. So, changes can be made in the color, design, graphics or any other component to create a unique layout.
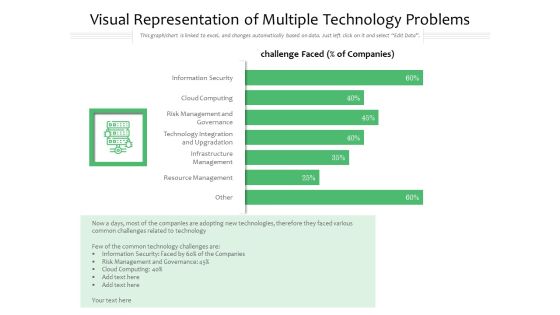
Visual Representation Of Multiple Technology Problems Ppt PowerPoint Presentation Gallery Design Inspiration PDF
Pitch your topic with ease and precision using this visual representation of multiple technology problems ppt powerpoint presentation gallery design inspiration pdf. This layout presents information on information security, technology integration, infrastructure. It is also available for immediate download and adjustment. So, changes can be made in the color, design, graphics or any other component to create a unique layout.

Cloud Performance Tracking Dashboard Managing Complexity Of Multiple Cloud Platforms Download PDF
This slide covers the key performance indicators for tracking performance of the cloud such as violations break down, sources, rules and severity.Presenting this PowerPoint presentation, titled Cloud Performance Tracking Dashboard Managing Complexity Of Multiple Cloud Platforms Download PDF, with topics curated by our researchers after extensive research. This editable presentation is available for immediate download and provides attractive features when used. Download now and captivate your audience. Presenting this Cloud Performance Tracking Dashboard Managing Complexity Of Multiple Cloud Platforms Download PDF. Our researchers have carefully researched and created these slides with all aspects taken into consideration. This is a completely customizable Cloud Performance Tracking Dashboard Managing Complexity Of Multiple Cloud Platforms Download PDF that is available for immediate downloading. Download now and make an impact on your audience. Highlight the attractive features available with our PPTs.
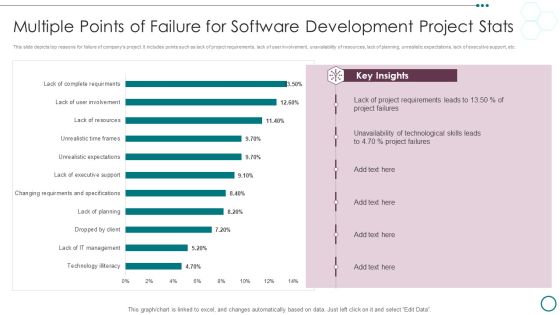
Multiple Points Of Failure For Software Development Project Stats Ppt PowerPoint Presentation Infographics Slides PDF
This slide depicts top reasons for failure of companys project. It includes points such as lack of project requirements, lack of user involvement, unavailability of resources, lack of planning, unrealistic expectations, lack of executive support, etc.Pitch your topic with ease and precision using this Multiple Points Of Failure For Software Development Project Stats Ppt PowerPoint Presentation Infographics Slides PDF. This layout presents information on Project Requirements, Unavailability Technological, Project Failures. It is also available for immediate download and adjustment. So, changes can be made in the color, design, graphics or any other component to create a unique layout.
Multiple Project Progress Tracking Report Dashboard With Key Performance Indicators Brochure PDF
This slide shows the dashboard representing status of various projects and tracking their performance with the help of key performance indicators which are as follows schedule, budget, resources, risk and issues and quality of projects.Pitch your topic with ease and precision using this Multiple Project Progress Tracking Report Dashboard With Key Performance Indicators Brochure PDF. This layout presents information on Risks Issues, Quality Open Defects, Techno Blogger. It is also available for immediate download and adjustment. So, changes can be made in the color, design, graphics or any other component to create a unique layout.
Multiple Projects Progress Tracking Report Management Dashboard With Duration Summary PDF
This slide shows the dashboard representing status of various projects which would be helpful in project management. It shows information related to project status, tasks status, milestones completed, upcoming milestones, critical tasks, projects names along with their start and end date, duration etc.Pitch your topic with ease and precision using this Multiple Projects Progress Tracking Report Management Dashboard With Duration Summary PDF. This layout presents information on Start Date, Finish Date, Percent Complete. It is also available for immediate download and adjustment. So, changes can be made in the color, design, graphics or any other component to create a unique layout.
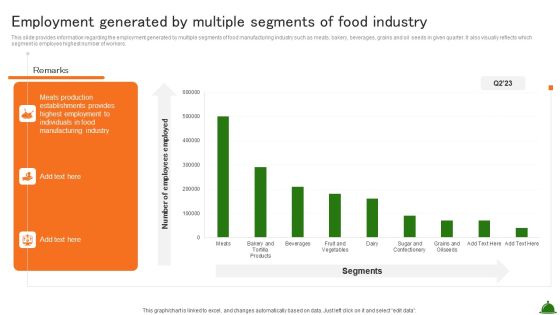
Employment Generated By Multiple Segments Of Food Industry Industry Analysis Of Food Sample PDF
This slide provides information regarding the employment generated by multiple segments of food manufacturing industry such as meats, bakery, beverages, grains and oil seeds in given quarter. It also visually reflects which segment is employee highest number of workers.This Employment Generated By Multiple Segments Of Food Industry Industry Analysis Of Food Sample PDF is perfect for any presentation, be it in front of clients or colleagues. It is a versatile and stylish solution for organizing your meetings. The product features a modern design for your presentation meetings. The adjustable and customizable slides provide unlimited possibilities for acing up your presentation. Slidegeeks has done all the homework before launching the product for you. So, do not wait, grab the presentation templates today.
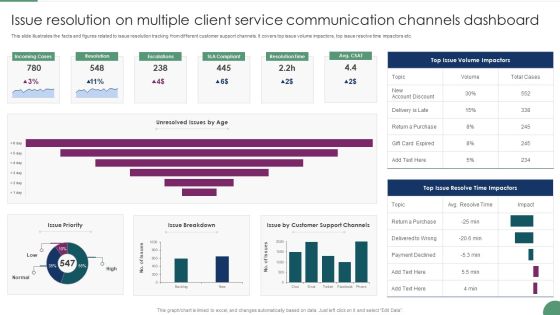
Issue Resolution On Multiple Client Service Communication Channels Dashboard Microsoft PDF
This slide illustrates the facts and figures related to issue resolution tracking from different customer support channels. It covers top issue volume impactors, top issue resolve time impactors etc. Pitch your topic with ease and precision using this Issue Resolution On Multiple Client Service Communication Channels Dashboard Microsoft PDF This layout presents information on Incoming Cases, Resolution, Escalations. It is also available for immediate download and adjustment. So, changes can be made in the color, design, graphics or any other component to create a unique layout.

Multiple Elements Stacked Marketing Process 6 Stages Ppt Best Business Plan PowerPoint Templates
We present our multiple elements stacked marketing process 6 stages ppt best business plan PowerPoint templates.Download and present our Circle Charts PowerPoint Templates because you should Whip up a frenzy with our PowerPoint Templates and Slides. They will fuel the excitement of your team. Download and present our Arrows PowerPoint Templates because Timeline crunches are a fact of life. Meet all deadlines using our PowerPoint Templates and Slides. Present our Business PowerPoint Templates because Our PowerPoint Templates and Slides will help you be quick off the draw. Just enter your specific text and see your points hit home. Use our Process and Flows PowerPoint Templates because You should Kick up a storm with our PowerPoint Templates and Slides. The heads of your listeners will swirl with your ideas. Present our Marketing PowerPoint Templates because You are working at that stage with an air of royalty. Let our PowerPoint Templates and Slides be the jewels in your crown.Use these PowerPoint slides for presentations relating to Business, circle, process, leadership, components, concept, presentation, teamwork, internet, template, diagram,change, scheme, report, marketing, technology, connection, chart, system, strategy, project, direction, growth, levels, banner, progress, background, structure . The prominent colors used in the PowerPoint template are Gray, White, Blue light.
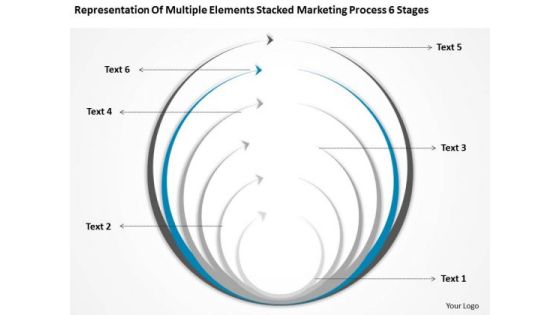
Multiple Elements Stacked Marketing Process 6 Stages Ppt Business Plan Model PowerPoint Slides
We present our multiple elements stacked marketing process 6 stages ppt business plan model PowerPoint Slides.Download our Circle Charts PowerPoint Templates because It will Strengthen your hand with your thoughts. They have all the aces you need to win the day. Download and present our Arrows PowerPoint Templates because Our PowerPoint Templates and Slides are topically designed to provide an attractive backdrop to any subject. Present our Business PowerPoint Templates because Our PowerPoint Templates and Slides will embellish your thoughts. See them provide the desired motivation to your team. Download our Process and Flows PowerPoint Templates because Our PowerPoint Templates and Slides are innately eco-friendly. Their high recall value negate the need for paper handouts. Download our Marketing PowerPoint Templates because You can Score a slam dunk with our PowerPoint Templates and Slides. Watch your audience hang onto your every word.Use these PowerPoint slides for presentations relating to Business, circle, process, leadership, components, concept, presentation, teamwork, internet, template, diagram,change, scheme, report, marketing, technology, connection, chart, system, strategy, project, direction, growth, levels, banner, progress, background, structure . The prominent colors used in the PowerPoint template are Blue, Gray, White.

Adopting Multiple Tactics To Improve Inventory Optimization Dashboard To Track Warehouse Shipments And Operating Cost Template PDF
This slide showcases dashboard that can help organization to track operating cost incurred by organization in different warehousing activities. Its other key elements are - perfect order rate, total shipments by country and on time shipments. Presenting this PowerPoint presentation, titled Adopting Multiple Tactics To Improve Inventory Optimization Dashboard To Track Warehouse Shipments And Operating Cost Template PDF, with topics curated by our researchers after extensive research. This editable presentation is available for immediate download and provides attractive features when used. Download now and captivate your audience. Presenting this Adopting Multiple Tactics To Improve Inventory Optimization Dashboard To Track Warehouse Shipments And Operating Cost Template PDF. Our researchers have carefully researched and created these slides with all aspects taken into consideration. This is a completely customizable Adopting Multiple Tactics To Improve Inventory Optimization Dashboard To Track Warehouse Shipments And Operating Cost Template PDF that is available for immediate downloading. Download now and make an impact on your audience. Highlight the attractive features available with our PPTs.
Multiple Pie Graphs Ppt PowerPoint Presentation Complete Deck With Slides
Boost your confidence and team morale with this well-structured Multiple Pie Graphs Ppt PowerPoint Presentation Complete Deck With Slides. This prefabricated set gives a voice to your presentation because of its well-researched content and graphics. Our experts have added all the components very carefully, thus helping you deliver great presentations with a single click. Not only that, it contains a set of twelve slides that are designed using the right visuals, graphics, etc. Various topics can be discussed, and effective brainstorming sessions can be conducted using the wide variety of slides added in this complete deck. Apart from this, our PPT design contains clear instructions to help you restructure your presentations and create multiple variations. The color, format, design anything can be modified as deemed fit by the user. Not only this, it is available for immediate download. So, grab it now.
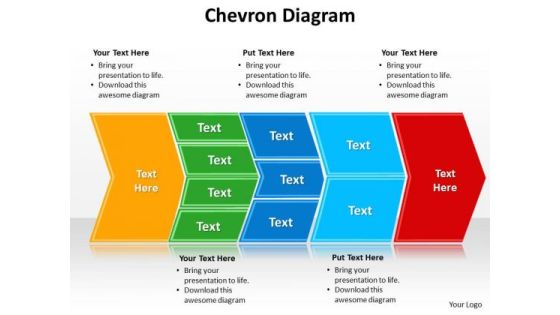
Ppt Describing Multiple Components Using Chevron Diagram PowerPoint Templates
PPT describing multiple components using chevron diagram PowerPoint Templates-This PowerPoint Diagram shows you the Chevron Diagram which consists of many Text Boxes to be covered in one Process. It is useful to explain components involved as well as the factors included in Process.-Can be used for presentations on accounts, advice, arrow, art, attorney, background, bank, becoming, benefits, bills, chart, chevron, clip, clipart, diagram, drop, durable, estate, finances, financial, graphic, having, illustration, incapacitated, infographic, lawsuits, legal, loans, personal, plan, power, property, protection, real, shadow, slide, taxes, transparency, vector-PPT describing multiple components using chevron diagram PowerPoint Templates

Comprehensive Influencer Promotional Guide To Improve Brand Reputation Comparative Analysis Of Successful Elements PDF
This slide shows the comparative analysis of various trending Instagram influencers on the basis of multiple parameters to help enterprise select the best influencer for promoting their brand. Take your projects to the next level with our ultimate collection of Comprehensive Influencer Promotional Guide To Improve Brand Reputation Comparative Analysis Of Successful Elements PDF. Slidegeeks has designed a range of layouts that are perfect for representing task or activity duration, keeping track of all your deadlines at a glance. Tailor these designs to your exact needs and give them a truly corporate look with your own brand colors they will make your projects stand out from the rest.

Technology Companies Market Cap Declining Graph Ppt PowerPoint Presentation File Smartart PDF
This slide shows the multiple companies capital that is invested by them in the market for making profits and advancing the technologies. It shows the decline of their capital amount in the following month. Pitch your topic with ease and precision using this Technology Companies Market Cap Declining Graph Ppt PowerPoint Presentation File Smartart PDF. This layout presents information on Overall Decline, Companies Low, Incurred Mor. It is also available for immediate download and adjustment. So, changes can be made in the color, design, graphics or any other component to create a unique layout.

Business Framework 10 Percent To 90 Percent PowerPoint Presentation
This business diagram has been designed with graphic of multiple pie graphs. This diagram slide contains the concept of result analysis with percentage values. Use this diagram to present and compare data in an impressive manner

BI Software Performance Evaluation Chart On Multiple Success Criteria BI Transformation Toolset Ideas PDF
The mentioned slide shows a checklist to measure the working of the business intelligence suite. The major characteristics of BI software covered are workflow functionality, speed, and cost. This is a BI Software Performance Evaluation Chart On Multiple Success Criteria BI Transformation Toolset Ideas PDF template with various stages. Focus and dispense information on one stages using this creative set, that comes with editable features. It contains large content boxes to add your information on topics like BI Software Performance Evaluation Chart On Multiple Success Criteria. You can also showcase facts, figures, and other relevant content using this PPT layout. Grab it now.
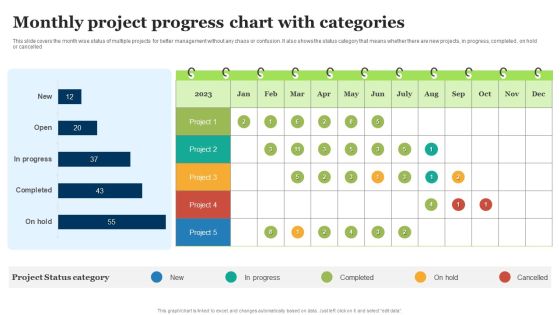
Monthly Project Progress Chart With Categories Ppt Professional Outfit PDF
This slide covers the month wise status of multiple projects for better management without any chaos or confusion. It also shows the status category that means whether there are new projects, in progress, completed , on hold or cancelled. Pitch your topic with ease and precision using this Monthly Project Progress Chart With Categories Ppt Professional Outfit PDF. This layout presents information on Project Status Category, Completed, Progress. It is also available for immediate download and adjustment. So, changes can be made in the color, design, graphics or any other component to create a unique layout.

Category Wise Operation Expenses Of The Company Topics PDF
This slide displays the division of operating expenses that a company is incurring in the three financial years 2020,2021 and 2022 to compare the different expense on multiple steps.Pitch your topic with ease and precision using this Category Wise Operation Expenses Of The Company Topics PDF. This layout presents information on Travelling Expenses, Increased Restrictions, Relaxation. It is also available for immediate download and adjustment. So, changes can be made in the color, design, graphics or any other component to create a unique layout.
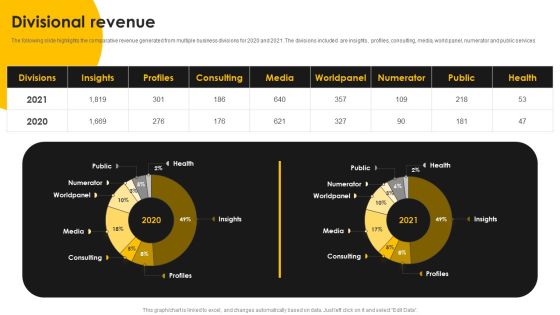
Kantar Consulting Company Outline Divisional Revenue Formats PDF
The following slide highlights the comparative revenue generated from multiple business divisions for 2020 and 2021. The divisions included are insights, profiles, consulting, media, world panel, numerator and public services. Presenting this PowerPoint presentation, titled Kantar Consulting Company Outline Divisional Revenue Formats PDF, with topics curated by our researchers after extensive research. This editable presentation is available for immediate download and provides attractive features when used. Download now and captivate your audience. Presenting this Kantar Consulting Company Outline Divisional Revenue Formats PDF. Our researchers have carefully researched and created these slides with all aspects taken into consideration. This is a completely customizable Kantar Consulting Company Outline Divisional Revenue Formats PDF that is available for immediate downloading. Download now and make an impact on your audience. Highlight the attractive features available with our PPTs.
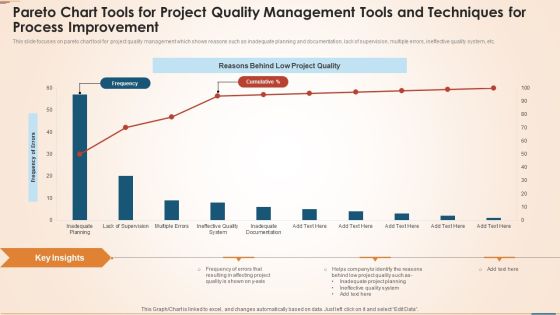
Pareto Chart Tools For Project Quality Management Tools And Techniques For Process Improvement Elements PDF
This slide focuses on pareto chart tool for project quality management which shows reasons such as inadequate planning and documentation, lack of supervision, multiple errors, ineffective quality system, etc. Pitch your topic with ease and precision using this pareto chart tools for project quality management tools and techniques for process improvement elements pdf. This layout presents information on frequency, reasons behind low project quality, frequency of errors, planning. It is also available for immediate download and adjustment. So, changes can be made in the color, design, graphics or any other component to create a unique layout.
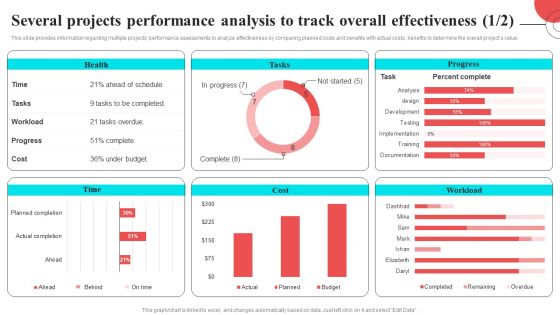
Several Projects Performance Analysis To Track Overall Effectiveness Introduction PDF
This slide provides information regarding multiple projects performance assessments to analyze effectiveness by comparing planned costs and benefits with actual costs, benefits to determine the overall projects value. Are you in need of a template that can accommodate all of your creative concepts This one is crafted professionally and can be altered to fit any style. Use it with Google Slides or PowerPoint. Include striking photographs, symbols, depictions, and other visuals. Fill, move around, or remove text boxes as desired. Test out color palettes and font mixtures. Edit and save your work, or work with colleagues. Download Several Projects Performance Analysis To Track Overall Effectiveness Introduction PDF and observe how to make your presentation outstanding. Give an impeccable presentation to your group and make your presentation unforgettable.
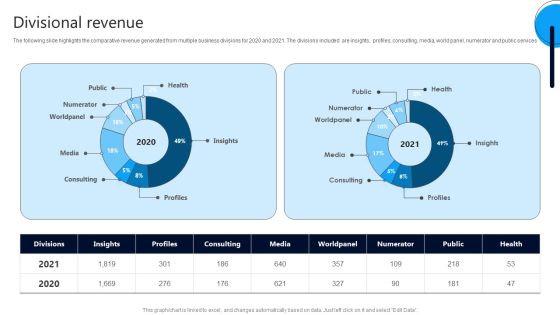
Market Research Evaluation Company Outline Divisional Revenue Themes PDF
The following slide highlights the comparative revenue generated from multiple business divisions for 2020 and 2021. The divisions included are insights, profiles, consulting, media, world panel, numerator and public services Get a simple yet stunning designed Market Research Evaluation Company Outline Divisional Revenue Themes PDF. It is the best one to establish the tone in your meetings. It is an excellent way to make your presentations highly effective. So, download this PPT today from Slidegeeks and see the positive impacts. Our easy to edit Market Research Evaluation Company Outline Divisional Revenue Themes PDF can be your go to option for all upcoming conferences and meetings. So, what are you waiting for Grab this template today.
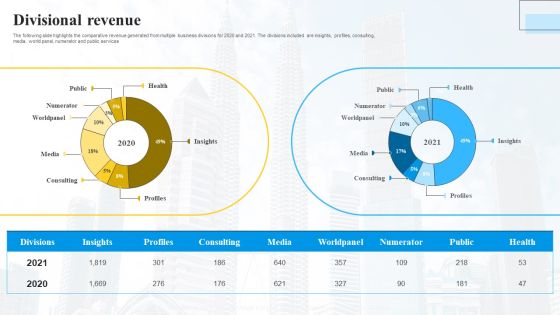
Marketing Insights Company Profile Divisional Revenue Demonstration PDF
The following slide highlights the comparative revenue generated from multiple business divisions for 2020 and 2021. The divisions included are insights, profiles, consulting, media, world panel, numerator and public services Retrieve professionally designed Marketing Insights Company Profile Divisional Revenue Demonstration PDF to effectively convey your message and captivate your listeners. Save time by selecting pre made slideshows that are appropriate for various topics, from business to educational purposes. These themes come in many different styles, from creative to corporate, and all of them are easily adjustable and can be edited quickly. Access them as PowerPoint templates or as Google Slides themes. You do not have to go on a hunt for the perfect presentation because Slidegeeks got you covered from everywhere.

Ppt Red Quadrant On Circular Free Pie PowerPoint Template Chart Ks2 Templates
PPT red quadrant on circular free pie powerpoint template chart ks2 Templates-Use this layout to define the outcome and the multiple possibilities in a way that is used in calculation of probabilities, genetics and strategic reasoning. This chart visualize the of process steps, reoccurrences and components or of your company structure or product features.-PPT red quadrant on circular free pie powerpoint template chart ks2 Templates-3 arrow, art, background, business, chart, circle, clip, colorful, design, diagram, flow, fourth, graph, graphic, half, icon, illustration, management, point, process, progress, project, round, segment, set, slide, stage, successful business, third, transparent

Integrating Parallel Processor System Single Instruction And Multiple Data Stream Simd Ideas PDF
This slide depicts the single instruction and multiple data stream types of parallel processing and how tasks are performed in this. It also covers components such as memory, control unit, processor unit, alignment network, and memory modules. Explore a selection of the finest Integrating Parallel Processor System Single Instruction And Multiple Data Stream Simd Ideas PDF here. With a plethora of professionally designed and pre-made slide templates, you can quickly and easily find the right one for your upcoming presentation. You can use our Integrating Parallel Processor System Single Instruction And Multiple Data Stream Simd Ideas PDF to effectively convey your message to a wider audience. Slidegeeks has done a lot of research before preparing these presentation templates. The content can be personalized and the slides are highly editable. Grab templates today from Slidegeeks.

Food Company Financial Performance Summary Sales Contribution From Vegan Proteins Products Topics PDF
The following slide highlights the comparative assessment of vegan protein and traditional sales for multiple products. The products included are packaged products, snacks, nutritional beverages, frozen meals, frozen snacks, and pizza. Create an editable Food Company Financial Performance Summary Sales Contribution From Vegan Proteins Products Topics PDF that communicates your idea and engages your audience. Whether you are presenting a business or an educational presentation, pre-designed presentation templates help save time. Food Company Financial Performance Summary Sales Contribution From Vegan Proteins Products Topics PDF is highly customizable and very easy to edit, covering many different styles from creative to business presentations. Slidegeeks has creative team members who have crafted amazing templates. So, go and get them without any delay.
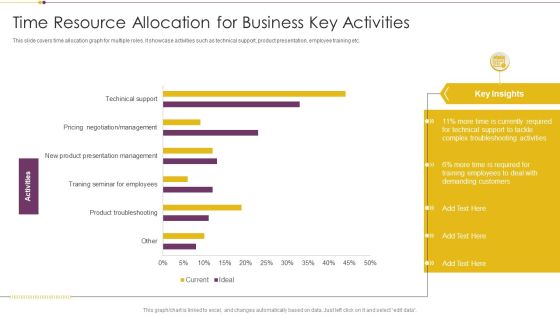
Time Resource Allocation For Business Key Activities Infographics PDF
This slide covers time allocation graph for multiple roles. It showcase activities such as technical support, product presentation, employee training etc. Pitch your topic with ease and precision using this Time Resource Allocation For Business Key Activities Infographics PDF. This layout presents information on Currently Required, Demanding Customers, Training Employees. It is also available for immediate download and adjustment. So, changes can be made in the color, design, graphics or any other component to create a unique layout.

Circle Graph Ppt PowerPoint Presentation Complete Deck With Slides
Boost your confidence and team morale with this well-structured Circle Graph Ppt PowerPoint Presentation Complete Deck With Slides. This prefabricated set gives a voice to your presentation because of its well-researched content and graphics. Our experts have added all the components very carefully, thus helping you deliver great presentations with a single click. Not only that, it contains a set of twelve slides that are designed using the right visuals, graphics, etc. Various topics can be discussed, and effective brainstorming sessions can be conducted using the wide variety of slides added in this complete deck. Apart from this, our PPT design contains clear instructions to help you restructure your presentations and create multiple variations. The color, format, design anything can be modified as deemed fit by the user. Not only this, it is available for immediate download. So, grab it now.

Customer Relationship Strategy For Building Loyalty Business Revenue Dashboard Icons PDF
This slide highlights business dashboard with multiple statistics to estimate the revenue and profitability of company as a result of new customer intimacy strategy. Deliver an awe inspiring pitch with this creative customer relationship strategy for building loyalty business revenue dashboard icons pdf bundle. Topics like average revenue per customer, compared to previous year, customer acquisition cost, cac vs customer lifetime value, revenue can be discussed with this completely editable template. It is available for immediate download depending on the needs and requirements of the user.

Tactical Procedure For Increasing Customer Intimacy Business Revenue Dashboard Diagrams PDF
This slide highlights business dashboard with multiple statistics to estimate the revenue and profitability of company as a result of new customer intimacy strategy. Deliver an awe inspiring pitch with this creative tactical procedure for increasing customer intimacy business revenue dashboard diagrams pdf bundle. Topics like average revenue per customer, compared to previous year, customer acquisition cost, cac vs customer lifetime value, revenue can be discussed with this completely editable template. It is available for immediate download depending on the needs and requirements of the user.

HR Recruitment Flow Chart Ppt PowerPoint Presentation Complete With Slides
This HR Recruitment Flow Chart Ppt PowerPoint Presentation Complete With Slides acts as backup support for your ideas, vision, thoughts, etc. Use it to present a thorough understanding of the topic. This PPT slideshow can be utilized for both in-house and outside presentations depending upon your needs and business demands. Entailing sixteen slides with a consistent design and theme, this template will make a solid use case. As it is intuitively designed, it suits every business vertical and industry. All you have to do is make a few tweaks in the content or any other component to design unique presentations. The biggest advantage of this complete deck is that it can be personalized multiple times once downloaded. The color, design, shapes, and other elements are free to modify to add personal touches. You can also insert your logo design in this PPT layout. Therefore a well-thought and crafted presentation can be delivered with ease and precision by downloading this HR Recruitment Flow Chart Ppt PowerPoint Presentation Complete With Slides PPT slideshow.

Data Center Cost Estimate With Server Cost Slides PDF
This slide represents the monthly cost associated with running multiple servers at data center. It helps in forecasting the budget for upcoming months also. Pitch your topic with ease and precision using this data center cost estimate with server cost slides pdf. This layout presents information on data center cost estimate with server cost. It is also available for immediate download and adjustment. So, changes can be made in the color, design, graphics or any other component to create a unique layout.
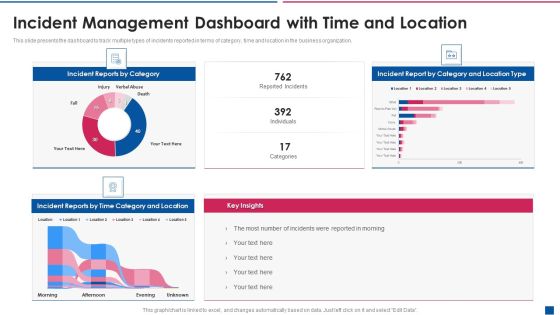
Incident Management Dashboard With Time And Location Sample PDF
This slide presents the dashboard to track multiple types of incidents reported in terms of category, time and location in the business organization. Pitch your topic with ease and precision using this incident management dashboard with time and location sample pdf. This layout presents information on incident management dashboard with time and location. It is also available for immediate download and adjustment. So, changes can be made in the color, design, graphics or any other component to create a unique layout.
Food Segments Contribution Towards Total Production And Global Export Icons PDF
This slide graphically provides information regarding the contribution of multiple food components such as meats, diary, grains and oil seeds, fruits and vegetables etc. towards total food production and global export. Deliver an awe inspiring pitch with this creative Food Segments Contribution Towards Total Production And Global Export Icons PDF bundle. Topics like Global Export, Total Production can be discussed with this completely editable template. It is available for immediate download depending on the needs and requirements of the user.

Financial Structure Approach Showing Debt And Equity Division Introduction PDF
This slide shows the division of capital of an organisation into multiple sources that are debt, preferred stock, equity capital and other sources . Pitch your topic with ease and precision using this Financial Structure Approach Showing Debt And Equity Division Introduction PDF. This layout presents information on Other Sources, Preferred Stock, Equity Capital, Debt. It is also available for immediate download and adjustment. So, changes can be made in the color, design, graphics or any other component to create a unique layout.

Manufacturing Plant Corporate Sustainability Dashboard Indicating Sourcing And Consumption Infographics PDF
The following slide showcases business sustainability dashboard highlighting multiple sources of technology. It provides information about renewable energy, plant age, solar, wind, biomass, regionality, etc.Pitch your topic with ease and precision using this Manufacturing Plant Corporate Sustainability Dashboard Indicating Sourcing And Consumption Infographics PDF. This layout presents information on Energy Consumption, Freshwater Consumption, Chemical Recovery. It is also available for immediate download and adjustment. So, changes can be made in the color, design, graphics or any other component to create a unique layout.

Project Prioritization Progress Scorecard With Assigned Employees Diagrams PDF
This slide covers report of multiple projects with assigned project manager. It also includes priority status, time frame, completion bar along with variances found. Pitch your topic with ease and precision using this Project Prioritization Progress Scorecard With Assigned Employees Diagrams PDF. This layout presents information on Project Prioritization, Progress Scorecard, Assigned Employees. It is also available for immediate download and adjustment. So, changes can be made in the color, design, graphics or any other component to create a unique layout.
Plan To Enhance Manufacturing Dashboard To Monitor Production Plant Shift Icons PDF
This slide represents the dashboard to monitor production plant efficiency for the multiple shifts. The multiple kpis covered in dashboard are availability, performance of manufacturing plant machines. It also provides information regarding the total downtime along with good parts yield. Presenting this PowerPoint presentation, titled Plan To Enhance Manufacturing Dashboard To Monitor Production Plant Shift Icons PDF, with topics curated by our researchers after extensive research. This editable presentation is available for immediate download and provides attractive features when used. Download now and captivate your audience. Presenting this Plan To Enhance Manufacturing Dashboard To Monitor Production Plant Shift Icons PDF. Our researchers have carefully researched and created these slides with all aspects taken into consideration. This is a completely customizable Plan To Enhance Manufacturing Dashboard To Monitor Production Plant Shift Icons PDF that is available for immediate downloading. Download now and make an impact on your audience. Highlight the attractive features available with our PPTs.
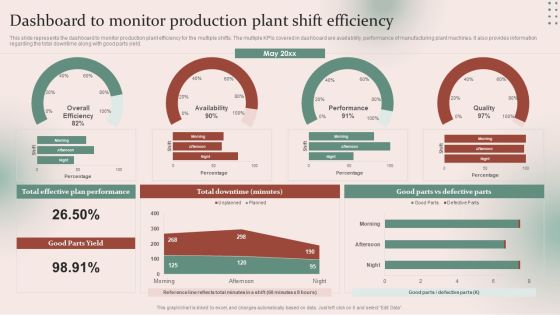
Strategies For Effective Manufacturing Dashboard To Monitor Production Plant Shift Professional PDF
This slide represents the dashboard to monitor production plant efficiency for the multiple shifts. The multiple kpis covered in dashboard are availability, performance of manufacturing plant machines. It also provides information regarding the total downtime along with good parts yield. Presenting this PowerPoint presentation, titled Strategies For Effective Manufacturing Dashboard To Monitor Production Plant Shift Professional PDF, with topics curated by our researchers after extensive research. This editable presentation is available for immediate download and provides attractive features when used. Download now and captivate your audience. Presenting this Strategies For Effective Manufacturing Dashboard To Monitor Production Plant Shift Professional PDF. Our researchers have carefully researched and created these slides with all aspects taken into consideration. This is a completely customizable Strategies For Effective Manufacturing Dashboard To Monitor Production Plant Shift Professional PDF that is available for immediate downloading. Download now and make an impact on your audience. Highlight the attractive features available with our PPTs.

Human Resource Graph Ppt PowerPoint Presentation Complete With Slides
This Human Resource Graph Ppt PowerPoint Presentation Complete With Slides acts as backup support for your ideas, vision, thoughts, etc. Use it to present a thorough understanding of the topic. This PPT slideshow can be utilized for both in-house and outside presentations depending upon your needs and business demands. Entailing tweleve slides with a consistent design and theme, this template will make a solid use case. As it is intuitively designed, it suits every business vertical and industry. All you have to do is make a few tweaks in the content or any other component to design unique presentations. The biggest advantage of this complete deck is that it can be personalized multiple times once downloaded. The color, design, shapes, and other elements are free to modify to add personal touches. You can also insert your logo design in this PPT layout. Therefore a well-thought and crafted presentation can be delivered with ease and precision by downloading this Human Resource Graph Ppt PowerPoint Presentation Complete With Slides PPT slideshow.

Trend Graph Ppt PowerPoint Presentation Complete Deck With Slides
This Trend Graph Ppt PowerPoint Presentation Complete Deck With Slides acts as backup support for your ideas, vision, thoughts, etc. Use it to present a thorough understanding of the topic. This PPT slideshow can be utilized for both in-house and outside presentations depending upon your needs and business demands. Entailing twelve slides with a consistent design and theme, this template will make a solid use case. As it is intuitively designed, it suits every business vertical and industry. All you have to do is make a few tweaks in the content or any other component to design unique presentations. The biggest advantage of this complete deck is that it can be personalized multiple times once downloaded. The color, design, shapes, and other elements are free to modify to add personal touches. You can also insert your logo design in this PPT layout. Therefore a well-thought and crafted presentation can be delivered with ease and precision by downloading this Trend Graph Ppt PowerPoint Presentation Complete Deck With Slides PPT slideshow.
Investment Annual Returns Performance Report Icons PDF
This slide presents a report highlighting performance of returns from investments in multiple funds to analyze and measure portfolio. It includes key components such as annual returns of funds, corporate bonds, equity, cash and market mood index and G-sec. Pitch your topic with ease and precision using this Investment Annual Returns Performance Report Icons PDF. This layout presents information on Cash, Quity, Corporate Bonds. It is also available for immediate download and adjustment. So, changes can be made in the color, design, graphics or any other component to create a unique layout.

Customer Service Request Tickets Administration Dashboard Icons PDF
This slide covers division of tickets into different groups. It also includes a pie chart dividing tickets in multiple categories such as status, tech groups, alert level, request type and alert condition. Pitch your topic with ease and precision using this Customer Service Request Tickets Administration Dashboard Icons PDF. This layout presents information on Tickets Activity, Tickets Alert Level, Tickets Teach Group. It is also available for immediate download and adjustment. So, changes can be made in the color, design, graphics or any other component to create a unique layout.
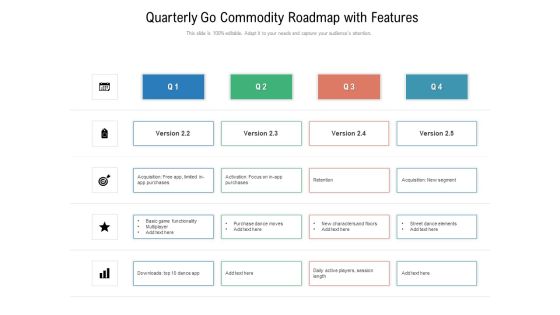
Quarterly Go Commodity Roadmap With Features Clipart
Presenting the quarterly go commodity roadmap with features clipart. The template includes a roadmap that can be used to initiate a strategic plan. Not only this, the PowerPoint slideshow is completely editable and you can effortlessly modify the font size, font type, and shapes according to your needs. This PPT slide can be easily reached in standard screen and widescreen aspect ratios. The set is also available in various formats like PDF, PNG, and JPG. So download and use it multiple times as per your knowledge.

Expenses Management Plan Spend Analysis Of Organization HR Department Background PDF
The following slide provides information regarding the multiple expenses of HR department such as recruitment, training and development, compensations and benefits. It also covers the details of budget allocated, used and balance of each expense. This Expenses Management Plan Spend Analysis Of Organization HR Department Background PDF is perfect for any presentation, be it in front of clients or colleagues. It is a versatile and stylish solution for organizing your meetings. The Expenses Management Plan Spend Analysis Of Organization HR Department Background PDF features a modern design for your presentation meetings. The adjustable and customizable slides provide unlimited possibilities for acing up your presentation. Slidegeeks has done all the homework before launching the product for you. So, dont wait, grab the presentation templates today.
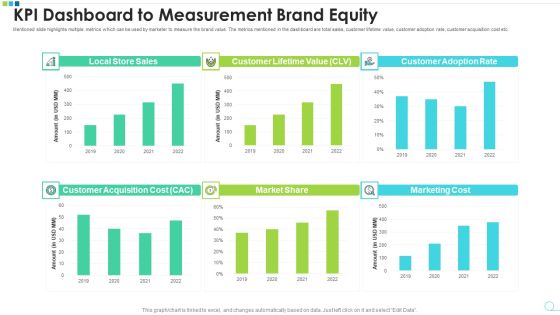
KPI Dashboard To Measurement Brand Equity Microsoft PDF
Mentioned slide highlights multiple metrics which can be used by marketer to measure the brand value. The metrics mentioned in the dashboard are total sales, customer lifetime value, customer adoption rate, customer acquisition cost etc. Pitch your topic with ease and precision using this kpi dashboard to measurement brand equity microsoft pdf. This layout presents information on kpi dashboard to measurement brand equity. It is also available for immediate download and adjustment. So, changes can be made in the color, design, graphics or any other component to create a unique layout.

Financial Forecast And Essential Metrics Dashboard Ppt File Show PDF
This slide elaborates about the multiple sources through which one can project about the growth and current status of the company. It includes lead conversion rate, monthly revenue , short term assets , net and gross profit margins, etc. Pitch your topic with ease and precision using this Financial Forecast And Essential Metrics Dashboard Ppt File Show PDF. This layout presents information on Monthly Revenue Growth, Short Term Assets, Overall Financial Performance, Net Profit Margin. It is also available for immediate download and adjustment. So, changes can be made in the color, design, graphics or any other component to create a unique layout.

 Home
Home