Comparison Chart

Quarterly Comparison Of Business Current And Target Milestones Themes PDF
This slide shows quarterly assessment of set and achieved target to find the reason for deviation between both. It comprises of targeted and achieved data of different quarters. Showcasing this set of slides titled Quarterly Comparison Of Business Current And Target Milestones Themes PDF. The topics addressed in these templates are Quarter Target, Target, Achieved. All the content presented in this PPT design is completely editable. Download it and make adjustments in color, background, font etc. as per your unique business setting.

Department Wise Comparison Of Workforce Performance Ppt Summary Portfolio PDF
This slide shows the quarterly performance of employees in different departments. . It includes marketing, Research and development and IT department. Showcasing this set of slides titled Department Wise Comparison Of Workforce Performance Ppt Summary Portfolio PDF. The topics addressed in these templates are Key Insights, Marketing Department, R And D Department. All the content presented in this PPT design is completely editable. Download it and make adjustments in color, background, font etc. as per your unique business setting.
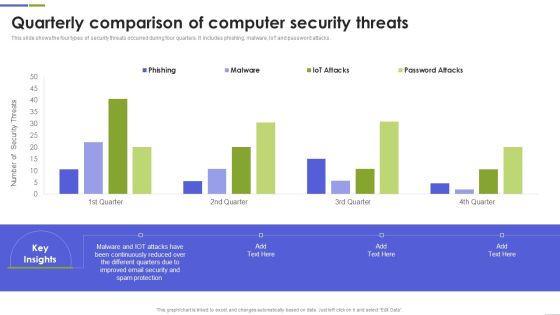
Quarterly Comparison Of Computer Security Threats Mockup PDF
This slide shows the four types of security threats occurred during four quarters. It includes phishing, malware, IoT and password attacks. Pitch your topic with ease and precision using this Quarterly Comparison Of Computer Security Threats Mockup PDF This layout presents information on Continuously Reduced, Different Quarters, Spam Protection It is also available for immediate download and adjustment. So, changes can be made in the color, design, graphics or any other component to create a unique layout.

CRM Software Dashboard For Sales Comparison Mockup PDF
This slide represents the sales dashboard of CRM software. It includes KPIs such as profit, number of sales and expenses incurred. Pitch your topic with ease and precision using this CRM Software Dashboard For Sales Comparison Mockup PDF. This layout presents information on Profit, Sales Dashboard, Expenses Incurred. It is also available for immediate download and adjustment. So, changes can be made in the color, design, graphics or any other component to create a unique layout.
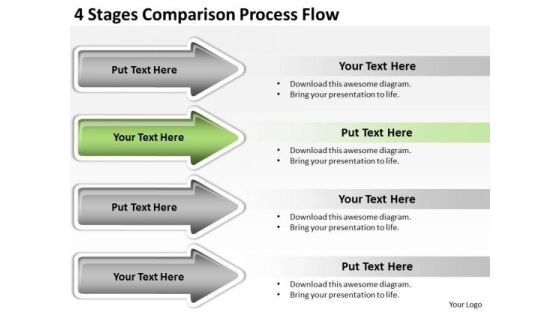
Advantages Of Parallel Processing 4 Stages Comparison Flow PowerPoint Templates
We present our advantages of parallel processing 4 stages comparison flow PowerPoint templates.Download and present our Arrows PowerPoint Templates because you can Add colour to your speech with our PowerPoint Templates and Slides. Your presentation will leave your audience speechless. Use our Business PowerPoint Templates because Our PowerPoint Templates and Slides will Embellish your thoughts. They will help you illustrate the brilliance of your ideas. Use our Steps PowerPoint Templates because Our PowerPoint Templates and Slides will help you be quick off the draw. Just enter your specific text and see your points hit home. Present our Process and Flows PowerPoint Templates because It will Strengthen your hand with your thoughts. They have all the aces you need to win the day. Download our Flow Charts PowerPoint Templates because Our PowerPoint Templates and Slides help you meet the demand of the Market. Just browse and pick the slides that appeal to your intuitive senses.Use these PowerPoint slides for presentations relating to Accounting, arrow, art, bar, blue, business, calculation, chart, collection,company, elements, diagram, directive, expense, finance, firm, forecast,future, gain, graph, grow, growth, icon, illustration, income, line, market, measure,objects, office, profit, progress, rate, set, statistic, stock, success, two, up, . The prominent colors used in the PowerPoint template are Green lime , White, Gray. The feedback we get is that our advantages of parallel processing 4 stages comparison flow PowerPoint templates are readymade to fit into any presentation structure. Professionals tell us our blue PowerPoint templates and PPT Slides will make you look like a winner. Use our advantages of parallel processing 4 stages comparison flow PowerPoint templates are the best it can get when it comes to presenting. Presenters tell us our bar PowerPoint templates and PPT Slides will impress their bosses and teams. You can be sure our advantages of parallel processing 4 stages comparison flow PowerPoint templates are effectively colour coded to prioritise your plans They automatically highlight the sequence of events you desire. PowerPoint presentation experts tell us our chart PowerPoint templates and PPT Slides will impress their bosses and teams.
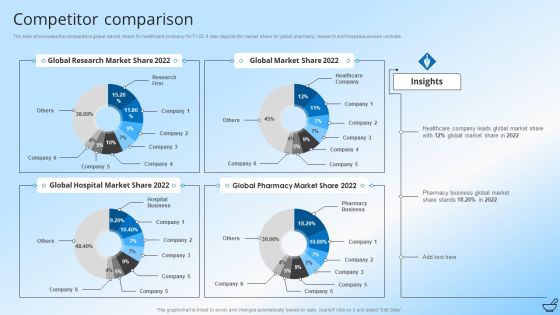
Pharmaceutical And Clinical Research Summary Competitor Comparison Inspiration PDF
The slide showcases the comparative global market share for healthcare company for FY22. It also depicts the market share for global pharmacy, research and hospital business verticals. Deliver and pitch your topic in the best possible manner with this Pharmaceutical And Clinical Research Summary Competitor Comparison Inspiration PDF. Use them to share invaluable insights on Global Research Market Share, Global Hospital Market Share, Global Pharmacy Market Share and impress your audience. This template can be altered and modified as per your expectations. So, grab it now.

Comparison Of HDI On Different Parameters Diagrams PDF
Following slides shows the summary of the human development index comparing many factors which will assist in comparing with rest of the world on income inequality parameters . It took the tenure from 2017 to 2022. Showcasing this set of slides titled Comparison Of HDI On Different Parameters Diagrams PDF. The topics addressed in these templates are Inequality Primary Components, Plus Loss Income Inequality, Different Parameters . All the content presented in this PPT design is completely editable. Download it and make adjustments in color, background, font etc. as per your unique business setting.

5 Stages Comparison Process Business Plan Maker PowerPoint Slides
We present our 5 stages comparison process business plan maker PowerPoint Slides .Download and present our Flow Charts PowerPoint Templates because Our PowerPoint Templates and Slides are conceived by a dedicated team. Use them and give form to your wondrous ideas. Download and present our Arrows PowerPoint Templates because Our PowerPoint Templates and Slides are created with admirable insight. Use them and give your group a sense of your logical mind. Use our Business PowerPoint Templates because You can Be the star of the show with our PowerPoint Templates and Slides. Rock the stage with your ideas. Present our Marketing PowerPoint Templates because Our PowerPoint Templates and Slides are created with admirable insight. Use them and give your group a sense of your logical mind. Download our Shapes PowerPoint Templates because Your success is our commitment. Our PowerPoint Templates and Slides will ensure you reach your goal.Use these PowerPoint slides for presentations relating to Ambition, arrows, business, chart, competition, data, finance, focus, goals, grey, growth, improvement, lead, leader, leadership, marketing, opportunity, sign, standing out, strategy, success, vision. The prominent colors used in the PowerPoint template are Blue, White, Gray. Customers tell us our 5 stages comparison process business plan maker PowerPoint Slides are visually appealing. Customers tell us our business PowerPoint templates and PPT Slides provide you with a vast range of viable options. Select the appropriate ones and just fill in your text. We assure you our 5 stages comparison process business plan maker PowerPoint Slides are designed by a team of presentation professionals. Customers tell us our goals PowerPoint templates and PPT Slides will impress their bosses and teams. Professionals tell us our 5 stages comparison process business plan maker PowerPoint Slides will make the presenter successul in his career/life. PowerPoint presentation experts tell us our finance PowerPoint templates and PPT Slides will make you look like a winner.
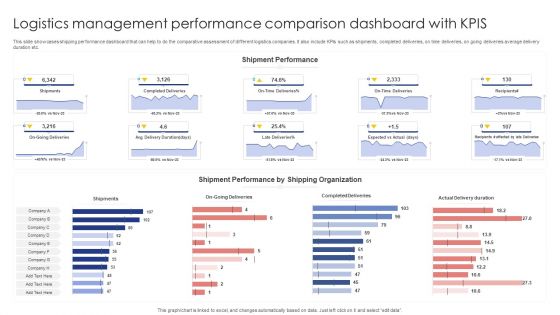
Logistics Management Performance Comparison Dashboard With Kpis Sample PDF
This slide showcases shipping performance dashboard that can help to do the comparative assessment of different logistics companies. It also include KPIs such as shipments, completed deliveries, on time deliveries, on going deliveries average delivery duration etc. Pitch your topic with ease and precision using this Logistics Management Performance Comparison Dashboard With Kpis Sample PDF. This layout presents information on Shipments, Completed Deliveries, Actual Delivery Duration. It is also available for immediate download and adjustment. So, changes can be made in the color, design, graphics or any other component to create a unique layout.
Monthly Comparison Dashboard For Lead Tracking Sample PDF
This slide showcases dashboard that can help organization to compare the leads converted in different months and make changes in sales and marketing campaigns . Its key components lead generated by country, by industry type and lead sources by month. Showcasing this set of slides titled Monthly Comparison Dashboard For Lead Tracking Sample PDF. The topics addressed in these templates are Leads Received, Industry Type, Lead Generated. All the content presented in this PPT design is completely editable. Download it and make adjustments in color, background, font etc. as per your unique business setting.

Marketing Channels Return On Investment ROI Comparison Infographics PDF
This slide covers the return of investment from various promotional channels such as social media, banner ads, SEO, paid marketing, affiliate marketing, and email marketing. The best PPT templates are a great way to save time, energy, and resources. Slidegeeks have 100 percent editable powerpoint slides making them incredibly versatile. With these quality presentation templates, you can create a captivating and memorable presentation by combining visually appealing slides and effectively communicating your message. Download Marketing Channels Return On Investment ROI Comparison Infographics PDF from Slidegeeks and deliver a wonderful presentation.

Quarterly Revenue And Loss Statement Comparison Dashboard Portrait PDF
This slide showcases a comprehensive P and L report for representing the financial outcomes. It also helps to take financial performance management decisions. It includes financial analysis KPIs such as p and l statements, p and l structure dynamics, sales or margin quality performance analysis, DUPONT ratio, etc. Showcasing this set of slides titled Quarterly Revenue And Loss Statement Comparison Dashboard Portrait PDF. The topics addressed in these templates are Profitability, Debt Coverage Ratios, Margin Quality Performa. All the content presented in this PPT design is completely editable. Download it and make adjustments in color, background, font etc. as per your unique business setting.

Annual Growth Comparison Of B2B Marketing Automation Microsoft PDF
The purpose of this slide is to show the statistical growth trend of marketing with the adoption of a process automation system along with the estimation of future revenue growth. Showcasing this set of slides titled Annual Growth Comparison Of B2B Marketing Automation Microsoft PDF. The topics addressed in these templates are Growing Technical, Automation Systems, Grew Gradually. All the content presented in this PPT design is completely editable. Download it and make adjustments in color, background, font etc. as per your unique business setting.

Annual Growth Comparison Of Online Health Industry Rules PDF
The purpose of this slide is to outline the healthcare online market revenue growth year over year influenced by expanding penetration among new consumer groups. Certain online tactics include digital advertising, online inquiry, online medicine delivery, etc. Showcasing this set of slides titled Annual Growth Comparison Of Online Health Industry Rules PDF. The topics addressed in these templates are Evolutionary Years, Online Health Insurance, Digital Advertising. All the content presented in this PPT design is completely editable. Download it and make adjustments in color, background, font etc. as per your unique business setting.

Social Media Global Usage Year Over Year Comparison Professional PDF
The purpose of this slide is to showcase the utilization of social media marketing worldwide with an upward trend influenced by technical advancements. The years include 2013 2023 along with the key insights. Showcasing this set of slides titled Social Media Global Usage Year Over Year Comparison Professional PDF. The topics addressed in these templates are Social Media, Technological Advancement, Technical Innovations. All the content presented in this PPT design is completely editable. Download it and make adjustments in color, background, font etc. as per your unique business setting.

Annual Growth Comparison Of Digital Advertising Market Summary PDF
The purpose of this slide is to highlight the yearly growth of digital marketing due rapid increase in the e commerce industry. The growth trend period includes 2019 2023 along with key insights. Pitch your topic with ease and precision using this Annual Growth Comparison Of Digital Advertising Market Summary PDF. This layout presents information on Digital Marketing, Internet Users, Career Among Youngsters. It is also available for immediate download and adjustment. So, changes can be made in the color, design, graphics or any other component to create a unique layout.

Big Data Global Market Revenue Annual Comparison Structure PDF
The purpose of this slide is to showcase a comprehensive overview of the international big data market evolution serving the most valuable contribution to revenue growth along with key insights. Pitch your topic with ease and precision using this Big Data Global Market Revenue Annual Comparison Structure PDF. This layout presents information on Market Revenues, Global Market, Growing Trend. It is also available for immediate download and adjustment. So, changes can be made in the color, design, graphics or any other component to create a unique layout.
Advertisement Cost Comparison Of Social Media Platforms Graphics PDF
This slide showcases comparative assessment of advertisement cost on different social media. It analyze social media advertising cost on the basis of key metrics that are average cost per click and cost per mile. Make sure to capture your audiences attention in your business displays with our gratis customizable Advertisement Cost Comparison Of Social Media Platforms Graphics PDF. These are great for business strategies, office conferences, capital raising or task suggestions. If you desire to acquire more customers for your tech business and ensure they stay satisfied, create your own sales presentation with these plain slides.

Marketing Channels Return On Investment ROI Comparison Microsoft PDF
This slide covers the return of investment from various promotional channels such as social media, banner ads, SEO, paid marketing, affiliate marketing, and email marketing. Do you know about Slidesgeeks Marketing Channels Return On Investment ROI Comparison Microsoft PDF These are perfect for delivering any kind od presentation. Using it, create PowerPoint presentations that communicate your ideas and engage audiences. Save time and effort by using our pre-designed presentation templates that are perfect for a wide range of topic. Our vast selection of designs covers a range of styles, from creative to business, and are all highly customizable and easy to edit. Download as a PowerPoint template or use them as Google Slides themes.

Comparison Of Data Migration Software Tools Microsoft PDF
This slide showcases the classification of data migration self-scripted, on-premise and cloud-based software tools.it compares tools on the basis or operation uses, benefits and drawbacks of respective tools Persuade your audience using this Comparison Of Data Migration Software Tools Microsoft PDF. This PPT design covers one stages, thus making it a great tool to use. It also caters to a variety of topics including Operational Use, Benefits, Drawback. Download this PPT design now to present a convincing pitch that not only emphasizes the topic but also showcases your presentation skills.

Comparison Business Ppt PowerPoint Presentation Outline Graphics Download
This is a comparison business ppt powerpoint presentation outline graphics download. This is a two stage process. The stages in this process are comparison, planning, marketing, finance, strategy.

Comparison Finance Ppt PowerPoint Presentation File Design Ideas
This is a comparison finance ppt powerpoint presentation file design ideas. This is a two stage process. The stages in this process are comparison, planning, marketing, finance, strategy.

Comparison Male Female Ppt PowerPoint Presentation Infographics Files
This is a comparison male female ppt powerpoint presentation infographics files. This is a two stage process. The stages in this process are comparison, male, female, marketing, management.

Comparison Male Female Ppt PowerPoint Presentation Show Influencers
This is a comparison male female ppt powerpoint presentation show influencers. This is a two stage process. The stages in this process are comparison, male, female, marketing, management.

Comparison Male And Female Ppt PowerPoint Presentation Slides Designs
This is a comparison male and female ppt powerpoint presentation slides designs. This is a two stage process. The stages in this process are marketing, management, comparison, product.

Information Systems Security And Risk Management Plan Comparison Rules PDF
This graph chart is linked to excel, and changes automatically based on data. Just left click on it and select Edit Data. Find highly impressive Information Systems Security And Risk Management Plan Comparison Rules PDF on Slidegeeks to deliver a meaningful presentation. You can save an ample amount of time using these presentation templates. No need to worry to prepare everything from scratch because Slidegeeks experts have already done a huge research and work for you. You need to download Information Systems Security And Risk Management Plan Comparison Rules PDF for your upcoming presentation. All the presentation templates are 100 percent editable and you can change the color and personalize the content accordingly. Download now.

Comparison Male And Female Ppt PowerPoint Presentation Styles Infographic Template
This is a comparison male and female ppt powerpoint presentation styles infographic template. This is a two stage process. The stages in this process are business, management, marketing, comparison.

Comparison Slide Male Female Marketing Ppt PowerPoint Presentation File Slideshow
This is a comparison slide male female marketing ppt powerpoint presentation file slideshow. This is a three stage process. The stages in this process are finance, marketing, management, comparison.

Comparison Male Female Marketing Ppt PowerPoint Presentation Outline Structure
This is a comparison male female marketing ppt powerpoint presentation outline structure. This is a two stage process. The stages in this process are comparison, male, female, marketing, strategy.

Attrition Rate Comparison By Top IT Companies Professional PDF
This slide shows the comparison between the top IT Companies with their employee attrition rate with key intakes.Deliver and pitch your topic in the best possible manner with this attrition rate comparison by top it companies professional pdf. Use them to share invaluable insights on capture your audiences attention, comparison of employee, attrition rate and impress your audience. This template can be altered and modified as per your expectations. So, grab it now.

Competitor Comparison Template 2 Ppt PowerPoint Presentation Show Design Ideas
This is a competitor comparison template 2 ppt powerpoint presentation show design ideas. This is a four stage process. The stages in this process are competitor, profit, revenue.

Comparison Marketing Ppt PowerPoint Presentation Gallery Graphic Tips
This is a comparison marketing ppt powerpoint presentation gallery graphic tips. This is a three stage process. The stages in this process are finance, analysis, business, investment, marketing.

Comparison Male And Female Ppt PowerPoint Presentation File Styles
This is a comparison male and female ppt powerpoint presentation file styles. This is a two stage process. The stages in this process are business, marketing, management, compression.

Comparison Minimum Ppt PowerPoint Presentation File Visual Aids
This is a comparison minimum ppt powerpoint presentation file visual aids. This is a three stage process. The stages in this process are financial, maximum, medium, minimum, marketing.
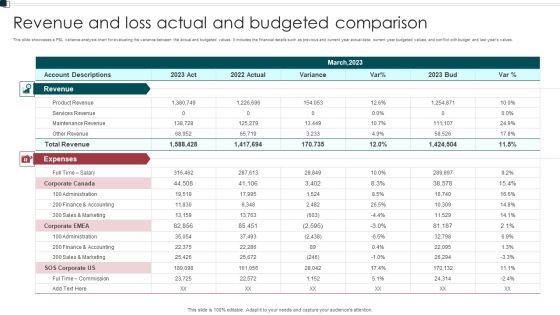
Revenue And Loss Actual And Budgeted Comparison Elements PDF
This slide showcases a P and L variance analysis chart for evaluating the variance between the actual and budgeted values. It includes the financial details such as previous and current year actual data current year budgeted values, and conflict with budget and last years values. Showcasing this set of slides titled Revenue And Loss Actual And Budgeted Comparison Elements PDF. The topics addressed in these templates are Expenses, Administration, Commission. All the content presented in this PPT design is completely editable. Download it and make adjustments in color, background, font etc. as per your unique business setting.

Comparison Of Prices Ppt PowerPoint Presentation Designs Download
This is a comparison of prices ppt powerpoint presentation designs download. This is a two stage process. The stages in this process are comparison of prices, marketing, in percentage, bar graph, business.

Competitor Comparison Template 1 Ppt PowerPoint Presentation Infographic Template Mockup
This is a competitor comparison template 1 ppt powerpoint presentation infographic template mockup. This is a five stage process. The stages in this process are business, marketing, graph, finance, strategy.

Competitor Comparison Template 2 Ppt PowerPoint Presentation Infographics Objects
This is a competitor comparison template 2 ppt powerpoint presentation infographics objects. This is a five stage process. The stages in this process are business, marketing, graph, finance, strategy.

Competitor Comparison Template 1 Ppt PowerPoint Presentation Layouts Slide Portrait
This is a competitor comparison template 1 ppt powerpoint presentation layouts slide portrait. This is a four stage process. The stages in this process are business, marketing, graph, finance, strategy.

Competitor Comparison Template 2 Ppt PowerPoint Presentation Inspiration Images
This is a competitor comparison template 2 ppt powerpoint presentation inspiration images. This is a five stage process. The stages in this process are business, marketing, graph, finance, strategy.

Comparison Male And Female Ppt PowerPoint Presentation Infographic Template Layouts
This is a comparison male and female ppt powerpoint presentation infographic template layouts. This is a five stage process. The stages in this process are business, management, marketing, compare.

Comparison Marketing Strategy Ppt PowerPoint Presentation Infographic Template Example 2015
This is a comparison marketing strategy ppt powerpoint presentation infographic template example 2015. This is a two stage process. The stages in this process are finance, marketing, management, investment, analysis.

Budgeting Planned Actual Comparison Ppt PowerPoint Presentation Portfolio Background
This is a budgeting planned actual comparison ppt powerpoint presentation portfolio background. This is a three stage process. The stages in this process are planned cost, actual cost, value difference, deviation, bar graph.

Budgeting Planned Actual Comparison Ppt PowerPoint Presentation Icon Shapes
This is a budgeting planned actual comparison ppt powerpoint presentation icon shapes. This is a two stage process. The stages in this process are finance, marketing, management, investment, product, percentage.

Budgeting Planned Actual Comparison Ppt PowerPoint Presentation Infographics Samples
This is a budgeting planned actual comparison ppt powerpoint presentation infographics samples. This is a two stage process. The stages in this process are deviation, planned cost, actual cost, value difference, planning.

Budgeting Planned Actual Comparison Ppt PowerPoint Presentation Gallery Graphic Tips
This is a budgeting planned actual comparison ppt powerpoint presentation gallery graphic tips. This is a three stage process. The stages in this process are planned cost, actual cost, value difference.

Budgeting Planned Actual Comparison Ppt PowerPoint Presentation Portfolio Information
This is a budgeting planned actual comparison ppt powerpoint presentation portfolio information. This is a three stage process. The stages in this process are planned cost, actual cost, deviation.

Budgeting Planned Actual Comparison Ppt PowerPoint Presentation Portfolio Display
This is a budgeting planned actual comparison ppt powerpoint presentation portfolio display. This is a three stage process. The stages in this process are type of cost, planned cost, actual cost, deviation, value difference.

Budgeting Planned Actual Comparison Ppt PowerPoint Presentation Show Background Image
This is a budgeting planned actual comparison ppt powerpoint presentation show background image. This is a three stage process. The stages in this process are planned cost, actual cost, value difference, deviation.

Budgeting Planned Actual Comparison Ppt PowerPoint Presentation Visual Aids Gallery
This is a budgeting planned actual comparison ppt powerpoint presentation visual aids gallery. This is a three stage process. The stages in this process are business, management, marketing, percentage, product.

Budgeting Planned Actual Comparison Ppt PowerPoint Presentation Portfolio Ideas
This is a budgeting planned actual comparison ppt powerpoint presentation portfolio ideas. This is a two stage process. The stages in this process are finance, analysis, business, investment, marketing.

Budgeting Planned Actual Comparison Ppt PowerPoint Presentation Styles File Formats
This is a budgeting planned actual comparison ppt powerpoint presentation styles file formats. This is a three stage process. The stages in this process are product, percentage, business, management, marketing.

Budgeting Planned Actual Comparison Ppt PowerPoint Presentation Inspiration Gallery
This is a budgeting planned actual comparison ppt powerpoint presentation inspiration gallery. This is a two stage process. The stages in this process are finance, analysis, business, investment, marketing.

Budgeting Planned Actual Comparison Ppt PowerPoint Presentation Inspiration Outline
This is a budgeting planned actual comparison ppt powerpoint presentation inspiration outline. This is a two stage process. The stages in this process are finance, analysis, business, investment, marketing.

Comparison Male And Female Ppt PowerPoint Presentation Professional Skills
This is a comparison male and female ppt powerpoint presentation professional skills. This is a two stage process. The stages in this process are product, percentage, business, management, marketing.

Comparison Male Female Marketing Ppt PowerPoint Presentation Outline Graphics Example
This is a comparison male female marketing ppt powerpoint presentation outline graphics example. This is a two stage process. The stages in this process are business, management, marketing, compare.

Budgeting Planned Actual Comparison Ppt PowerPoint Presentation Portfolio
This is a budgeting planned actual comparison ppt powerpoint presentation portfolio. This is a three stage process. The stages in this process are business, strategy, marketing, analysis, success, bar graph.
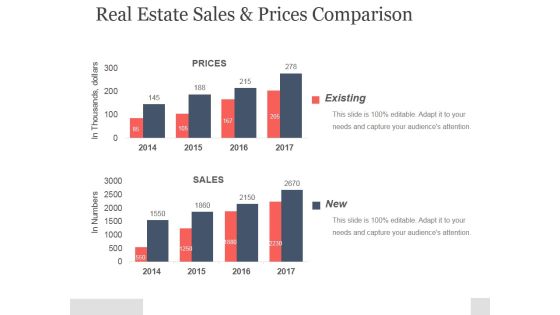
Real Estate Sales And Prices Comparison Ppt PowerPoint Presentation Example
This is a real estate sales and prices comparison ppt powerpoint presentation example. This is a two stage process. The stages in this process are existing, prices, sales, in thousands, dollars.
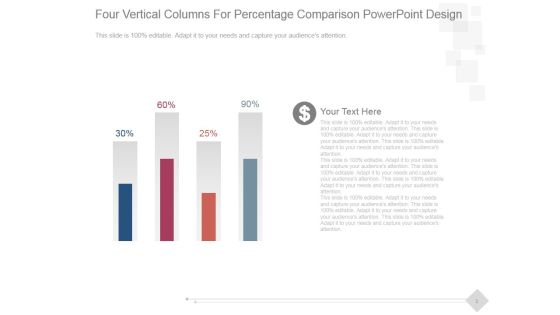
Four Vertical Columns For Percentage Comparison Ppt PowerPoint Presentation Introduction
This is a four vertical columns for percentage comparison ppt powerpoint presentation introduction. This is a four stage process. The stages in this process are business, marketing, success, management, presentation.
Pay For Performance Comparison Table Ppt PowerPoint Presentation Icon Background
This is a pay for performance comparison table ppt powerpoint presentation icon background. This is a three stage process. The stages in this process are pay for performance comparison table, pay for performance comparison table.

 Home
Home