Comparison Chart

Dashboard For Tracking Progress Of Media Relations Management Strategies Slides PDF
This slide provides dashboard showcasing impact of media relations plan which helps track campaign performance. It provides information regarding consumer engagement, bounce rate, lead generation, conversion rates and top channels used. Pitch your topic with ease and precision using this Dashboard For Tracking Progress Of Media Relations Management Strategies Slides PDF. This layout presents information on Dashboard For Tracking, Progress Of Media, Relations Management Strategies. It is also available for immediate download and adjustment. So, changes can be made in the color, design, graphics or any other component to create a unique layout.
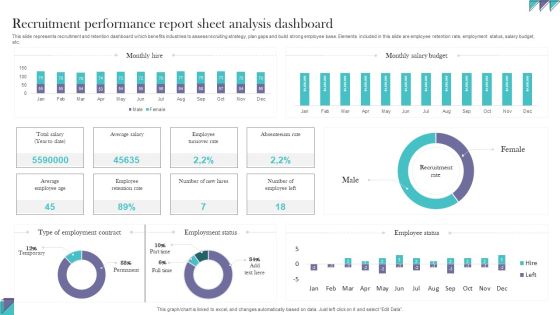
Recruitment Performance Report Sheet Analysis Dashboard Information PDF
This slide represents recruitment and retention dashboard which benefits industries to assess recruiting strategy, plan gaps and build strong employee base. Elements included in this slide are employee retention rate, employment status, salary budget, etc. Pitch your topic with ease and precision using this Recruitment Performance Report Sheet Analysis Dashboard Information PDF. This layout presents information onRecruitment Performance, Report Sheet Analysis. It is also available for immediate download and adjustment. So, changes can be made in the color, design, graphics or any other component to create a unique layout.
Tracking School Communication Strategy Performance Rules PDF
The following slide highlights tracking performance of school communication plan. It includes parameters such as parents satisfaction with guidance and resources provided by schools, parents want teachers to reduce frequency of contacting them, parents want teachers to communicate more often etc. Pitch your topic with ease and precision using this Tracking School Communication Strategy Performance Rules PDF. This layout presents information on Strongly Agree, Agree, Improved Methods. It is also available for immediate download and adjustment. So, changes can be made in the color, design, graphics or any other component to create a unique layout.

Quarterly Cost Variance Analysis With Maintenance Metrics Dashboard Information PDF
The following slide depicts a maintenance KPI dashboard to have useful insights for effective decision making. It includes key performance areas such as quarterly cost variance, scrap, quarterly run time variance analysis etc. Pitch your topic with ease and precision using this Quarterly Cost Variance Analysis With Maintenance Metrics Dashboard Information PDF. This layout presents information on Production, Budgeted Cost, Planned Run Time, Actual Run Time. It is also available for immediate download and adjustment. So, changes can be made in the color, design, graphics or any other component to create a unique layout.
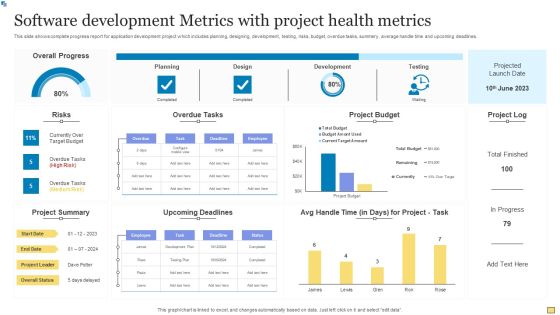
Software Development Metrics With Project Health Metrics Graphics PDF
This slide shows complete progress report for application development project which includes planning, designing, development, testing, risks, budget, overdue tasks, summery, average handle time and upcoming deadlines. Pitch your topic with ease and precision using this Software Development Metrics With Project Health Metrics Graphics PDF. This layout presents information on Overall Progress, Overdue Tasks, Project Budget. It is also available for immediate download and adjustment. So, changes can be made in the color, design, graphics or any other component to create a unique layout.

Hotel Property Administration Software Dashboard Guidelines PDF
This slide showcases HPMS dashboard. The purpose of this dashboard is to access plan and performance. It includes key elements such as current in house, expected arrivals, expected departures, current status and room status. Pitch your topic with ease and precision using this Hotel Property Administration Software Dashboard Guidelines PDF. This layout presents information on Current Status, Room Status, Exchange Rates. It is also available for immediate download and adjustment. So, changes can be made in the color, design, graphics or any other component to create a unique layout.

Continuous Process Improvement KPI Dashboard For IT Industry Clipart PDF
Following slide depicts the IT industry KPI dashboard which will assist in generating more of profit by improving strategic plan according to changing environment with clients preferences .The KPI mentioned in a slide are such as risk analysis, outstanding task , upcoming task, budget analysis, etc. Pitch your topic with ease and precision using this Continuous Process Improvement KPI Dashboard For IT Industry Clipart PDF. This layout presents information on Overall Progress, Risk Analysis, Budget Analysis. It is also available for immediate download and adjustment. So, changes can be made in the color, design, graphics or any other component to create a unique layout.

Lean Operational Excellence Strategy Dashboard To Track And Monitor Project Performance Slides PDF
This slide showcases dashboard which tracks project stages and monitors budget spends and other KPIs. Key project stages included here are overdue tasks, upcoming deadlines, project completion stage, workload factors, etc. Pitch your topic with ease and precision using this Lean Operational Excellence Strategy Dashboard To Track And Monitor Project Performance Slides PDF. This layout presents information on Planning, Design, Development. It is also available for immediate download and adjustment. So, changes can be made in the color, design, graphics or any other component to create a unique layout.

Lean Operational Excellence Strategy Manufacturing Dashboard To Check Production System Efficiency Pictures PDF
This slide showcases manufacturing dashboard to track KPIs defined under lean and kaizen process improvement plans. Key performance metrics included here are TEEP, OEE, loading time, production quality, losses by hours, losses by categories etc. Pitch your topic with ease and precision using this Lean Operational Excellence Strategy Manufacturing Dashboard To Check Production System Efficiency Pictures PDF. This layout presents information on Loading, Availability, Performance. It is also available for immediate download and adjustment. So, changes can be made in the color, design, graphics or any other component to create a unique layout.

Market Competitor Cost Analysis Dashboard Graphics PDF
The slide showcases a dashboard for analyzing own and competitors product pricing strategies to formulate effective valuation plan. It includes key elements such as low priced, equally priced, high priced, overpriced products, competitors current price, etc. Pitch your topic with ease and precision using this Market Competitor Cost Analysis Dashboard Graphics PDF. This layout presents information on Average, Product Model, Cost Analysis Dashboard. It is also available for immediate download and adjustment. So, changes can be made in the color, design, graphics or any other component to create a unique layout.

Budget Strategy For Annual Campaign Marketing Guidelines PDF
This slide exhibits budget plan to analyze expense incurred every month for the whole year . It includes campaigns such as brand promotion, Facebook participation, event invites, business culture etc. Pitch your topic with ease and precision using this Budget Strategy For Annual Campaign Marketing Guidelines PDF. This layout presents information on Budget Expense, Key Insights, Marketing. It is also available for immediate download and adjustment. So, changes can be made in the color, design, graphics or any other component to create a unique layout.

KPI Dashboard For Software Product Promotion Strategy With Various Tools Portrait PDF
Following slide depicts the KPI dashboard with numerous tools for software product marketing plan In order to locate prospects and close sales, agile lead generation and marketing techniques are needed. Pitch your topic with ease and precision using this KPI Dashboard For Software Product Promotion Strategy With Various Tools Portrait PDF. This layout presents information on KPI Dashboard, Software Product Promotion, Strategy With Various Tools. It is also available for immediate download and adjustment. So, changes can be made in the color, design, graphics or any other component to create a unique layout.

Monitor Project Budget Cost And Expense Dashboard Brochure PDF
Following slides shows mmonitoring project costs and expenses in the dashboard which will assist in planning and maintain budgeted according to requirement. It includes KPI such as task status, cost incurred ,workload , etc. Pitch your topic with ease and precision using this Monitor Project Budget Cost And Expense Dashboard Brochure PDF. This layout presents information on Expense Dashboard, Monitor Project Budget Cost. It is also available for immediate download and adjustment. So, changes can be made in the color, design, graphics or any other component to create a unique layout.
Employee Training Status KPI Dashboard With Budget Summary PDF
This slide consists of a dashboard to track employee annual training status in order to update the plan for next year. It includes elements such as training number, total hours, budget, trainee numbers, training types, etc. Pitch your topic with ease and precision using this Employee Training Status KPI Dashboard With Budget Summary PDF. This layout presents information on Employee Training Status, KPI Dashboard With Budget. It is also available for immediate download and adjustment. So, changes can be made in the color, design, graphics or any other component to create a unique layout.

Product Marketing Plan To Enhance Organizational Growth Strategy 1 Manage And Optimize Teams And Budgets Ideas PDF
This slide shows the challenge and various strategic initiatives taken by the company under the Manage and Optimize Teams and Budgets strategy. Are you searching for a Product Marketing Plan To Enhance Organizational Growth Strategy 1 Manage And Optimize Teams And Budgets Ideas PDF that is uncluttered, straightforward, and original Its easy to edit, and you can change the colors to suit your personal or business branding. For a presentation that expresses how much effort you ve put in, this template is ideal With all of its features, including tables, diagrams, statistics, and lists, its perfect for a business plan presentation. Make your ideas more appealing with these professional slides. Download Product Marketing Plan To Enhance Organizational Growth Strategy 1 Manage And Optimize Teams And Budgets Ideas PDF from Slidegeeks today.
Global Automotive Industry Analysis Global Automotive Production Industry Revenue Icons PDF
This slide covers a graphical representation of worldwide automobile manufacturing industry revenue. It also includes key insights into disruptions of global manufacturing, supply chain, consumer spending, etc. This Global Automotive Industry Analysis Global Automotive Production Industry Revenue Icons PDF is perfect for any presentation, be it in front of clients or colleagues. It is a versatile and stylish solution for organizing your meetings. The product features a modern design for your presentation meetings. The adjustable and customizable slides provide unlimited possibilities for acing up your presentation. Slidegeeks has done all the homework before launching the product for you. So, do not wait, grab the presentation templates today.
Strategic Corporate Planning To Attain Corporate Financial Performance Tracking Dashboard Icons PDF
This slide provides information regarding dashboard utilized by firm to monitor financial performance. The performance is tracked through revenues generated, vendors associated, profit generated, etc. This Strategic Corporate Planning To Attain Corporate Financial Performance Tracking Dashboard Icons PDF is perfect for any presentation, be it in front of clients or colleagues. It is a versatile and stylish solution for organizing your meetings. The Strategic Corporate Planning To Attain Corporate Financial Performance Tracking Dashboard Icons PDF features a modern design for your presentation meetings. The adjustable and customizable slides provide unlimited possibilities for acing up your presentation. Slidegeeks has done all the homework before launching the product for you. So, do not wait, grab the presentation templates today
Planning Sales Campaign To Improve Key Sales Challenges Faced By Organization Icons PDF
This slide provides glimpse about multiple sales challenges faced by the organization regarding current and past sales performance. It includes sales revenue, sales volume, rising unsold inventory, etc. This Planning Sales Campaign To Improve Key Sales Challenges Faced By Organization Icons PDF is perfect for any presentation, be it in front of clients or colleagues. It is a versatile and stylish solution for organizing your meetings. The Planning Sales Campaign To Improve Key Sales Challenges Faced By Organization Icons PDF features a modern design for your presentation meetings. The adjustable and customizable slides provide unlimited possibilities for acing up your presentation. Slidegeeks has done all the homework before launching the product for you. So, dont wait, grab the presentation templates today.

Dashboard To Track Several Projects Performance By Firm Themes PDF
This slide provides information regarding the dashboard which will help team in tracking different activities associated to multiple projects by monitoring resources, tasks status, bugs and features closed, etc. Find highly impressive Dashboard To Track Several Projects Performance By Firm Themes PDF on Slidegeeks to deliver a meaningful presentation. You can save an ample amount of time using these presentation templates. No need to worry to prepare everything from scratch because Slidegeeks experts have already done a huge research and work for you. You need to download Dashboard To Track Several Projects Performance By Firm Themes PDF for your upcoming presentation. All the presentation templates are 100 percent editable and you can change the color and personalize the content accordingly. Download now

Business To Business Social Dashboard To Track Social Media Marketing Campaign Metrics Microsoft PDF
This slide showcases dashboard that can help organization to track the metrics of social media marketing campaign. Its key components are followers, post reach, page impressions, visitors, avg engagement and lifetime views. Here you can discover an assortment of the finest PowerPoint and Google Slides templates. With these templates, you can create presentations for a variety of purposes while simultaneously providing your audience with an eye-catching visual experience. Download Business To Business Social Dashboard To Track Social Media Marketing Campaign Metrics Microsoft PDF to deliver an impeccable presentation. These templates will make your job of preparing presentations much quicker, yet still, maintain a high level of quality. Slidegeeks has experienced researchers who prepare these templates and write high-quality content for you. Later on, you can personalize the content by editing the Business To Business Social Dashboard To Track Social Media Marketing Campaign Metrics Microsoft PDF.

Dashboard For Tracking Brand Awareness Advertisement Campaign Results Download PDF
This slide showcases dashboard that can help organization to track results of online advertisement campaigns. Its key components ad impressions, click through rate, cost per conversion, revenue per click, impressions, new users and sessions. Here you can discover an assortment of the finest PowerPoint and Google Slides templates. With these templates, you can create presentations for a variety of purposes while simultaneously providing your audience with an eye catching visual experience. Download Dashboard For Tracking Brand Awareness Advertisement Campaign Results Download PDF to deliver an impeccable presentation. These templates will make your job of preparing presentations much quicker, yet still, maintain a high level of quality. Slidegeeks has experienced researchers who prepare these templates and write high quality content for you. Later on, you can personalize the content by editing the Dashboard For Tracking Brand Awareness Advertisement Campaign Results Download PDF.

Dashboard To Identify Open Positions And Offer Acceptance Ratio Slides PDF
This slide showcases dashboard that can help organization to identify open positions in organization after conducting recruitment and offer acceptance ratio of candidates. It also showcases various other components which are shortlisted candidates, hired candidates, time to hire, cost to hire, applications details. Boost your pitch with our creative Dashboard To Identify Open Positions And Offer Acceptance Ratio Slides PDF. Deliver an awe inspiring pitch that will mesmerize everyone. Using these presentation templates you will surely catch everyones attention. You can browse the ppts collection on our website. We have researchers who are experts at creating the right content for the templates. So you do not have to invest time in any additional work. Just grab the template now and use them.

Confidential Computing System Technology Confidential Computing Performance Tracking Microsoft PDF
This slide represents the performance tracking dashboard for confidential computing. The purpose of this slide is to represent the overall performance of the confidential computing cloud environment visually. The main components include overall health, operations, progress, time, cost and workloads. Explore a selection of the finest Confidential Computing System Technology Confidential Computing Performance Tracking Microsoft PDF here. With a plethora of professionally designed and pre-made slide templates, you can quickly and easily find the right one for your upcoming presentation. You can use our Confidential Computing System Technology Confidential Computing Performance Tracking Microsoft PDF to effectively convey your message to a wider audience. Slidegeeks has done a lot of research before preparing these presentation templates. The content can be personalized and the slides are highly editable. Grab templates today from Slidegeeks.
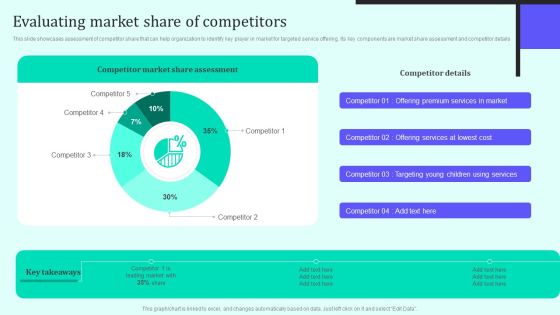
Implementing New Sales And Marketing Process For Services Evaluating Market Share Of Competitors Information PDF
This slide showcases assessment of competitor share that can help organization to identify key player in market for targeted service offering. Its key components are market share assessment and competitor details. Slidegeeks is one of the best resources for PowerPoint templates. You can download easily and regulate Implementing New Sales And Marketing Process For Services Evaluating Market Share Of Competitors Information PDF for your personal presentations from our wonderful collection. A few clicks is all it takes to discover and get the most relevant and appropriate templates. Use our Templates to add a unique zing and appeal to your presentation and meetings. All the slides are easy to edit and you can use them even for advertisement purposes.
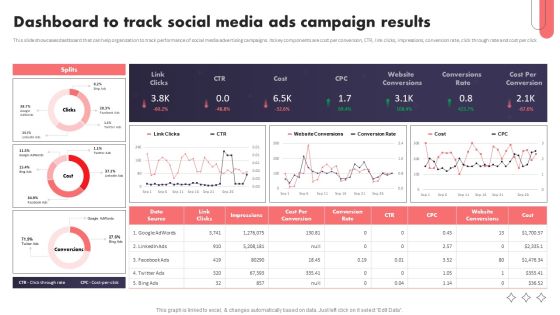
Social Media Promotional Technique Dashboard To Track Social Media Ads Campaign Structure PDF
This slide showcases dashboard that can help organization to track performance of social media advertising campaigns. Its key components are cost per conversion, CTR, link clicks, impressions, conversion rate, click through rate and cost per click. Slidegeeks is one of the best resources for PowerPoint templates. You can download easily and regulate Social Media Promotional Technique Dashboard To Track Social Media Ads Campaign Structure PDF for your personal presentations from our wonderful collection. A few clicks is all it takes to discover and get the most relevant and appropriate templates. Use our Templates to add a unique zing and appeal to your presentation and meetings. All the slides are easy to edit and you can use them even for advertisement purposes.
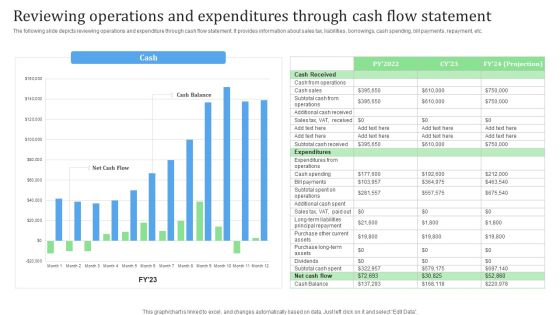
Reviewing Operations And Expenditures Through Cash Flow Statement Financial Management Strategies Themes PDF
The following slide depicts reviewing operations and expenditure through cash flow statement. It provides information about sales tax, liabilities, borrowings, cash spending, bill payments, repayment, etc.This Reviewing Operations And Expenditures Through Cash Flow Statement Financial Management Strategies Themes PDF from Slidegeeks makes it easy to present information on your topic with precision. It provides customization options, so you can make changes to the colors, design, graphics, or any other component to create a unique layout. It is also available for immediate download, so you can begin using it right away. Slidegeeks has done good research to ensure that you have everything you need to make your presentation stand out. Make a name out there for a brilliant performance.
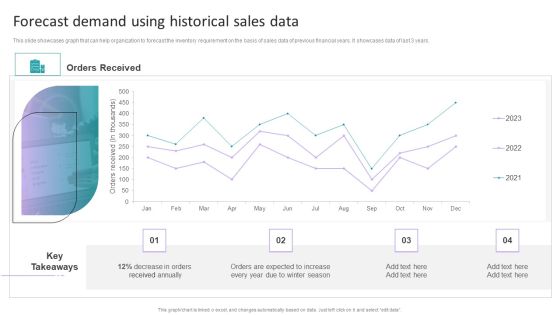
Stock Inventory Acquisition Forecast Demand Using Historical Sales Data Themes PDF
This slide showcases graph that can help organization to forecast the inventory requirement on the basis of sales data of previous financial years. It showcases data of last 3 years. This Stock Inventory Acquisition Forecast Demand Using Historical Sales Data Themes PDF from Slidegeeks makes it easy to present information on your topic with precision. It provides customization options, so you can make changes to the colors, design, graphics, or any other component to create a unique layout. It is also available for immediate download, so you can begin using it right away. Slidegeeks has done good research to ensure that you have everything you need to make your presentation stand out. Make a name out there for a brilliant performance.
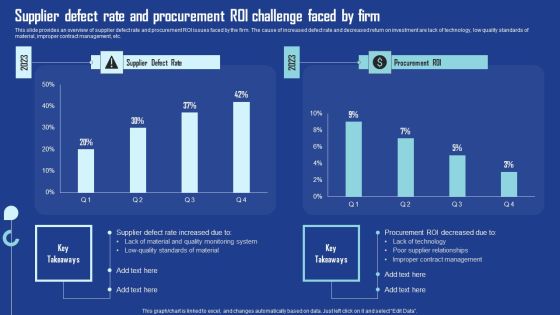
Supplier Defect Rate And Procurement Roi Challenge Faced By Firm Themes PDF
This slide provides an overview of supplier defect rate and procurement ROI issues faced by the firm. The cause of increased defect rate and decreased return on investment are lack of technology, low quality standards of material, improper contract management, etc. This Supplier Defect Rate And Procurement Roi Challenge Faced By Firm Themes PDF from Slidegeeks makes it easy to present information on your topic with precision. It provides customization options, so you can make changes to the colors, design, graphics, or any other component to create a unique layout. It is also available for immediate download, so you can begin using it right away. Slidegeeks has done good research to ensure that you have everything you need to make your presentation stand out. Make a name out there for a brilliant performance.

Detailed Guide For Talent Acquisition Budget Allocation By Different Talent Sourcing Channels Themes PDF
Mentioned slide provides information about budget that can be allocated by business for identifying best candidates for future hiring. It includes key elements such as employee referrals, job fair and networking event, internal recruitment, offline advertisement, online job boards, social media, website and recruitment tools. This Detailed Guide For Talent Acquisition Budget Allocation By Different Talent Sourcing Channels Themes PDF from Slidegeeks makes it easy to present information on your topic with precision. It provides customization options, so you can make changes to the colors, design, graphics, or any other component to create a unique layout. It is also available for immediate download, so you can begin using it right away. Slidegeeks has done good research to ensure that you have everything you need to make your presentation stand out. Make a name out there for a brilliant performance.
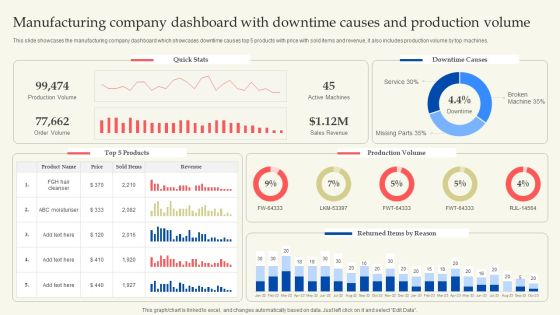
Manufacturing Company Dashboard With Downtime Causes And Production Volume Themes PDF
This slide showcases the manufacturing company dashboard which showcases downtime causes top 5 products with price with sold items and revenue, it also includes production volume by top machines. This Manufacturing Company Dashboard With Downtime Causes And Production Volume Themes PDF from Slidegeeks makes it easy to present information on your topic with precision. It provides customization options, so you can make changes to the colors, design, graphics, or any other component to create a unique layout. It is also available for immediate download, so you can begin using it right away. Slidegeeks has done good research to ensure that you have everything you need to make your presentation stand out. Make a name out there for a brilliant performance.
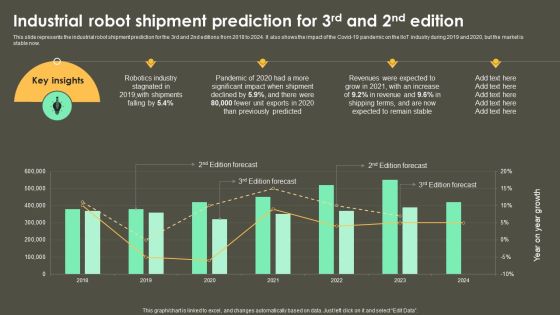
Iot Integration In Manufacturing Industrial Robot Shipment Prediction For 3Rd And 2Nd Edition Themes PDF
This slide represents the industrial robot shipment prediction for the 3rd and 2nd editions from 2018 to 2024. It also shows the impact of the Covid-19 pandemic on the IIoT industry during 2019 and 2020, but the market is stable now. This Iot Integration In Manufacturing Industrial Robot Shipment Prediction For 3Rd And 2Nd Edition Themes PDF from Slidegeeks makes it easy to present information on your topic with precision. It provides customization options, so you can make changes to the colors, design, graphics, or any other component to create a unique layout. It is also available for immediate download, so you can begin using it right away. Slidegeeks has done good research to ensure that you have everything you need to make your presentation stand out. Make a name out there for a brilliant performance.
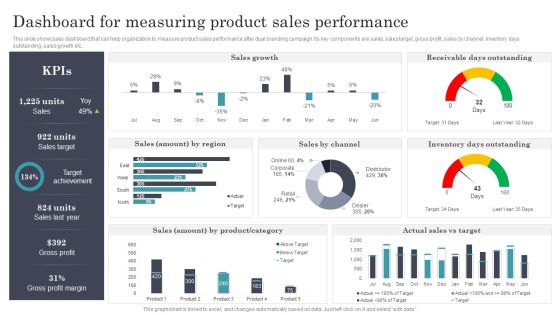
Developing Dual Branding Campaign For Brand Marketing Dashboard For Measuring Product Sales Performance Clipart PDF
This slide showcases dashboard that can help organization to measure product sales performance after dual branding campaign. Its key components are sales, sales target, gross profit, sales by channel, inventory days outstanding, sales growth etc. Create an editable Developing Dual Branding Campaign For Brand Marketing Dashboard For Measuring Product Sales Performance Clipart PDF that communicates your idea and engages your audience. Whether you are presenting a business or an educational presentation, pre designed presentation templates help save time. Developing Dual Branding Campaign For Brand Marketing Dashboard For Measuring Product Sales Performance Clipart PDF is highly customizable and very easy to edit, covering many different styles from creative to business presentations. Slidegeeks has creative team members who have crafted amazing templates. So, go and get them without any delay.

Employing Candidate Using Internal And External Mediums Of Recruitment Dashboard To Analyze Application Clipart PDF
This slide showcases dashboard that can help organization to evaluate average days taken to hire a candidate and major sources of application. It also showcases various other components which are open positions, candidates place, avg commission rate, reasons for candidate and client decline. From laying roadmaps to briefing everything in detail, our templates are perfect for you. You can set the stage with your presentation slides. All you have to do is download these easy to edit and customizable templates. Employing Candidate Using Internal And External Mediums Of Recruitment Dashboard To Analyze Application Clipart PDF will help you deliver an outstanding performance that everyone would remember and praise you for. Do download this presentation today.
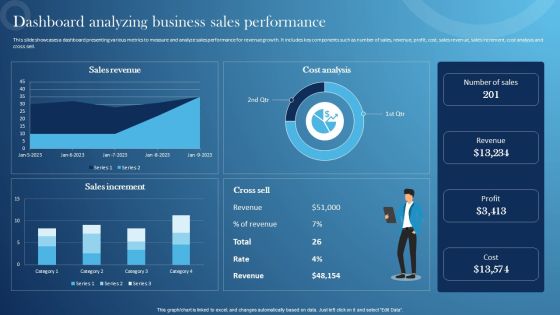
Inspecting Sales Optimization Areas Dashboard Analyzing Business Sales Performance Slides PDF
This slide showcases a dashboard presenting various metrics to measure and analyze sales performance for revenue growth. It includes key components such as number of sales, revenue, profit, cost, sales revenue, sales increment, cost analysis and cross sell. Create an editable Inspecting Sales Optimization Areas Dashboard Analyzing Business Sales Performance Slides PDF that communicates your idea and engages your audience. Whether youre presenting a business or an educational presentation, pre-designed presentation templates help save time. Inspecting Sales Optimization Areas Dashboard Analyzing Business Sales Performance Slides PDF is highly customizable and very easy to edit, covering many different styles from creative to business presentations. Slidegeeks has creative team members who have crafted amazing templates. So, go and get them without any delay.
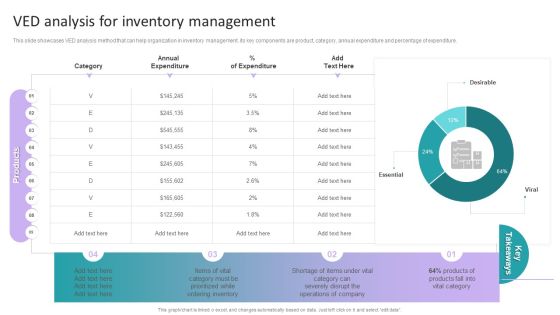
Stock Inventory Acquisition VED Analysis For Inventory Management Summary PDF
This slide showcases VED analysis method that can help organization in inventory management. its key components are product, category, annual expenditure and percentage of expenditure. Do you have to make sure that everyone on your team knows about any specific topic I yes, then you should give Stock Inventory Acquisition VED Analysis For Inventory Management Summary PDF a try. Our experts have put a lot of knowledge and effort into creating this impeccable Stock Inventory Acquisition VED Analysis For Inventory Management Summary PDF. You can use this template for your upcoming presentations, as the slides are perfect to represent even the tiniest detail. You can download these templates from the Slidegeeks website and these are easy to edit. So grab these today.
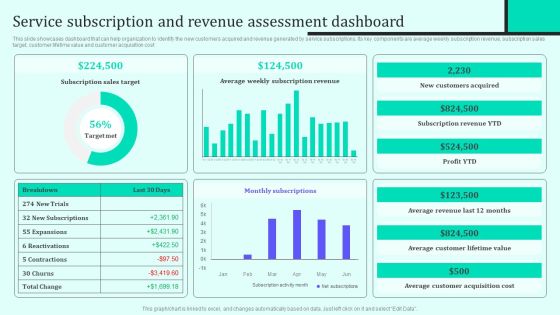
Implementing New Sales And Marketing Process For Services Service Subscription And Revenue Assessment Infographics PDF
This slide showcases dashboard that can help organization to identify the new customers acquired and revenue generated by service subscriptions. Its key components are average weekly subscription revenue, subscription sales target, customer lifetime value and customer acquisition cost. Do you have to make sure that everyone on your team knows about any specific topic I yes, then you should give Implementing New Sales And Marketing Process For Services Service Subscription And Revenue Assessment Infographics PDF a try. Our experts have put a lot of knowledge and effort into creating this impeccable Implementing New Sales And Marketing Process For Services Service Subscription And Revenue Assessment Infographics PDF. You can use this template for your upcoming presentations, as the slides are perfect to represent even the tiniest detail. You can download these templates from the Slidegeeks website and these are easy to edit. So grab these today.
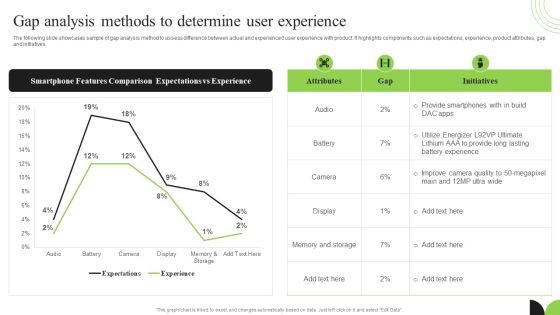
Guidebook For Executing Business Market Intelligence Gap Analysis Methods To Determine Infographics PDF
The following slide showcases sample of gap analysis method to assess difference between actual and experienced user experience with product. It highlights components such as expectations, experience, product attributes, gap and initiatives. Create an editable Guidebook For Executing Business Market Intelligence Gap Analysis Methods To Determine Infographics PDF that communicates your idea and engages your audience. Whether you are presenting a business or an educational presentation, pre designed presentation templates help save time. Guidebook For Executing Business Market Intelligence Gap Analysis Methods To Determine Infographics PDF is highly customizable and very easy to edit, covering many different styles from creative to business presentations. Slidegeeks has creative team members who have crafted amazing templates. So, go and get them without any delay.
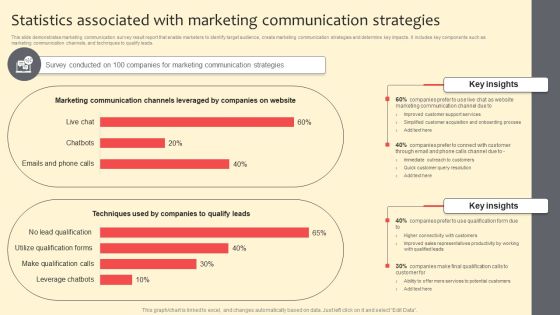
Statistics Associated With Marketing Communication Strategies Designs PDF
This slide demonstrates marketing communication survey result report that enable marketers to identify target audience, create marketing communication strategies and determine key impacts. It includes key components such as marketing communication channels, and techniques to qualify leads. Do you have to make sure that everyone on your team knows about any specific topic I yes, then you should give Statistics Associated With Marketing Communication Strategies Designs PDF a try. Our experts have put a lot of knowledge and effort into creating this impeccable Statistics Associated With Marketing Communication Strategies Designs PDF. You can use this template for your upcoming presentations, as the slides are perfect to represent even the tiniest detail. You can download these templates from the Slidegeeks website and these are easy to edit. So grab these today.
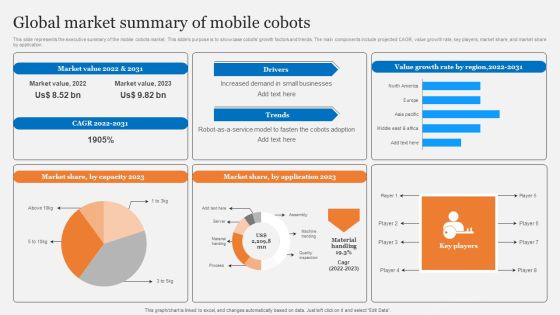
Cobots Usecases In Different Sectors Global Market Summary Of Mobile Cobots Structure PDF
This slide represents the executive summary of the mobile cobots market. This slides purpose is to showcase cobots growth factors and trends. The main components include projected CAGR, value growth rate, key players, market share, and market share by application. Do you have to make sure that everyone on your team knows about any specific topic I yes, then you should give Cobots Usecases In Different Sectors Global Market Summary Of Mobile Cobots Structure PDF a try. Our experts have put a lot of knowledge and effort into creating this impeccable Cobots Usecases In Different Sectors Global Market Summary Of Mobile Cobots Structure PDF. You can use this template for your upcoming presentations, as the slides are perfect to represent even the tiniest detail. You can download these templates from the Slidegeeks website and these are easy to edit. So grab these today.

Financial Kpi Dashboard To Evaluate Fundraising Impact Topics PDF
This slide showcases dashboard that can help organization to evaluate key changes in financial KPIs post fundraising. Its key components are net profit margin, revenue, gross profit margin, debt to equity and return on equity. Do you have to make sure that everyone on your team knows about any specific topic I yes, then you should give Financial Kpi Dashboard To Evaluate Fundraising Impact Topics PDF a try. Our experts have put a lot of knowledge and effort into creating this impeccable Financial Kpi Dashboard To Evaluate Fundraising Impact Topics PDF. You can use this template for your upcoming presentations, as the slides are perfect to represent even the tiniest detail. You can download these templates from the Slidegeeks website and these are easy to edit. So grab these today.

Coffee Cafe Company Profile Annual Business Revenue Showing Yearly Growth Sample PDF
Mentioned slide provided information about ten years company annual revenue growth and decline which further provided insights into business growth. It includes key component such as revenue in USD doller billion, and years. Create an editable Coffee Cafe Company Profile Annual Business Revenue Showing Yearly Growth Sample PDF that communicates your idea and engages your audience. Whether youre presenting a business or an educational presentation, pre designed presentation templates help save time. Coffee Cafe Company Profile Annual Business Revenue Showing Yearly Growth Sample PDF is highly customizable and very easy to edit, covering many different styles from creative to business presentations. Slidegeeks has creative team members who have crafted amazing templates. So, go and get them without any delay.
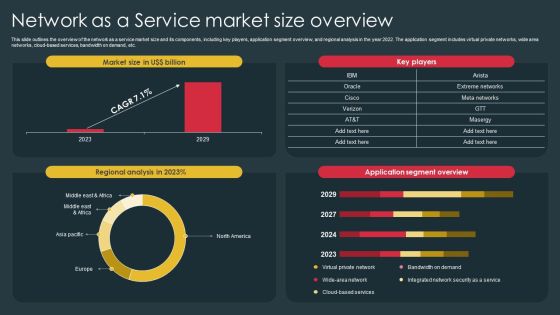
Managed Network Services Network As A Service Market Size Overview Information PDF
This slide outlines the overview of the network as a service market size and its components, including key players, application segment overview, and regional analysis in the year 2022. The application segment includes virtual private networks, wide area networks, cloud-based services, bandwidth on demand, etc. From laying roadmaps to briefing everything in detail, our templates are perfect for you. You can set the stage with your presentation slides. All you have to do is download these easy to edit and customizable templates. Managed Network Services Network As A Service Market Size Overview Information PDF will help you deliver an outstanding performance that everyone would remember and praise you for. Do download this presentation today.

Profit And Loss Account Statement Summary Of Revenue Cost And Expenses Portrait PDF
The slides provide a glimpse of the projected profit and loss statement to visualize the platforms financial performance for the next five years. The key components are total revenue from operations, gross profit, EBITDA, etc. Do you have to make sure that everyone on your team knows about any specific topic I yes, then you should give Profit And Loss Account Statement Summary Of Revenue Cost And Expenses Portrait PDF a try. Our experts have put a lot of knowledge and effort into creating this impeccable Profit And Loss Account Statement Summary Of Revenue Cost And Expenses Portrait PDF. You can use this template for your upcoming presentations, as the slides are perfect to represent even the tiniest detail. You can download these templates from the Slidegeeks website and these are easy to edit. So grab these today.
Monthly Sales Performance Tracking And Monitoring Dashboard Sample PDF
This slide showcases a dashboard presenting various metrics to measure and analyze sales performance for revenue growth. It includes key components such as number of sales, revenue, profit, cost, sales revenue, sales increment, cost analysis and cross sell. Do you have to make sure that everyone on your team knows about any specific topic I yes, then you should give Monthly Sales Performance Tracking And Monitoring Dashboard Sample PDF a try. Our experts have put a lot of knowledge and effort into creating this impeccable Monthly Sales Performance Tracking And Monitoring Dashboard Sample PDF. You can use this template for your upcoming presentations, as the slides are perfect to represent even the tiniest detail. You can download these templates from the Slidegeeks website and these are easy to edit. So grab these today.

Developing Quarterly Budget For Employee Retention Developing Employee Retention Techniques Information PDF
The purpose of this slide is to showcase a monthly budget sheet used for staff retention and covers elements such as training and development programs, incentives scheme, onboarding cost, and staff retention payroll. It also includes a graphical representation of the total budget allocated for employee retention. Are you searching for a Developing Quarterly Budget For Employee Retention Developing Employee Retention Techniques Information PDF that is uncluttered, straightforward, and original Its easy to edit, and you can change the colors to suit your personal or business branding. For a presentation that expresses how much effort you have put in, this template is ideal With all of its features, including tables, diagrams, statistics, and lists, its perfect for a business plan presentation. Make your ideas more appealing with these professional slides. Download Developing Quarterly Budget For Employee Retention Developing Employee Retention Techniques Information PDF from Slidegeeks today.

Synopsis For House Flipping Techniques Market Overview For Real Estate Property Market Template PDF
This slide represents real estate market summary that helps investors in decision making. It covers gross profit, ROI, house flip sales, inflation, market demand etc. Are you searching for a Synopsis For House Flipping Techniques Market Overview For Real Estate Property Market Template PDF that is uncluttered, straightforward, and original Its easy to edit, and you can change the colors to suit your personal or business branding. For a presentation that expresses how much effort you have put in, this template is ideal With all of its features, including tables, diagrams, statistics, and lists, its perfect for a business plan presentation. Make your ideas more appealing with these professional slides. Download Synopsis For House Flipping Techniques Market Overview For Real Estate Property Market Template PDF from Slidegeeks today.

Sectoral Overview Of Artificial Intelligence In Marketing Ppt Show Infographic Template PDF
This slide showcases sectoral overview of artificial intelligence technology in marketing. It provides details about ChatGPT, DALL-E, learning algorithms, adoption, customer engagement, machine learning, etc. Are you searching for a Sectoral Overview Of Artificial Intelligence In Marketing Ppt Show Infographic Template PDF that is uncluttered, straightforward, and original Its easy to edit, and you can change the colors to suit your personal or business branding. For a presentation that expresses how much effort you have put in, this template is ideal With all of its features, including tables, diagrams, statistics, and lists, its perfect for a business plan presentation. Make your ideas more appealing with these professional slides. Download Sectoral Overview Of Artificial Intelligence In Marketing Ppt Show Infographic Template PDF from Slidegeeks today.

International Business Extension Dashboard To Analyse Sales Post Global Expansion Guidelines PDF
This slide showcase dashboard that can help organization track sales after global expansion. Its key components are sales target, target achievement, sales by channel, inventory days outstanding, sales growth, gross profit, gross profit margin etc. Are you in need of a template that can accommodate all of your creative concepts This one is crafted professionally and can be altered to fit any style. Use it with Google Slides or PowerPoint. Include striking photographs, symbols, depictions, and other visuals. Fill, move around, or remove text boxes as desired. Test out color palettes and font mixtures. Edit and save your work, or work with colleagues. Download International Business Extension Dashboard To Analyse Sales Post Global Expansion Guidelines PDF and observe how to make your presentation outstanding. Give an impeccable presentation to your group and make your presentation unforgettable.

International Business Extension Dashboard To Track Revenue After Global Expansion Introduction PDF
This slide showcase dashboard that can help organization track revenue after global expansion. Its key components are average revenue per customer, customer acquisition cost, customer lifetime value and new customers acquired. Crafting an eye-catching presentation has never been more straightforward. Let your presentation shine with this tasteful yet straightforward International Business Extension Dashboard To Track Revenue After Global Expansion Introduction PDF template. It offers a minimalistic and classy look that is great for making a statement. The colors have been employed intelligently to add a bit of playfulness while still remaining professional. Construct the ideal International Business Extension Dashboard To Track Revenue After Global Expansion Introduction PDF that effortlessly grabs the attention of your audience Begin now and be certain to wow your customers.

Enhancing Customer Outreach Service Subscription And Revenue Assessment Summary PDF
This slide showcases dashboard that can help organization to identify the new customers acquired and revenue generated by service subscriptions. Its key components are average weekly subscription revenue, subscription sales target, customer lifetime value and customer acquisition cost. This modern and well-arranged Enhancing Customer Outreach Service Subscription And Revenue Assessment Summary PDF provides lots of creative possibilities. It is very simple to customize and edit with the Powerpoint Software. Just drag and drop your pictures into the shapes. All facets of this template can be edited with Powerpoint, no extra software is necessary. Add your own material, put your images in the places assigned for them, adjust the colors, and then you can show your slides to the world, with an animated slide included.

Assessing International Market Dashboard To Analyse Sales Post Global Expansion Elements PDF
This slide showcase dashboard that can help organization track sales after global expansion. Its key components are sales target, target achievement, sales by channel, inventory days outstanding, sales growth, gross profit, gross profit margin etc. Are you in need of a template that can accommodate all of your creative concepts This one is crafted professionally and can be altered to fit any style. Use it with Google Slides or PowerPoint. Include striking photographs, symbols, depictions, and other visuals. Fill, move around, or remove text boxes as desired. Test out color palettes and font mixtures. Edit and save your work, or work with colleagues. Download Assessing International Market Dashboard To Analyse Sales Post Global Expansion Elements PDF and observe how to make your presentation outstanding. Give an impeccable presentation to your group and make your presentation unforgettable.

Employing Candidate Using Internal And External Mediums Of Recruitment Dashboard To Identify Open Positions Microsoft PDF
This slide showcases dashboard that can help organization to identify open positions in organization after conducting recruitment and offer acceptance ratio of candidates. It also showcases various other components which are shorlisted candidates, hired candidates, time to hire, cost to hire, applications details. Present like a pro with Employing Candidate Using Internal And External Mediums Of Recruitment Dashboard To Identify Open Positions Microsoft PDF Create beautiful presentations together with your team, using our easy to use presentation slides. Share your ideas in real time and make changes on the fly by downloading our templates. So whether you are in the office, on the go, or in a remote location, you can stay in sync with your team and present your ideas with confidence. With Slidegeeks presentation got a whole lot easier. Grab these presentations today.
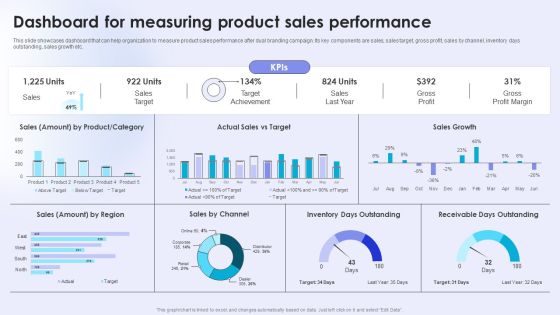
Dual Branding Campaign To Boost Sales Of Product Or Services Dashboard For Measuring Product Sales Elements PDF
This slide showcases dashboard that can help organization to measure product sales performance after dual branding campaign. Its key components are sales, sales target, gross profit, sales by channel, inventory days outstanding, sales growth etc. The Dual Branding Campaign To Boost Sales Of Product Or Services Dashboard For Measuring Product Sales Elements PDF is a compilation of the most recent design trends as a series of slides. It is suitable for any subject or industry presentation, containing attractive visuals and photo spots for businesses to clearly express their messages. This template contains a variety of slides for the user to input data, such as structures to contrast two elements, bullet points, and slides for written information. Slidegeeks is prepared to create an impression.

Techniques To Boost Brand Awareness Dashboard To Track Website Traffic After Brand Awareness Ideas PDF
This slide showcases dashboard that can help organization to track the website traffic after running online brand awareness marketing campaigns. Its key components are new visitors, traffic by source, traffic by lead source, customers wins by lead source and bounce rate. Slidegeeks is here to make your presentations a breeze with Techniques To Boost Brand Awareness Dashboard To Track Website Traffic After Brand Awareness Ideas PDF With our easy-to-use and customizable templates, you can focus on delivering your ideas rather than worrying about formatting. With a variety of designs to choose from, youre sure to find one that suits your needs. And with animations and unique photos, illustrations, and fonts, you can make your presentation pop. So whether youre giving a sales pitch or presenting to the board, make sure to check out Slidegeeks first.

Enterprise Risk Management Market Analysis Report Introduction To ERM Clipart PDF
This slide represents the report to analyze the market growth rate and market size of enterprise risk management market. It includes details related to market size, key players, regional analysis and components segment overview of enterprise risk management market.Get a simple yet stunning designed Enterprise Risk Management Market Analysis Report Introduction To ERM Clipart PDF. It is the best one to establish the tone in your meetings. It is an excellent way to make your presentations highly effective. So, download this PPT today from Slidegeeks and see the positive impacts. Our easy-to-edit Enterprise Risk Management Market Analysis Report Introduction To ERM Clipart PDF can be your go-to option for all upcoming conferences and meetings. So, what are you waiting for Grab this template today.

Developing Recruitment Dashboard To Analyze Application Sources And Days To Hire Clipart PDF
This slide showcases dashboard that can help organization to evaluate average days taken to hire a candidate and major sources of application. It also showcases various other components which are open positions, candidates place, avg commission rate, reasons for candidate and client decline. Get a simple yet stunning designed Developing Recruitment Dashboard To Analyze Application Sources And Days To Hire Clipart PDF. It is the best one to establish the tone in your meetings. It is an excellent way to make your presentations highly effective. So, download this PPT today from Slidegeeks and see the positive impacts. Our easy-to-edit Developing Recruitment Dashboard To Analyze Application Sources And Days To Hire Clipart PDF can be your go-to option for all upcoming conferences and meetings. So, what are you waiting for Grab this template today.

Screening And Staffing Dashboard To Identify Open Positions And Offer Acceptance Inspiration PDF
This slide showcases dashboard that can help organization to identify open positions in organization after conducting recruitment and offer acceptance ratio of candidates. It also showcases various other components which are shorlisted candidates, hired candidates, time to hire, cost to hire, applications details. Present like a pro with Screening And Staffing Dashboard To Identify Open Positions And Offer Acceptance Inspiration PDF Create beautiful presentations together with your team, using our easy-to-use presentation slides. Share your ideas in real-time and make changes on the fly by downloading our templates. So whether youre in the office, on the go, or in a remote location, you can stay in sync with your team and present your ideas with confidence. With Slidegeeks presentation got a whole lot easier. Grab these presentations today.
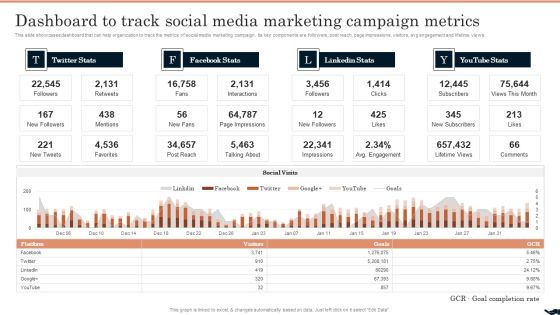
Generating Leads Through Dashboard To Track Social Media Marketing Campaign Metrics Pictures PDF
This slide showcases dashboard that can help organization to track the metrics of social media marketing campaign. Its key components are followers, post reach, page impressions, visitors, avg engagement and lifetime views. Present like a pro with Generating Leads Through Dashboard To Track Social Media Marketing Campaign Metrics Pictures PDF Create beautiful presentations together with your team, using our easy-to-use presentation slides. Share your ideas in real-time and make changes on the fly by downloading our templates. So whether youre in the office, on the go, or in a remote location, you can stay in sync with your team and present your ideas with confidence. With Slidegeeks presentation got a whole lot easier. Grab these presentations today.

Cloud Kitchen Business Financials Management Dashboard Analyzing Global Commissary Rules PDF
This slide presents a dashboard for tracking and managing business income and expenditure. It includes key components such as method of payment, voids, discounts, refunds, top menu items, cost by staff type and percentage of revenue.Get a simple yet stunning designed Cloud Kitchen Business Financials Management Dashboard Analyzing Global Commissary Rules PDF. It is the best one to establish the tone in your meetings. It is an excellent way to make your presentations highly effective. So, download this PPT today from Slidegeeks and see the positive impacts. Our easy-to-edit Cloud Kitchen Business Financials Management Dashboard Analyzing Global Commissary Rules PDF can be your go-to option for all upcoming conferences and meetings. So, what are you waiting for Grab this template today.

Cloud Kitchen Business Performance Management Dashboard Analyzing Global Commissary Guidelines PDF
This slide highlights a dashboard to track and manage performance progress of a dark kitchen business. It showcases components such as income, expense, order rate, activity, total order complete, total order delivered, total order cancelled, order pending and popular food.Present like a pro with Cloud Kitchen Business Performance Management Dashboard Analyzing Global Commissary Guidelines PDF Create beautiful presentations together with your team, using our easy-to-use presentation slides. Share your ideas in real-time and make changes on the fly by downloading our templates. So whether you are in the office, on the go, or in a remote location, you can stay in sync with your team and present your ideas with confidence. With Slidegeeks presentation got a whole lot easier. Grab these presentations today.

Cloud Kitchen Market Segmentation By Nature Analyzing Global Commissary Kitchen Industry Demonstration PDF
The following slide showcases current and forecasted market distribution of global cloud kitchen market based on nature of business . It showcases components such as franchised market and standalone market.Slidegeeks is here to make your presentations a breeze with Cloud Kitchen Market Segmentation By Nature Analyzing Global Commissary Kitchen Industry Demonstration PDF With our easy-to-use and customizable templates, you can focus on delivering your ideas rather than worrying about formatting. With a variety of designs to choose from, you are sure to find one that suits your needs. And with animations and unique photos, illustrations, and fonts, you can make your presentation pop. So whether you are giving a sales pitch or presenting to the board, make sure to check out Slidegeeks first.

Dashboard For Tracking Brand Awareness Advertisement Campaign Results Designs PDF
This slide showcases dashboard that can help organization to track results of online advertisement campaigns. Its key components ad impressions, click through rate, cost per conversion, revenue per click, impressions, new users and sessions.Are you in need of a template that can accommodate all of your creative concepts This one is crafted professionally and can be altered to fit any style. Use it with Google Slides or PowerPoint. Include striking photographs, symbols, depictions, and other visuals. Fill, move around, or remove text boxes as desired. Test out color palettes and font mixtures. Edit and save your work, or work with colleagues. Download Dashboard For Tracking Brand Awareness Advertisement Campaign Results Designs PDF and observe how to make your presentation outstanding. Give an impeccable presentation to your group and make your presentation unforgettable.

Dashboard To Track Website Traffic After Brand Awareness Campaign Structure PDF
This slide showcases dashboard that can help organization to track the website traffic after running online brand awareness marketing campaigns. Its key components are new visitors, traffic by source, traffic by lead source, customers wins by lead source and bounce rate.Crafting an eye-catching presentation has never been more straightforward. Let your presentation shine with this tasteful yet straightforward Dashboard To Track Website Traffic After Brand Awareness Campaign Structure PDF template. It offers a minimalistic and classy look that is great for making a statement. The colors have been employed intelligently to add a bit of playfulness while still remaining professional. Construct the ideal Dashboard To Track Website Traffic After Brand Awareness Campaign Structure PDF that effortlessly grabs the attention of your audience Begin now and be certain to wow your customers.

Datafy Is Datafication A New Business Model Rules PDF
This slide represents how datafication is a new model for businesses that is dispersed across all industry divisions. In this model, artificial intelligence and machine learning are critical components and helpful in generating valuable insights from the collected data. Coming up with a presentation necessitates that the majority of the effort goes into the content and the message you intend to convey. The visuals of a PowerPoint presentation can only be effective if it supplements and supports the story that is being told. Keeping this in mind our experts created Datafy Is Datafication A New Business Model Rules PDF to reduce the time that goes into designing the presentation. This way, you can concentrate on the message while our designers take care of providing you with the right template for the situation.

Complete Guide To Product Pricing Techniques Operational Challenges Of Setting Prices Portrait PDF
This template covers the challenges faced by companys operations of setting prices such as keeping up with competitors prices, markdown spend, promotions across channels, etc. This Complete Guide To Product Pricing Techniques Operational Challenges Of Setting Prices Portrait PDF from Slidegeeks makes it easy to present information on your topic with precision. It provides customization options, so you can make changes to the colors, design, graphics, or any other component to create a unique layout. It is also available for immediate download, so you can begin using it right away. Slidegeeks has done good research to ensure that you have everything you need to make your presentation stand out. Make a name out there for a brilliant performance.

Digital Marketing Strategy Dashboard To Track Social Media Ads Campaign Results Introduction PDF
This slide showcases dashboard that can help organization to track performance of social media advertising campaigns. Its key components are cost per conversion, CTR, link clicks, impressions, conversion rate, click through rate and cost per click. The Digital Marketing Strategy Dashboard To Track Social Media Ads Campaign Results Introduction PDF is a compilation of the most recent design trends as a series of slides. It is suitable for any subject or industry presentation, containing attractive visuals and photo spots for businesses to clearly express their messages. This template contains a variety of slides for the user to input data, such as structures to contrast two elements, bullet points, and slides for written information. Slidegeeks is prepared to create an impression.

Strategies For Marketing Dashboard To Track Website Traffic After Brand Awareness Graphics PDF
This slide showcases dashboard that can help organization to track the website traffic after running online brand awareness marketing campaigns. Its key components are new visitors, traffic by source, traffic by lead source, customers wins by lead source and bounce rate. Present like a pro with Strategies For Marketing Dashboard To Track Website Traffic After Brand Awareness Graphics PDF Create beautiful presentations together with your team, using our easy-to-use presentation slides. Share your ideas in real-time and make changes on the fly by downloading our templates. So whether youre in the office, on the go, or in a remote location, you can stay in sync with your team and present your ideas with confidence. With Slidegeeks presentation got a whole lot easier. Grab these presentations today.
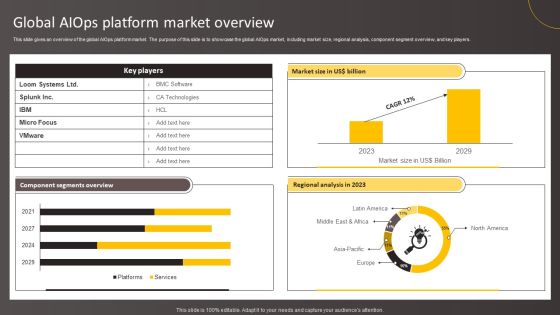
Global Aiops Platform Market Overview Brochure PDF
This slide gives an overview of the global AIOps platform market. The purpose of this slide is to showcase the global AIOps market, including market size, regional analysis, component segment overview, and key players. Coming up with a presentation necessitates that the majority of the effort goes into the content and the message you intend to convey. The visuals of a PowerPoint presentation can only be effective if it supplements and supports the story that is being told. Keeping this in mind our experts created Global Aiops Platform Market Overview Brochure PDF to reduce the time that goes into designing the presentation. This way, you can concentrate on the message while our designers take care of providing you with the right template for the situation.
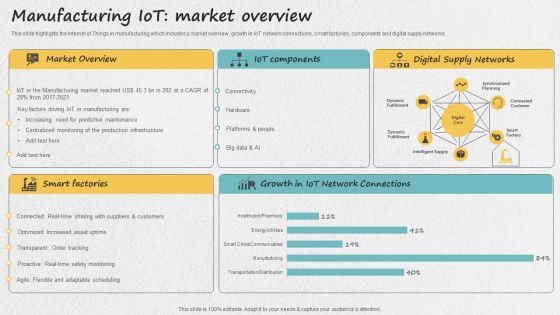
Iot Applications For Manufacturing Industry Manufacturing Iot Market Overview Download PDF
This slide highlights the Internet of Things in manufacturing which includes a market overview, growth in IoT network connections, smart factories, components and digital supply networks. Are you in need of a template that can accommodate all of your creative concepts This one is crafted professionally and can be altered to fit any style. Use it with Google Slides or PowerPoint. Include striking photographs, symbols, depictions, and other visuals. Fill, move around, or remove text boxes as desired. Test out color palettes and font mixtures. Edit and save your work, or work with colleagues. Download Iot Applications For Manufacturing Industry Manufacturing Iot Market Overview Download PDF and observe how to make your presentation outstanding. Give an impeccable presentation to your group and make your presentation unforgettable.

Strategic Market Insight Implementation Guide Dashboard To Analyze Business Performance In Market Slides PDF
The following slide showcases a dashboard to evaluate organizational performance in market and analyze competition. It outlines components such as number of mention, sentiment meter, number of mentions, geographical distribution. Get a simple yet stunning designed Strategic Market Insight Implementation Guide Dashboard To Analyze Business Performance In Market Slides PDF. It is the best one to establish the tone in your meetings. It is an excellent way to make your presentations highly effective. So, download this PPT today from Slidegeeks and see the positive impacts. Our easy to edit Strategic Market Insight Implementation Guide Dashboard To Analyze Business Performance In Market Slides PDF can be your go to option for all upcoming conferences and meetings. So, what are you waiting for Grab this template today.

Strategic Market Insight Implementation Guide Gap Analysis Methods To Determine User Experience Brochure PDF
The following slide showcases sample of gap analysis method to assess difference between actual and experienced user experience with product. It highlights components such as expectations, experience, product attributes, gap and initiatives. Are you in need of a template that can accommodate all of your creative concepts This one is crafted professionally and can be altered to fit any style. Use it with Google Slides or PowerPoint. Include striking photographs, symbols, depictions, and other visuals. Fill, move around, or remove text boxes as desired. Test out color palettes and font mixtures. Edit and save your work, or work with colleagues. Download Strategic Market Insight Implementation Guide Gap Analysis Methods To Determine User Experience Brochure PDF and observe how to make your presentation outstanding. Give an impeccable presentation to your group and make your presentation unforgettable.
Monthly Sales Performance Tracking And Monitoring Dashboard Inspiration PDF
This slide showcases a dashboard presenting various metrics to measure and analyze sales performance for revenue growth. It includes key components such as number of sales, revenue, profit, cost, sales revenue, sales increment, cost analysis and cross sell. Coming up with a presentation necessitates that the majority of the effort goes into the content and the message you intend to convey. The visuals of a PowerPoint presentation can only be effective if it supplements and supports the story that is being told. Keeping this in mind our experts created Monthly Sales Performance Tracking And Monitoring Dashboard Inspiration PDF to reduce the time that goes into designing the presentation. This way, you can concentrate on the message while our designers take care of providing you with the right template for the situation.
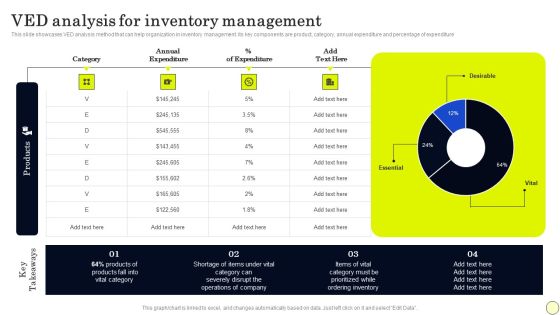
Strategies To Order And Manage Ideal Inventory Levels VED Analysis For Inventory Brochure PDF
This slide showcases VED analysis method that can help organization in inventory management. its key components are product, category, annual expenditure and percentage of expenditure. Present like a pro with Strategies To Order And Manage Ideal Inventory Levels VED Analysis For Inventory Brochure PDF Create beautiful presentations together with your team, using our easy to use presentation slides. Share your ideas in real time and make changes on the fly by downloading our templates. So whether you are in the office, on the go, or in a remote location, you can stay in sync with your team and present your ideas with confidence. With Slidegeeks presentation got a whole lot easier. Grab these presentations today.

Employee Retention And Turnover Rates Monitoring Dashboard Professional PDF
This slide showcases a dashboard to supervise and monitor employee retention and turnover score. It includes key components such as active employees, hires, exits, retention rate, turnover rate, etc. Coming up with a presentation necessitates that the majority of the effort goes into the content and the message you intend to convey. The visuals of a PowerPoint presentation can only be effective if it supplements and supports the story that is being told. Keeping this in mind our experts created Employee Retention And Turnover Rates Monitoring Dashboard Professional PDF to reduce the time that goes into designing the presentation. This way, you can concentrate on the message while our designers take care of providing you with the right template for the situation.

International Cloud Kitchen Industry Analysis Cloud Kitchen Market Segmentation By Nature Introduction PDF
The following slide showcases current and forecasted market distribution of global cloud kitchen market based on nature of business . it showcases components such as franchised market and standalone market. Present like a pro with International Cloud Kitchen Industry Analysis Cloud Kitchen Market Segmentation By Nature Introduction PDF Create beautiful presentations together with your team, using our easy-to-use presentation slides. Share your ideas in real-time and make changes on the fly by downloading our templates. So whether you are in the office, on the go, or in a remote location, you can stay in sync with your team and present your ideas with confidence. With Slidegeeks presentation got a whole lot easier. Grab these presentations today.

Target Customer Analysis And Segmentation Dashboard Ppt Portfolio Example Topics PDF
The following slide presents a dashboard for analyzing customer segmentation based on demographics factors. It includes key components such as appointment status value, count of payment method, total payments and age count. Slidegeeks is here to make your presentations a breeze with Target Customer Analysis And Segmentation Dashboard Ppt Portfolio Example Topics PDF With our easy to use and customizable templates, you can focus on delivering your ideas rather than worrying about formatting. With a variety of designs to choose from, you are sure to find one that suits your needs. And with animations and unique photos, illustrations, and fonts, you can make your presentation pop. So whether you are giving a sales pitch or presenting to the board, make sure to check out Slidegeeks first.

AMR Robot Dashboard To Track Autonomous Mobile Robot Performance Ppt PowerPoint Presentation Diagram Images PDF
This slide represents the dashboard to track the AMRs performance in the warehouse. It covers various AMRs status reports, energy consumption, battery level, total working hours, and time to return. Presenting this PowerPoint presentation, titled AMR Robot Dashboard To Track Autonomous Mobile Robot Performance Ppt PowerPoint Presentation Diagram Images PDF, with topics curated by our researchers after extensive research. This editable presentation is available for immediate download and provides attractive features when used. Download now and captivate your audience. Presenting this AMR Robot Dashboard To Track Autonomous Mobile Robot Performance Ppt PowerPoint Presentation Diagram Images PDF. Our researchers have carefully researched and created these slides with all aspects taken into consideration. This is a completely customizable AMR Robot Dashboard To Track Autonomous Mobile Robot Performance Ppt PowerPoint Presentation Diagram Images PDF that is available for immediate downloading. Download now and make an impact on your audience. Highlight the attractive features available with our PPTs.

Social Networks Marketing To Improve Key Social Media Advertising Goals Of Enterprise Diagrams PDF
This slide shows the objectives desired to be achieved by the enterprise in the upcoming years through effective social media advertising. It includes achievement of goals such as increase in brand awareness and community engagement. Presenting this PowerPoint presentation, titled Social Networks Marketing To Improve Key Social Media Advertising Goals Of Enterprise Diagrams PDF, with topics curated by our researchers after extensive research. This editable presentation is available for immediate download and provides attractive features when used. Download now and captivate your audience. Presenting this Social Networks Marketing To Improve Key Social Media Advertising Goals Of Enterprise Diagrams PDF. Our researchers have carefully researched and created these slides with all aspects taken into consideration. This is a completely customizable Social Networks Marketing To Improve Key Social Media Advertising Goals Of Enterprise Diagrams PDF that is available for immediate downloading. Download now and make an impact on your audience. Highlight the attractive features available with our PPTs.

Dashboard For Impact Of Hyper Automation And RPA On Healthcare Industry Diagrams PDF
Purpose of the following slide is to provide an overview of RPA and Hyper automation impact on healthcare industry as it displays essential KPIs such as process speed, employee engagement and reduction in human error etc. Presenting this PowerPoint presentation, titled ashboard For Impact Of Hyper Automation And RPA On Healthcare Industry Diagrams PDF, with topics curated by our researchers after extensive research. This editable presentation is available for immediate download and provides attractive features when used. Download now and captivate your audience. Presenting this ashboard For Impact Of Hyper Automation And RPA On Healthcare Industry Diagrams PDF. Our researchers have carefully researched and created these slides with all aspects taken into consideration. This is a completely customizable ashboard For Impact Of Hyper Automation And RPA On Healthcare Industry Diagrams PDF that is available for immediate downloading. Download now and make an impact on your audience. Highlight the attractive features available with our PPTs.
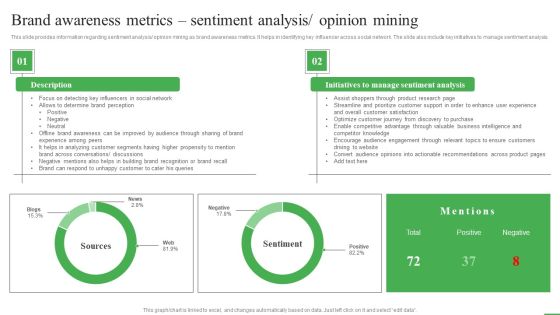
How To Boost Brand Recognition Brand Awareness Metrics Sentiment Analysis Diagrams PDF
This slide provides information regarding sentiment analysis or opinion mining as brand awareness metrics. It helps in identifying key influencer across social network. The slide also include key initiatives to manage sentiment analysis. Presenting this PowerPoint presentation, titled How To Boost Brand Recognition Brand Awareness Metrics Sentiment Analysis Diagrams PDF, with topics curated by our researchers after extensive research. This editable presentation is available for immediate download and provides attractive features when used. Download now and captivate your audience. Presenting this How To Boost Brand Recognition Brand Awareness Metrics Sentiment Analysis Diagrams PDF. Our researchers have carefully researched and created these slides with all aspects taken into consideration. This is a completely customizable How To Boost Brand Recognition Brand Awareness Metrics Sentiment Analysis Diagrams PDF that is available for immediate downloading. Download now and make an impact on your audience. Highlight the attractive features available with our PPTs.
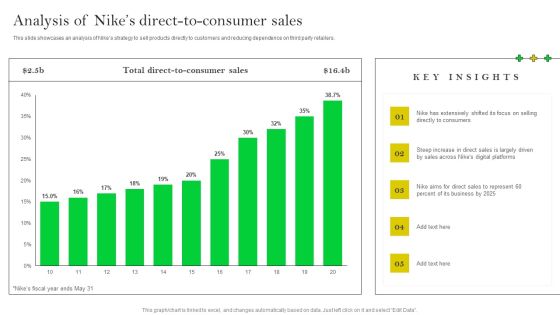
How Nike Developed And Executed Strategic Promotion Techniques Analysis Of Nikes Direct Diagrams PDF
This slide showcases an analysis of Nikes strategy to sell products directly to customers and reducing dependence on third party retailers. Presenting this PowerPoint presentation, titled How Nike Developed And Executed Strategic Promotion Techniques Analysis Of Nikes Direct Diagrams PDF, with topics curated by our researchers after extensive research. This editable presentation is available for immediate download and provides attractive features when used. Download now and captivate your audience. Presenting this How Nike Developed And Executed Strategic Promotion Techniques Analysis Of Nikes Direct Diagrams PDF. Our researchers have carefully researched and created these slides with all aspects taken into consideration. This is a completely customizable How Nike Developed And Executed Strategic Promotion Techniques Analysis Of Nikes Direct Diagrams PDF that is available for immediate downloading. Download now and make an impact on your audience. Highlight the attractive features available with our PPTs.

Architecture Engineering Planning Services Company Business Statistics Clipart PDF
This slide highlights the architecture company statistics which include public and private clients, total projects finalized, free cash flow, client satisfaction and sustainable contribution. Presenting this PowerPoint presentation, titled Architecture Engineering Planning Services Company Business Statistics Clipart PDF, with topics curated by our researchers after extensive research. This editable presentation is available for immediate download and provides attractive features when used. Download now and captivate your audience. Presenting this Architecture Engineering Planning Services Company Business Statistics Clipart PDF. Our researchers have carefully researched and created these slides with all aspects taken into consideration. This is a completely customizable Architecture Engineering Planning Services Company Business Statistics Clipart PDF that is available for immediate downloading. Download now and make an impact on your audience. Highlight the attractive features available with our PPTs.

Budget Planning For CPA Marketing Campaign Ppt Professional Samples PDF
This slides showcases the budget allocation for CPA marketing campaign activities. It includes network fees, marketing resources, management cost, advertising cost, affiliate acquisition cost, affiliate commission, product development cost etc. Presenting this PowerPoint presentation, titled Budget Planning For CPA Marketing Campaign Ppt Professional Samples PDF, with topics curated by our researchers after extensive research. This editable presentation is available for immediate download and provides attractive features when used. Download now and captivate your audience. Presenting this Budget Planning For CPA Marketing Campaign Ppt Professional Samples PDF. Our researchers have carefully researched and created these slides with all aspects taken into consideration. This is a completely customizable Budget Planning For CPA Marketing Campaign Ppt Professional Samples PDF that is available for immediate downloading. Download now and make an impact on your audience. Highlight the attractive features available with our PPTs.
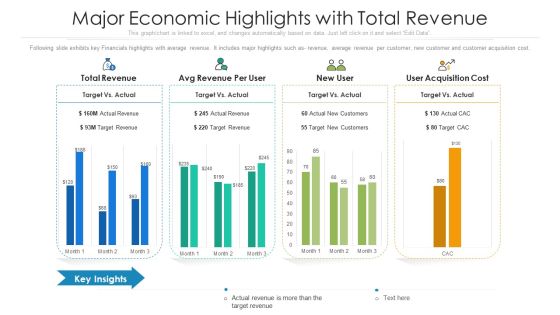
Major Economic Highlights With Total Revenue Ppt PowerPoint Presentation Gallery Design Ideas PDF
Following slide exhibits key Financials highlights with average revenue. It includes major highlights such as- revenue, average revenue per customer, new customer and customer acquisition cost. Pitch your topic with ease and precision using this major economic highlights with total revenue ppt powerpoint presentation gallery design ideas pdf. This layout presents information on revenue, acquisition, cost. It is also available for immediate download and adjustment. So, changes can be made in the color, design, graphics or any other component to create a unique layout.
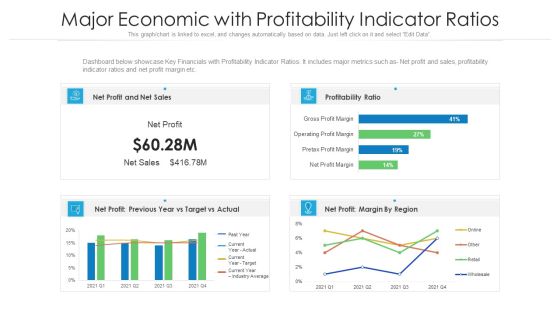
Major Economic With Profitability Indicator Ratios Ppt PowerPoint Presentation Gallery Layouts PDF
Dashboard below showcase Key Financials with Profitability Indicator Ratios. It includes major metrics such as- Net profit and sales, profitability indicator ratios and net profit margin etc. Pitch your topic with ease and precision using this major economic with profitability indicator ratios ppt powerpoint presentation gallery layouts pdf. This layout presents information on sales, profitability ratio, target. It is also available for immediate download and adjustment. So, changes can be made in the color, design, graphics or any other component to create a unique layout.

Project Delivery Method Dashboard With Service Level Agreement Status Clipart PDF
This slide outlines KPI dashboard which cover details of project delivery metrics. The metrics covered in the dashboard are total investment, revenue generated, total days spent on projects, service level agreement status by individual project etc. Pitch your topic with ease and precision using this project delivery method dashboard with service level agreement status clipart pdf. This layout presents information on project delivery method dashboard with service level agreement status. It is also available for immediate download and adjustment. So, changes can be made in the color, design, graphics or any other component to create a unique layout.

Outstanding Payment Recovery Dashboards With Outbound And Inbound Communications Graphics PDF
This slide represents visually shows the loan recovery initiatives success in terms of debts breakdowns, amount pending, weekly inbound and outbound calls information. Pitch your topic with ease and precision using this outstanding payment recovery dashboards with outbound and inbound communications graphics pdf. This layout presents information on outstanding payment recovery dashboards with outbound and inbound communications. It is also available for immediate download and adjustment. So, changes can be made in the color, design, graphics or any other component to create a unique layout.

Problem Administration Kpi Dashboard With Bugs Status Ideas PDF
This slide covers dashboard that will help the project managers to keep the track of the bugs faced by the team members during the IT project. Pitch your topic with ease and precision using this problem administration kpi dashboard with bugs status ideas pdf. This layout presents information on problem administration kpi dashboard with bugs status. It is also available for immediate download and adjustment. So, changes can be made in the color, design, graphics or any other component to create a unique layout.
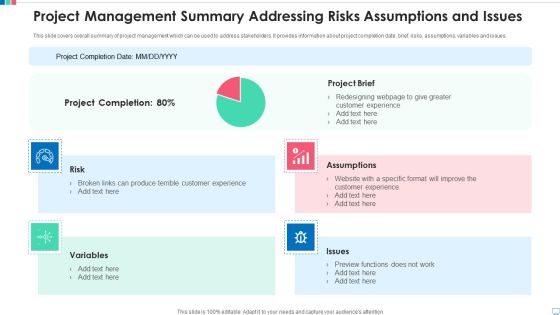
Project Management Summary Addressing Risks Assumptions And Issues Brochure PDF
This slide covers overall summary of project management which can be used to address stakeholders. It provides information about project completion date, brief, risks, assumptions, variables and issues. Pitch your topic with ease and precision using this project management summary addressing risks assumptions and issues brochure pdf. This layout presents information on project brief, assumptions, risk, variables, issues. It is also available for immediate download and adjustment. So, changes can be made in the color, design, graphics or any other component to create a unique layout.

Inbound Marketing Channel KPI Dashboard To Measure Brand Measurement Awareness Pictures PDF
Mentioned slide highlights a inbound marketing dashboard which can be used by managers to measure brand campaign performance. Information covered in this slide is related to total visits, page views, web mentions, social shares, inbound traffic to the company website etc. Pitch your topic with ease and precision using this inbound marketing channel kpi dashboard to measure brand measurement awareness pictures pdf. This layout presents information on inbound marketing channel kpi dashboard to measure brand measurement awareness. It is also available for immediate download and adjustment. So, changes can be made in the color, design, graphics or any other component to create a unique layout.
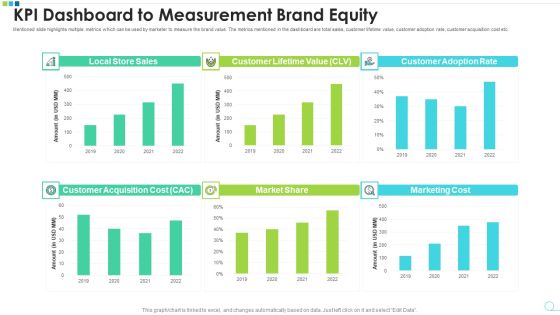
KPI Dashboard To Measurement Brand Equity Microsoft PDF
Mentioned slide highlights multiple metrics which can be used by marketer to measure the brand value. The metrics mentioned in the dashboard are total sales, customer lifetime value, customer adoption rate, customer acquisition cost etc. Pitch your topic with ease and precision using this kpi dashboard to measurement brand equity microsoft pdf. This layout presents information on kpi dashboard to measurement brand equity. It is also available for immediate download and adjustment. So, changes can be made in the color, design, graphics or any other component to create a unique layout.

Measuring Brand Manager Measurement Channel Preferences Using Market Survey Results Professional PDF
Mentioned slide highlights key statistics which can be used for measuring brand manager channel preferences. The statistics mentioned in the slide are email marketing, social media marketing, online ads, print advertisement and trade shows. Pitch your topic with ease and precision using this measuring brand manager measurement channel preferences using market survey results professional pdf. This layout presents information on measuring brand manager measurement channel preferences using market survey results. It is also available for immediate download and adjustment. So, changes can be made in the color, design, graphics or any other component to create a unique layout.
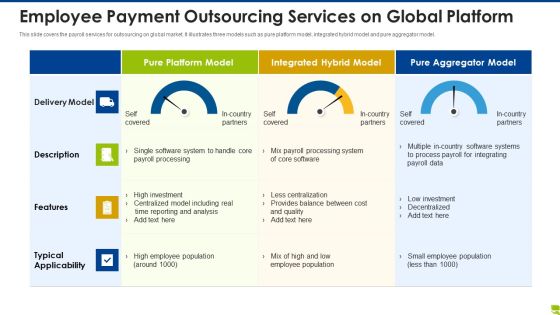
Employee Payment Outsourcing Services On Global Platform Inspiration PDF
This slide covers the payroll services for outsourcing on global market. It illustrates three models such as pure platform model, integrated hybrid model and pure aggregator model. Pitch your topic with ease and precision using this employee payment outsourcing services on global platform inspiration pdf. This layout presents information on employee payment outsourcing services on global platform. It is also available for immediate download and adjustment. So, changes can be made in the color, design, graphics or any other component to create a unique layout.
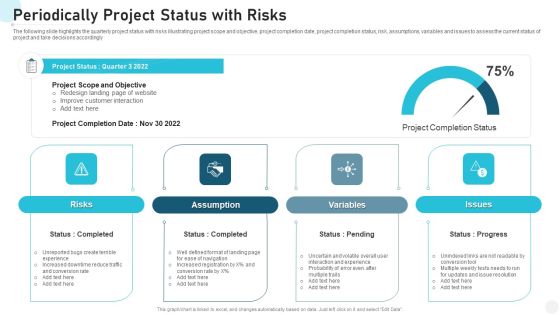
Periodically Project Status With Risks Designs PDF
The following slide highlights the quarterly project status with risks illustrating project scope and objective, project completion date, project completion status, risk, assumptions, variables and issues to assess the current status of project and take decisions accordingly Pitch your topic with ease and precision using this periodically project status with risks designs pdf. This layout presents information on risks, assumption, variables, issues. It is also available for immediate download and adjustment. So, changes can be made in the color, design, graphics or any other component to create a unique layout.

Statistics Indicating Risk Assessment Approaches Followed In Supply Chain Supplier Designs PDF
This slide. Delineates statistics indicating risk assessment approaches followed in supply chain procurement. It contains details such as initiating, standard processes, site inspection, supplier feedback, etc. Pitch your topic with ease and precision using this statistics indicating risk assessment approaches followed in supply chain supplier designs pdf. This layout presents information on key takeaways, approaches, respondents. It is also available for immediate download and adjustment. So, changes can be made in the color, design, graphics or any other component to create a unique layout.
Supplier Compensation Due Tracking Dashboard With Paid Invoices Topics PDF
This slide showcases dashboard that can help organization to track the outstanding payment of different vendors and take timely action in case of delay. Its key elements are due by age summary, top 5 vendor by purchases, top 5 vendors by amount due and total invoice vs paid invoices. Pitch your topic with ease and precision using this supplier compensation due tracking dashboard with paid invoices topics pdf. This layout presents information on supplier compensation due tracking dashboard with paid invoices. It is also available for immediate download and adjustment. So, changes can be made in the color, design, graphics or any other component to create a unique layout.

Revenue Analysis KPI Dashboard Post Building Marketing Strategy Infographics PDF
Following slide outlines a revenue analysis dashboard showcasing the business results after implementing marketing strategy. It provides information about total revenue for the month, revenue for year to date, revenue trend, product revenue and services revenue etc. Pitch your topic with ease and precision using this revenue analysis kpi dashboard post building marketing strategy infographics pdf. This layout presents information on revenue analysis kpi dashboard post building marketing strategy. It is also available for immediate download and adjustment. So, changes can be made in the color, design, graphics or any other component to create a unique layout.

Application Sources For Recruitment On Social Media Tracking Dashboard Microsoft PDF
This slide covers the dashboard for tracking the count of applicants profiles from various sources. It includes the open positions, new roles, total roles, candidates placed , application sources, client decline rates and commission received. Pitch your topic with ease and precision using this application sources for recruitment on social media tracking dashboard microsoft pdf. This layout presents information on application sources for recruitment on social media tracking dashboard. It is also available for immediate download and adjustment. So, changes can be made in the color, design, graphics or any other component to create a unique layout.

Social Media Platforms Used By Recruitment Managers For Hiring Summary PDF
This slide depicts the various social networking sites for both jobs and job candidates. It includes Facebook, LinkedIn, Instagram , twitter and Google plus. Pitch your topic with ease and precision using this social media platforms used by recruitment managers for hiring summary pdf. This layout presents information on social media platforms used by recruitment managers for hiring. It is also available for immediate download and adjustment. So, changes can be made in the color, design, graphics or any other component to create a unique layout.

Dashboard For Tracking Logistics Management Strategy Results Ideas PDF
This slide covers a dashboard for tracking the logistics operations KPIs. It includes metrics such as warehousing operating cost, perfect order rate, total shipments by areas, on time shipments, etc. Pitch your topic with ease and precision using this dashboard for tracking logistics management strategy results ideas pdf. This layout presents information on cost, warehouse, rate. It is also available for immediate download and adjustment. So, changes can be made in the color, design, graphics or any other component to create a unique layout.

Dashboard Of Digital Advertisement Data Mining Professional PDF
The following slide highlights the dashboard of digital advertisement data profiling illustrating key headings which includes campaign name, period, ads spend results, ads generating actions, ad conversion and cost and campaign performance. Pitch your topic with ease and precision using this dashboard of digital advertisement data mining professional pdf . This layout presents information on dashboard of digital advertisement data mining . It is also available for immediate download and adjustment. So, changes can be made in the color, design, graphics or any other component to create a unique layout.

Cyber Risk Dashboard With Current Risks And Security Service Formats PDF
The following slide focuses on the cyber threat dashboard which highlights current threats, current risks, regulation and policy coverage, security service and asset control issues. Pitch your topic with ease and precision using this cyber risk dashboard with current risks and security service formats pdf. This layout presents information on current threats, current risks, regulation and policy coverage. It is also available for immediate download and adjustment. So, changes can be made in the color, design, graphics or any other component to create a unique layout.

Flowchart Of Customer Journey With Painpoints Mapping Download PDF
This slide illustrates flowchart of customer journey with painpoints mapping beneficial for marketers to redesign customer experience in shopping. It contains information about customer, search, discovery, purchase, positive experience and painpoints. Pitch your topic with ease and precision using this flowchart of customer journey with painpoints mapping download pdf. This layout presents information on flowchart of customer journey with painpoints mapping. It is also available for immediate download and adjustment. So, changes can be made in the color, design, graphics or any other component to create a unique layout.
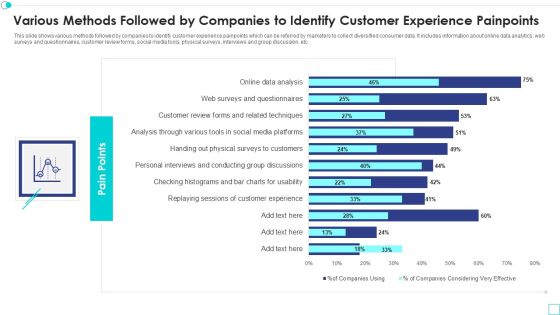
Various Methods Followed By Companies To Identify Customer Experience Painpoints Designs PDF
This slide shows various methods followed by companies to identify customer experience painpoints which can be referred by marketers to collect diversified consumer data. It includes information about online data analytics, web surveys and questionnaires, customer review forms, social media tools, physical surveys, interviews and group discussion, etc. Pitch your topic with ease and precision using this various methods followed by companies to identify customer experience painpoints designs pdf. This layout presents information on various methods followed by companies to identify customer experience painpoints. It is also available for immediate download and adjustment. So, changes can be made in the color, design, graphics or any other component to create a unique layout.
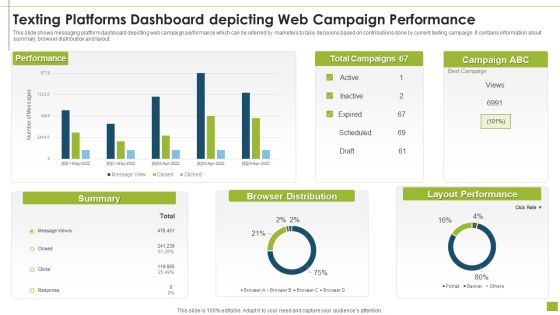
Texting Platforms Dashboard Depicting Web Campaign Performance Pictures PDF
This slide shows messaging platform dashboard depicting web campaign performance which can be referred by marketers to take decisions based on contributions done by current texting campaign. It contains information about summary, browser distribution and layout.Pitch your topic with ease and precision using this texting platforms dashboard depicting web campaign performance pictures pdf This layout presents information on browser distribution, layout performance, summary It is also available for immediate download and adjustment. So, changes can be made in the color, design, graphics or any other component to create a unique layout.
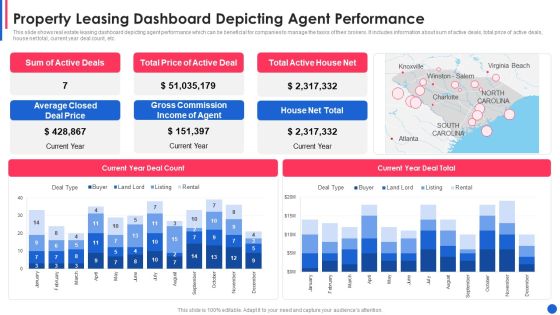
Property Leasing Dashboard Depicting Agent Performance Guidelines PDF
This slide shows real estate leasing dashboard depicting agent performance which can be beneficial for companies to manage the tasks of their brokers. It includes information about sum of active deals, total price of active deals, house net total, current year deal count, etc.Pitch your topic with ease and precision using this property leasing dashboard depicting agent performance guidelines pdf This layout presents information on average closed deal price, gross commission income, total active house net It is also available for immediate download and adjustment. So, changes can be made in the color, design, graphics or any other component to create a unique layout.

Real Estate Property Management Dashboard With Leasing Status Graphics PDF
This slide shows real estate property management dashboard with leasing status which can be referred by companies to have an overview about their performance. It includes information about revenue, properties, recent tasks, expired leases, outstanding balances, etc.Pitch your topic with ease and precision using this real estate property management dashboard with leasing status graphics pdf This layout presents information on property revenue overview, leases which are expiring, recent tasks It is also available for immediate download and adjustment. So, changes can be made in the color, design, graphics or any other component to create a unique layout.
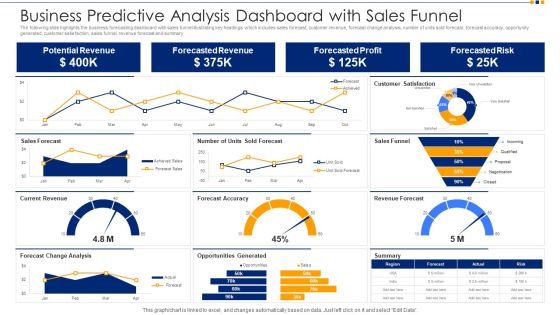
Business Predictive Analysis Dashboard With Sales Funnel Ppt Show Images PDF
The following slide highlights the business forecasting dashboard with sales funnel illustrating key headings which includes sales forecast, customer revenue, forecast change analysis, number of units sold forecast, forecast accuracy, opportunity generated, customer satisfaction, sales funnel, revenue forecast and summary. Pitch your topic with ease and precision using this business predictive analysis dashboard with sales funnel ppt show images pdf. This layout presents information on potential revenue, forecasted revenue, forecasted profit, forecasted risk. It is also available for immediate download and adjustment. So, changes can be made in the color, design, graphics or any other component to create a unique layout.

Business Revenue And Sales Predictive Dashboard Ppt Inspiration Background Designs PDF
The following slide highlights the business and sales forecasting dashboard illustrating key headings which includes revenue forecast by type, unit sold forecast, forecasting accuracy, sales by type, average sales price trend and revenue trend. Pitch your topic with ease and precision using this business revenue and sales predictive dashboard ppt inspiration background designs pdf. This layout presents information on revenue forecast by type, units sold forecast, forecasting accuracy, average sales price trend, revenue trend. It is also available for immediate download and adjustment. So, changes can be made in the color, design, graphics or any other component to create a unique layout.

Digital Marketing Project Administration And Employee Performance Guidelines PDF
Statistics presented in the following slide showcase project coordination and employees performance in marketing campaign. It is based on following tasks SEO, SCO, Email Campaign and Blog writing. Pitch your topic with ease and precision using this digital marketing project administration and employee performance guidelines pdf. This layout presents information on digital marketing project administration and employee performance. It is also available for immediate download and adjustment. So, changes can be made in the color, design, graphics or any other component to create a unique layout.

Dashboard Of Project Risk Evaluation With Risk Rating Pictures PDF
The slide highlights the dashboard of project risk assessment with risk rating illustrating total risks, open risk, improving, closed risk, mitigated risk, residual risk, risk rating, inherent risk, control risk and impact probability matrixPitch your topic with ease and precision using this dashboard of project risk evaluation with risk rating pictures pdf This layout presents information on dashboard of project risk evaluation with risk rating It is also available for immediate download and adjustment. So, changes can be made in the color, design, graphics or any other component to create a unique layout.

Retail Outlet Dashboard With Sales Kpis Clipart PDF
This slide covers a metrics dashboard for tracking retail store sales. It includes KPIs such as sales square foot per location, net profit, revues, shrinkage, customer retention rate, etc. Pitch your topic with ease and precision using this retail outlet dashboard with sales kpis clipart pdf This layout presents information on Retail outlet dashboard with sales kpis It is also available for immediate download and adjustment. So, changes can be made in the color, design, graphics or any other component to create a unique layout.

Automobile OEM Report With Forecasted Growth Rate Ppt PowerPoint Presentation File Background Images PDF
This slide showcases report that can help automobile companies to identify the growth rate of aftermarket area. It also showcases incremental growth and growth to be contributed by online channels. Pitch your topic with ease and precision using this automobile oem report with forecasted growth rate ppt powerpoint presentation file background images pdf. This layout presents information on incremental growth, billion dollars, growth, offline segment, market impact, expected growth in 2022. It is also available for immediate download and adjustment. So, changes can be made in the color, design, graphics or any other component to create a unique layout.
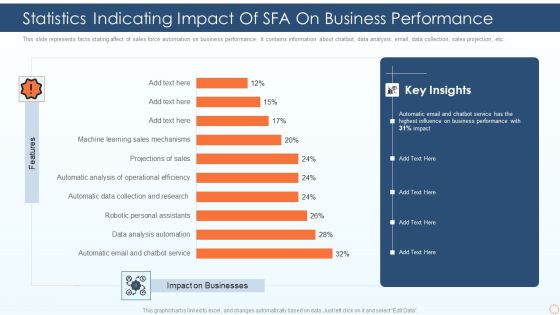
Statistics Indicating Impact Of SFA On Business Performance Ppt PowerPoint Presentation Gallery Outfit PDF
This slide represents facts stating affect of sales force automation on business performance. It contains information about chatbot, data analysis, email, data collection, sales projection, etc. Pitch your topic with ease and precision using this statistics indicating impact of sfa on business performance ppt powerpoint presentation gallery outfit pdf. This layout presents information on automatic email and chatbot service, data analysis automation, robotic personal assistants. It is also available for immediate download and adjustment. So, changes can be made in the color, design, graphics or any other component to create a unique layout.
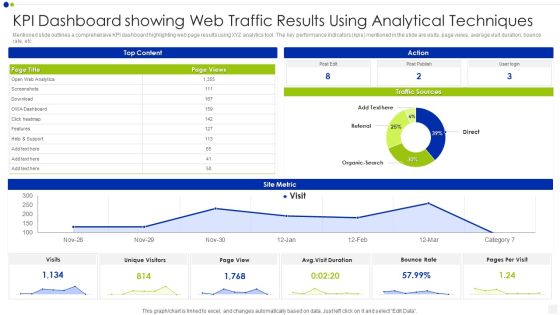
KPI Dashboard Showing Web Traffic Results Using Analytical Techniques Inspiration PDF
Mentioned slide outlines a comprehensive KPI dashboard highlighting web page results using XYZ analytics tool. The key performance indicators kpis mentioned in the slide are visits, page views, average visit duration, bounce rate, etc. Pitch your topic with ease and precision using this kpi dashboard showing web traffic results using analytical techniques inspiration pdf. This layout presents information on bounce rate, traffic sources, analytics. It is also available for immediate download and adjustment. So, changes can be made in the color, design, graphics or any other component to create a unique layout.

Cyber Phishing Scams And Attacks Dashboard With Improvement Curve Sample PDF
Mentioned slide showcases a comprehensive dashboard used to measure the cyber phishing attacks. Information covered in this slide is related to organization health risk, attack vendors, most vulnerable employees to attacks, improvement curve. Pitch your topic with ease and precision using this cyber phishing scams and attacks dashboard with improvement curve sample pdf. This layout presents information on cyber phishing scams and attacks dashboard with improvement curve. It is also available for immediate download and adjustment. So, changes can be made in the color, design, graphics or any other component to create a unique layout.

Major Statistics Of Cyber Phishing Scams And Attacks Designs PDF
Mentioned slide showcases key facts of cyber phishing attack. The facts covered in the slide are loss of confidential data, compromised accounts, ransomware attacks, financial loss and other malware attacks such as trojans. Pitch your topic with ease and precision using this major statistics of cyber phishing scams and attacks designs pdf. This layout presents information on major statistics of cyber phishing scams and attacks. It is also available for immediate download and adjustment. So, changes can be made in the color, design, graphics or any other component to create a unique layout.

Statistics Indicating Future Demand For Digital Insurance Technologies Brochure PDF
This slide illustrates data indicating future demand for insurtech digital technology. It provides information about data analytics, cloud technology, internal blockchain application, artificial intelligence, etc. Pitch your topic with ease and precision using this Statistics Indicating Future Demand For Digital Insurance Technologies Brochure PDF. This layout presents information on Data Analytics, Cloud Technology, Internal Blockchain Application. It is also available for immediate download and adjustment. So, changes can be made in the color, design, graphics or any other component to create a unique layout.
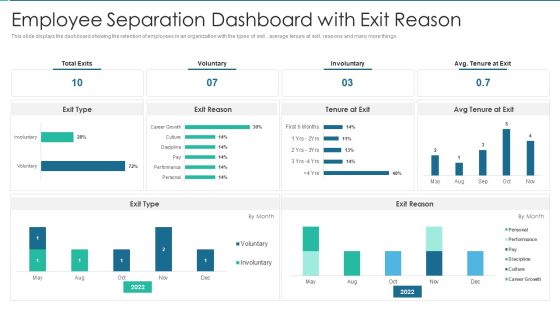
Employee Separation Dashboard With Exit Reason Rules PDF
This slide displays the dashboard showing the retention of employees in an organization with the types of exit , average tenure at exit, reasons and many more things. Pitch your topic with ease and precision using this Employee Separation Dashboard With Exit Reason Rules PDF This layout presents information on Employee Separation Dashboard With Exit Reason It is also available for immediate download and adjustment. So, changes can be made in the color, design, graphics or any other component to create a unique layout.
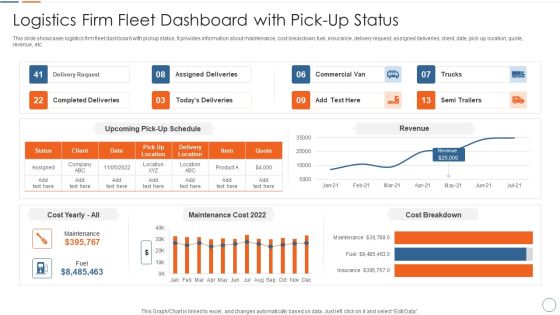
Logistics Firm Fleet Dashboard With Pick Up Status Introduction PDF
This slide showcases logistics firm fleet dashboard with pickup status. It provides information about maintenance, cost breakdown, fuel, insurance, delivery request, assigned deliveries, client, date, pick up location, quote, revenue, etc. Pitch your topic with ease and precision using this Logistics Firm Fleet Dashboard With Pick Up Status Introduction PDF. This layout presents information on Logistics Firm Fleet Dashboard With Pick Up Status. It is also available for immediate download and adjustment. So, changes can be made in the color, design, graphics or any other component to create a unique layout.

 Home
Home