Comparison Chart
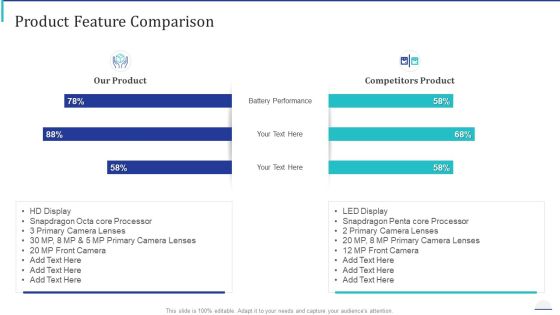
How Make Impactful Product Marketing Message Build Product Differentiation Product Feature Comparison Background PDF
Deliver an awe inspiring pitch with this creative how make impactful product marketing message build product differentiation product feature comparison background pdf bundle. Topics like our product, competitors product can be discussed with this completely editable template. It is available for immediate download depending on the needs and requirements of the user.

Ppt Comparison Swim Lane Diagram PowerPoint Template Of 4 State Templates
PPT comparison swim lane diagram powerpoint template of 4 state Templates-This image has been professionally designed to emphasize the concept of business strategy. Use this Swim Lane Diagram to map and improve the processes between departments and teams in your organization. This template is carefully considered and implemented with objectives of beauty, consistency, clarity, and most important, audience impact. Our template will make your presentation look impressive and stunning.-PPT comparison swim lane diagram powerpoint template of 4 state Templates-3d, Balance, Ball, Best, Board, Business, Clipart, Color, Compare, Comparison, Concept, Graphic, Heavy, Illustration, Isolated, Level, Nobody, Opposite, Orange, Parity, Render, Rendered, Reverse, Scale, Simple, Sphere

Downturn Graph Showing Company Comparison Ppt PowerPoint Presentation Professional Graphics Design PDF
Pitch your topic with ease and precision using this downturn graph showing company comparison ppt powerpoint presentation professional graphics design pdf. This layout presents information on company growth rate, red bull, pepsi. It is also available for immediate download and adjustment. So, changes can be made in the color, design, graphics or any other component to create a unique layout.

Sales And Promotion Playbook Competitive Analysis Overall Performance Comparison Infographics PDF
Deliver and pitch your topic in the best possible manner with this sales and promotion playbook competitive analysis overall performance comparison infographics pdf. Use them to share invaluable insights on product offering, business model, services and impress your audience. This template can be altered and modified as per your expectations. So, grab it now.

Private Capital Scorecard Private Equity Comparison Scorecard For Evaluating Background PDF
Deliver an awe inspiring pitch with this creative Private Capital Scorecard Private Equity Comparison Scorecard For Evaluating Background PDF bundle. Topics like Equities, Corporates, Convertibles can be discussed with this completely editable template. It is available for immediate download depending on the needs and requirements of the user.
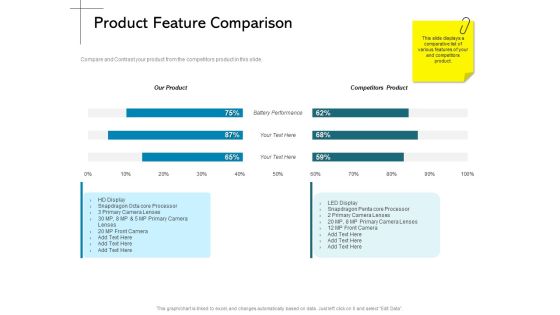
New Product Introduction In The Market Product Feature Comparison Ppt PowerPoint Presentation Summary Background Image PDF
Presenting this set of slides with name new product introduction in the market product feature comparison ppt powerpoint presentation summary background image pdf. The topics discussed in these slides are our product, competitors product, battery performance. This is a completely editable PowerPoint presentation and is available for immediate download. Download now and impress your audience.
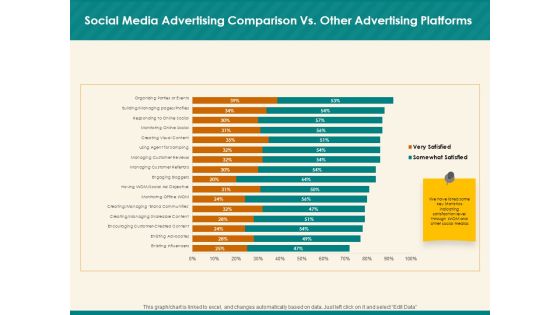
Social Media Marketing Budget Social Media Advertising Comparison Vs Other Advertising Ppt Show Diagrams PDF
Presenting this set of slides with name social media marketing budget social media advertising comparison vs other advertising ppt show diagrams pdf. The topics discussed in these slides are very satisfied, somewhat satisfied. This is a completely editable PowerPoint presentation and is available for immediate download. Download now and impress your audience.

Four Cities Sales Comparison Report Ppt PowerPoint Presentation Pictures Mockup PDF
Pitch your topic with ease and precision using this four cities sales comparison report ppt powerpoint presentation pictures mockup pdf. This layout presents information on sales, year 2020. It is also available for immediate download and adjustment. So, changes can be made in the color, design, graphics or any other component to create a unique layout.
Gross And Net Revenue Comparison Shown By Graph Ppt PowerPoint Presentation File Icons PDF
Presenting this set of slides with name gross and net revenue comparison shown by graph ppt powerpoint presentation file icons pdf. The topics discussed in these slides are gross profit, net profit. This is a completely editable PowerPoint presentation and is available for immediate download. Download now and impress your audience.
Target Vs Actual Sales Comparison Dashboard Ppt PowerPoint Presentation File Icons PDF
Presenting this set of slides with name target vs actual sales comparison dashboard ppt powerpoint presentation file icons pdf. The topics discussed in these slides are sales amount, avg commission rate, total commissions, total deductions, commission payable, top sales manager, top sales person. This is a completely editable PowerPoint presentation and is available for immediate download. Download now and impress your audience.

COVID 19 Pandemic Disease Covid 19 Contagiousness In Comparison To Other Pandemics Introduction PDF
Presenting this set of slides with name covid 19 pandemic disease covid 19 contagiousness in comparison to other pandemics introduction pdf. The topics discussed in these slides are norovirus, pneumonia, rotavirus, seasonal flu, cholera, meningitis, swine flu h1n1, covid 19 coronavirus, sars, mers, measles, chickenpox. This is a completely editable PowerPoint presentation and is available for immediate download. Download now and impress your audience.

Investment Pitch For Aftermarket Revenue And Expenses Comparison Historical And Projection Portrait
Presenting this set of slides with name investment pitch for aftermarket revenue and expenses comparison historical and projection portrait. The topics discussed in these slides are financials, historical, forecasted, revenue, operating expenses. This is a completely editable PowerPoint presentation and is available for immediate download. Download now and impress your audience.

Actual Vs Budgeted Gross And Net Revenue Comparison Report Sample PDF
This slide covers a profitability dashboard for analyzing gross margin and net profit metrics. It includes evaluation charts such as actual vs budgeted gross profit, net profit, trends, variance analysis table for the selected month and year. Pitch your topic with ease and precision using this Actual Vs Budgeted Gross And Net Revenue Comparison Report Sample PDF. This layout presents information on Gross Profit, Net Profit, Budget. It is also available for immediate download and adjustment. So, changes can be made in the color, design, graphics or any other component to create a unique layout.
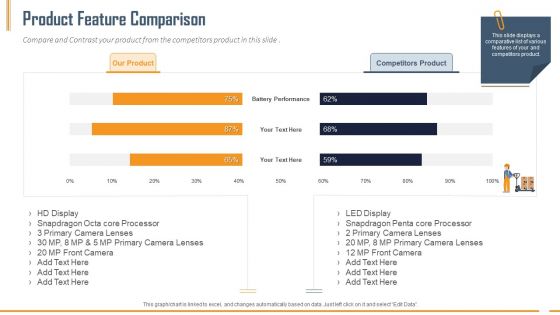
Building Innovation Capabilities And USP Detection Product Feature Comparison Ppt Infographic Template Template PDF
Compare and Contrast your product from the competitors product in this slide. Deliver an awe-inspiring pitch with this creative building innovation capabilities and usp detection product feature comparison ppt infographic template template pdf bundle. Topics like our product, competitors product, battery performance can be discussed with this completely editable template. It is available for immediate download depending on the needs and requirements of the user.
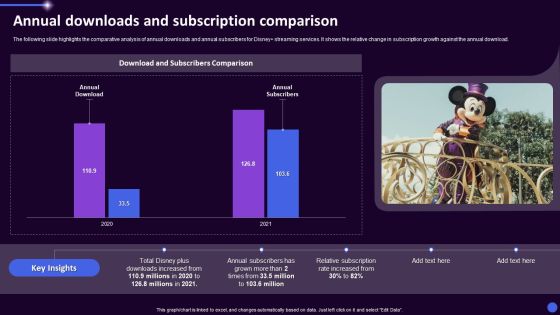
Disney Plus OTT Platform Company Summary Annual Downloads And Subscription Comparison Summary PDF
The following slide highlights the comparative analysis of annual downloads and annual subscribers for Disney streaming services. It shows the relative change in subscription growth against the annual download. Deliver an awe inspiring pitch with this creative Disney Plus OTT Platform Company Summary Annual Downloads And Subscription Comparison Summary PDF bundle. Topics like Download and Subscribers, Annual Subscribers, Annual Download can be discussed with this completely editable template. It is available for immediate download depending on the needs and requirements of the user.
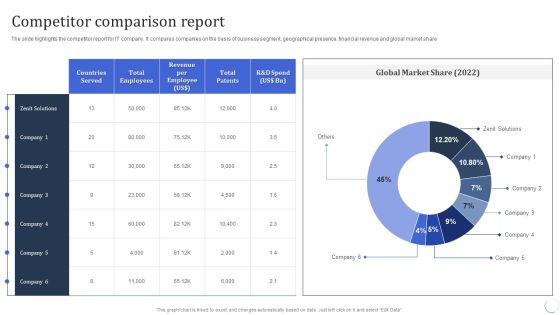
Infotech Solutions Research And Development Company Summary Competitor Comparison Report Slides PDF
The slide highlights the competitor report for IT company. It compares companies on the basis of business segment, geographical presence, financial revenue and global market share. Deliver an awe inspiring pitch with this creative Infotech Solutions Research And Development Company Summary Competitor Comparison Report Slides PDF bundle. Topics like Revenue Per Employee, Global Market Share, Countries Served can be discussed with this completely editable template. It is available for immediate download depending on the needs and requirements of the user.

Promotion Techniques Used By B2B Firms Comparison Of Budgeted And Actual Expenses Infographics PDF
The slides shows graphical comparison of companys planned and actual promotional expenses. Further, it shows the graph of budget deviation by month. Do you know about Slidesgeeks Promotion Techniques Used By B2B Firms Comparison Of Budgeted And Actual Expenses Infographics PDF These are perfect for delivering any kind od presentation. Using it, create PowerPoint presentations that communicate your ideas and engage audiences. Save time and effort by using our pre designed presentation templates that are perfect for a wide range of topic. Our vast selection of designs covers a range of styles, from creative to business, and are all highly customizable and easy to edit. Download as a PowerPoint template or use them as Google Slides themes.
Revenue And Expenses Comparison Historical And Projection Ppt Icon Files PDF
The slide provides the comparative graph of companys revenue and expenses for last 5 years historical and coming 4 years forecasted.Deliver and pitch your topic in the best possible manner with this revenue and expenses comparison historical and projection ppt icon files pdf. Use them to share invaluable insights on financials, 2016 to 2025, revenue, operating expenses and impress your audience. This template can be altered and modified as per your expectations. So, grab it now.

Bidding Cost Comparison Bidder Company Financials Ppt Infographic Template Information PDF
Following slide provides financial details of company including revenue, operating profit and cash flow from operating activities. Deliver an awe inspiring pitch with this creative Bidding Cost Comparison Bidder Company Financials Ppt Infographic Template Information PDF bundle. Topics like revenue, operating profit, cash flow from operating activities can be discussed with this completely editable template. It is available for immediate download depending on the needs and requirements of the user.

Revenue And Expenses Comparison Historical And Projection Ppt Ideas Slide Download PDF
The slide provides the comparative graph of companys revenue and expenses for last 5 years historical and coming 4 years forecasted. Deliver an awe-inspiring pitch with this creative revenue and expenses comparison historical and projection ppt ideas slide download pdf bundle. Topics like revenue, operating expenses, historical, forecasted can be discussed with this completely editable template. It is available for immediate download depending on the needs and requirements of the user.

Revenue And Expenses Comparison Historical And Projection Ppt Show Format PDF
The slide provides the comparative graph of companys revenue and expenses for last 5 years historical and coming 4 years forecasted. Deliver an awe-inspiring pitch with this creative revenue and expenses comparison historical and projection ppt show format pdf bundle. Topics like historical, forecasted, financials can be discussed with this completely editable template. It is available for immediate download depending on the needs and requirements of the user.
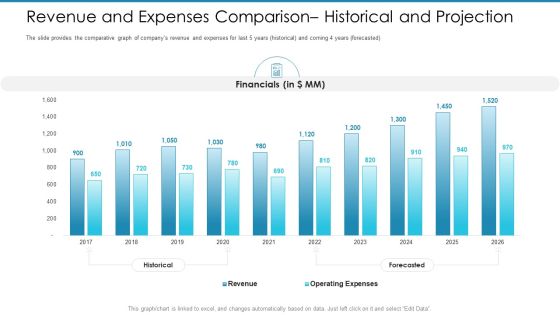
Post Initial Pubic Offering Market Pitch Deck Revenue And Expenses Comparison Historical And Projection Sample PDF
The slide provides the comparative graph of companys revenue and expenses for last 5 years historical and coming 4 years forecasted.Deliver an awe-inspiring pitch with this creative post initial pubic offering market pitch deck revenue and expenses comparison historical and projection sample pdf. bundle. Topics like financials, 2017 to 2026 can be discussed with this completely editable template. It is available for immediate download depending on the needs and requirements of the user.
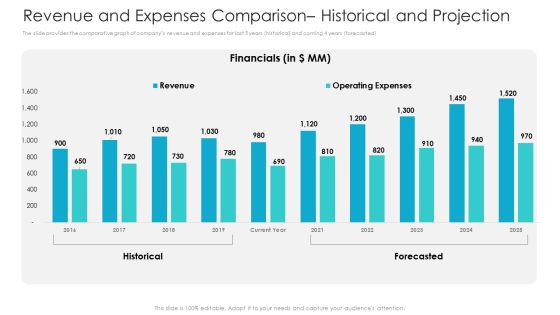
Private Equity Fundraising Pitch Deck Revenue And Expenses Comparison Historical And Projection Clipart PDF
The slide provides the comparative graph of companys revenue and expenses for last 5 years historical and coming 4 years forecasted. Deliver and pitch your topic in the best possible manner with this private equity fundraising pitch deck revenue and expenses comparison historical and projection clipart pdf. Use them to share invaluable insights on financials, revenue, operating expenses, 2016 to 2025 and impress your audience. This template can be altered and modified as per your expectations. So, grab it now.
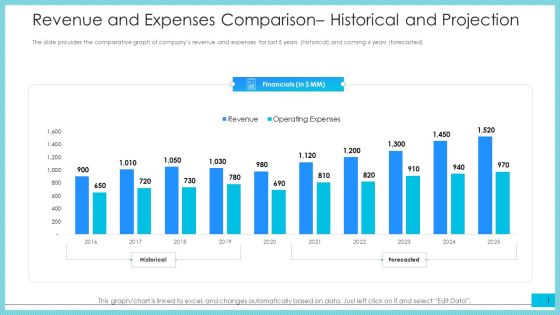
Revenue And Expenses Comparison Historical And Projection Ppt Summary Example Introduction PDF
The slide provides the comparative graph of companys revenue and expenses for last 5 years historical and coming 4 years forecasted.Deliver and pitch your topic in the best possible manner with this revenue and expenses comparison historical and projection ppt summary example introduction pdf. Use them to share invaluable insights on financials, 2016 to 2025, revenue, operating expenses and impress your audience. This template can be altered and modified as per your expectations. So, grab it now.
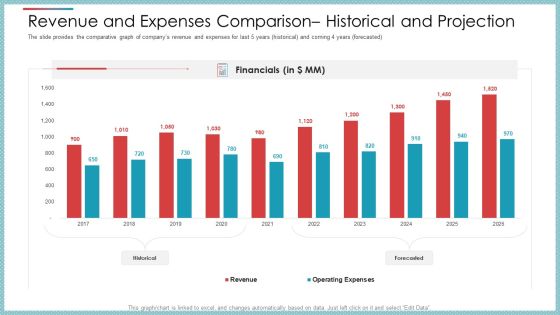
Revenue And Expenses Comparison Historical And Projection Ppt Styles Graphics Design PDF
The slide provides the comparative graph of companys revenue and expenses for last 5 years historical and coming 4 years forecasted.Deliver an awe-inspiring pitch with this creative revenue and expenses comparison historical and projection ppt styles graphics design pdf. bundle. Topics like financials, 2016 to 2025, revenue, operating expenses can be discussed with this completely editable template. It is available for immediate download depending on the needs and requirements of the user.

Revenue And Expenses Comparison Historical And Projection Ppt Show Slide Download PDF
The slide provides the comparative graph of companys revenue and expenses for last 5 years historical and coming 4 years forecasted.Deliver and pitch your topic in the best possible manner with this revenue and expenses comparison historical and projection ppt show slide download pdf. Use them to share invaluable insights on financials, 2016 to 2025, revenue, operating expenses and impress your audience. This template can be altered and modified as per your expectations. So, grab it now.

Funding Pitch To Raise Funds From PE Revenue And Expenses Comparison Historical And Projection Summary PDF
The slide provides the comparative graph of companys revenue and expenses for last 5 years historical and coming 4 years forecasted. Deliver an awe inspiring pitch with this creative funding pitch to raise funds from pe revenue and expenses comparison historical and projection summary pdf bundle. Topics like financials, historical, forecasted, revenue, expenses can be discussed with this completely editable template. It is available for immediate download depending on the needs and requirements of the user.

Cash Market Investor Deck Revenue And Expenses Comparison Historical And Projection Ppt Professional Information PDF
The slide provides the comparative graph of companys revenue and expenses for last 5 years historical and coming 4 years forecasted. Deliver and pitch your topic in the best possible manner with this cash market investor deck revenue and expenses comparison historical and projection ppt professional information pdf. Use them to share invaluable insights on financials, revenue, operating expenses, 2016 to 2025 and impress your audience. This template can be altered and modified as per your expectations. So, grab it now.
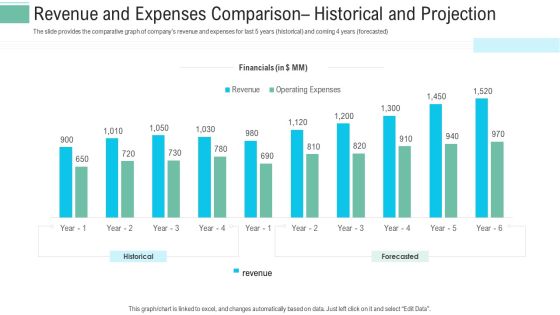
Revenue And Expenses Comparison Historical And Projection Ppt Layouts Grid PDF
The slide provides the comparative graph of companys revenue and expenses for last 5 years historical and coming 4 years forecasted. Deliver and pitch your topic in the best possible manner with this revenue and expenses comparison historical and projection ppt layouts grid pdf. Use them to share invaluable insights on financials, operating expenses, revenue and impress your audience. This template can be altered and modified as per your expectations. So, grab it now.

Investment Fundraising Pitch Deck From Stock Market Revenue And Expenses Comparison Historical And Projection Infographics PDF
The slide provides the comparative graph of companys revenue and expenses for last 5 years historical and coming 4 years forecasted. Deliver an awe inspiring pitch with this creative investment fundraising pitch deck from stock market revenue and expenses comparison historical and projection infographics pdf bundle. Topics like financials, historical, forecasted, revenue, expenses can be discussed with this completely editable template. It is available for immediate download depending on the needs and requirements of the user.

Budget Comparison With Actual Costs Table Ppt PowerPoint Presentation Infographic Template Graphics Pictures PDF
This slide illustrates tabular representation of budget costs and actual costs of a company. It includes account title, actual costs, budget and remaining sum.Showcasing this set of slides titled Budget Comparison With Actual Costs Table Ppt PowerPoint Presentation Infographic Template Graphics Pictures PDF. The topics addressed in these templates are Office Equipment, Client Expenses, Server Costs. All the content presented in this PPT design is completely editable. Download it and make adjustments in color, background, font etc. as per your unique business setting.
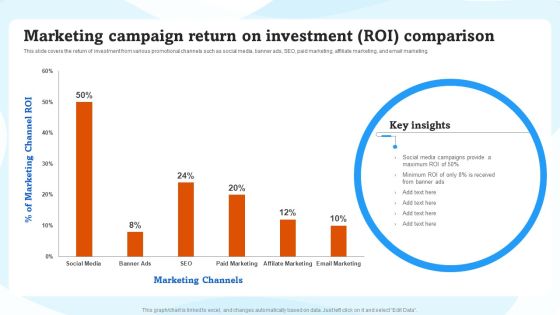
Marketing Campaign Return On Investment ROI Comparison Ppt Inspiration Background PDF
This slide covers the return of investment from various promotional channels such as social media, banner ads, SEO, paid marketing, affiliate marketing, and email marketing. This Marketing Campaign Return On Investment ROI Comparison Ppt Inspiration Background PDF is perfect for any presentation, be it in front of clients or colleagues. It is a versatile and stylish solution for organizing your meetings. The Marketing Campaign Return On Investment ROI Comparison Ppt Inspiration Background PDF features a modern design for your presentation meetings. The adjustable and customizable slides provide unlimited possibilities for acing up your presentation. Slidegeeks has done all the homework before launching the product for you. So, do not wait, grab the presentation templates today

Product Awareness Strategies To Raise Demand Comparison Of Budgeted And Actual Expenses Slides PDF
The slides shows graphical comparison of companys planned and actual promotional expenses. Further, it shows the graph of budget deviation by month. This Product Awareness Strategies To Raise Demand Comparison Of Budgeted And Actual Expenses Slides PDF from Slidegeeks makes it easy to present information on your topic with precision. It provides customization options, so you can make changes to the colors, design, graphics, or any other component to create a unique layout. It is also available for immediate download, so you can begin using it right away. Slidegeeks has done good research to ensure that you have everything you need to make your presentation stand out. Make a name out there for a brilliant performance.

Corporate Budget Comparison Of FY21 And FY22 Ppt PowerPoint Presentation Icon Graphic Images PDF
This slide illustrates graphical representation of budget of two years. It includes administration budget, production budget, research budget, client expenses etc.Showcasing this set of slides titled Corporate Budget Comparison Of FY21 And FY22 Ppt PowerPoint Presentation Icon Graphic Images PDF. The topics addressed in these templates are Support Services, Administration, Maintenance Cost. All the content presented in this PPT design is completely editable. Download it and make adjustments in color, background, font etc. as per your unique business setting.

Quarterly Comparison Of Staff Productivity Enhancement Ppt PowerPoint Presentation Ideas Aids PDF
This slide shows the employees average productivity graph working in the organization. A sudden decline has been observed in employee productivity in Q3. Showcasing this set of slides titled Quarterly Comparison Of Staff Productivity Enhancement Ppt PowerPoint Presentation Ideas Aids PDF. The topics addressed in these templates are Employee Productivity, Sudden Decline, Workplace Stress. All the content presented in this PPT design is completely editable. Download it and make adjustments in color, background, font etc. as per your unique business setting.
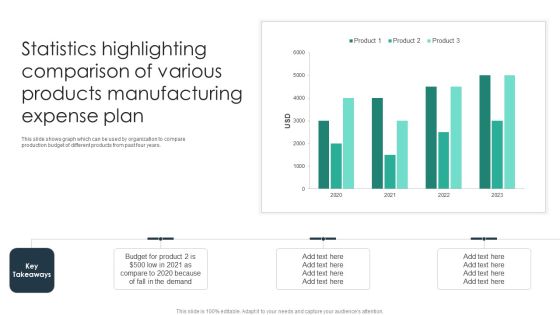
Statistics Highlighting Comparison Of Various Products Manufacturing Expense Plan Formats PDF
This slide shows graph which can be used by organization to compare production budget of different products from past four years. Pitch your topic with ease and precision using this Statistics Highlighting Comparison Of Various Products Manufacturing Expense Plan Formats PDF. This layout presents information on Budget For Product, Demand, Organization. It is also available for immediate download and adjustment. So, changes can be made in the color, design, graphics or any other component to create a unique layout.

Budget Vs Actual Cost Comparison Dashboard Ppt PowerPoint Presentation Professional Format Ideas PDF
This slide illustrates fact and figures relating to various project budgets of a company. It includes monthly budget graph, project budget meter and budget vs. Actual costs chart.Pitch your topic with ease and precision using this Budget Vs Actual Cost Comparison Dashboard Ppt PowerPoint Presentation Professional Format Ideas PDF. This layout presents information on Milestones, Budget Graph, Manager. It is also available for immediate download and adjustment. So, changes can be made in the color, design, graphics or any other component to create a unique layout.

Over The Top Platform Company Profile Annual Downloads And Subscription Comparison Infographics PDF
The following slide highlights the comparative analysis of annual downloads and annual subscribers for Disney streaming services. It shows the relative change in subscription growth against the annual download. Find a pre designed and impeccable Over The Top Platform Company Profile Annual Downloads And Subscription Comparison Infographics PDF. The templates can ace your presentation without additional effort. You can download these easy to edit presentation templates to make your presentation stand out from others. So, what are you waiting for Download the template from Slidegeeks today and give a unique touch to your presentation.

Competitor Comparison Life Science And Healthcare Solutions Company Profile Guidelines PDF
The slide showcases the comparative global market share for healthcare company for FY22. It also depicts the market share for global pharmacy, research and hospital business verticals. The best PPT templates are a great way to save time, energy, and resources. Slidegeeks have 100 percent editable powerpoint slides making them incredibly versatile. With these quality presentation templates, you can create a captivating and memorable presentation by combining visually appealing slides and effectively communicating your message. Download Competitor Comparison Life Science And Healthcare Solutions Company Profile Guidelines PDF from Slidegeeks and deliver a wonderful presentation.

Stock Ratio Comparison Of Four Brands Ppt Model Layout Ideas PDF
This slide shows a comparative analysis of Stock ratio of four brands in last five year. Continuous increase has seen in Stock ratio of brand D. Showcasing this set of slides titled Stock Ratio Comparison Of Four Brands Ppt Model Layout Ideas PDF. The topics addressed in these templates are 2018 To 2022, Stock Ratio, Stock Management System. All the content presented in this PPT design is completely editable. Download it and make adjustments in color, background, font etc. as per your unique business setting.

Five Year Comparison Of Registered Mobile Money Customers Spread By Region Introduction PDF
This slide shows the information statistics about region wise registered mobile money customers spread during last 5 years. It indicates that customers spread in south asia recorded highest that is 28.4persent over the last five years.Deliver and pitch your topic in the best possible manner with this Five Year Comparison Of Registered Mobile Money Customers Spread By Region Introduction PDF. Use them to share invaluable insights on Region Recorded, Mobile Money, Customers Spread and impress your audience. This template can be altered and modified as per your expectations. So, grab it now.

Annual Operating Revenue And Total Expenses Comparison Ppt Infographic Template Rules PDF
The slide showcases the operating revenue, total expenses, profit and loss, and cash from operations. It compares all the financial parameters for the financial year 2021 and 2022. Want to ace your presentation in front of a live audience Our Annual Operating Revenue And Total Expenses Comparison Ppt Infographic Template Rules PDF can help you do that by engaging all the users towards you.. Slidegeeks experts have put their efforts and expertise into creating these impeccable powerpoint presentations so that you can communicate your ideas clearly. Moreover, all the templates are customizable, and easy-to-edit and downloadable. Use these for both personal and commercial use.

Statistics Showing Annual Comparison Of Multiple Beauty Care Products Ppt Infographics Objects PDF
This slide contains graph which can be used by cosmetic manufacturing organizations to represent difference between annual sales of various products. It includes products such as skin care, hair care, oral care and others. Showcasing this set of slides titled Statistics Showing Annual Comparison Of Multiple Beauty Care Products Ppt Infographics Objects PDF. The topics addressed in these templates are Skin Care, Hair Care, 2022 To 2023. All the content presented in this PPT design is completely editable. Download it and make adjustments in color, background, font etc. as per your unique business setting.
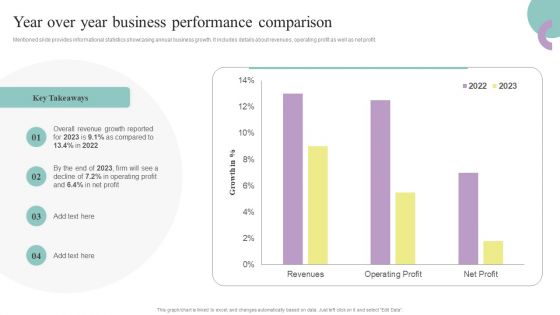
Comprehensive Guide To Enhance Year Over Year Business Performance Comparison Professional PDF
Mentioned slide provides informational statistics showcasing annual business growth. It includes details about revenues, operating profit as well as net profit. From laying roadmaps to briefing everything in detail, our templates are perfect for you. You can set the stage with your presentation slides. All you have to do is download these easy-to-edit and customizable templates. Comprehensive Guide To Enhance Year Over Year Business Performance Comparison Professional PDF will help you deliver an outstanding performance that everyone would remember and praise you for. Do download this presentation today.

Actual And Target Stock Ratio Comparison Ppt Visual Aids Ideas PDF
This slide shows the difference between actual Stock ratio and target in last eight months. No sudden increase or decrease has been observed in turnover ratio through out this time. Showcasing this set of slides titled Actual And Target Stock Ratio Comparison Ppt Visual Aids Ideas PDF. The topics addressed in these templates are Turnover Ratio, Price, 2015 To 2022. All the content presented in this PPT design is completely editable. Download it and make adjustments in color, background, font etc. as per your unique business setting.

Comparison Of Stock Ratio Available In Warehouse Ppt Show Elements PDF
This slide shows the available quantities of various types of Stock in storage house. These inventories are finished goods, raw material, work in progress, MRO, etc. Showcasing this set of slides titled Comparison Of Stock Ratio Available In Warehouse Ppt Show Elements PDF. The topics addressed in these templates are Raw Material, Work Progess, Maintenance, Repair And Operations. All the content presented in this PPT design is completely editable. Download it and make adjustments in color, background, font etc. as per your unique business setting.

Marketing Channels Return On Investment Roi Comparison Strategies For Acquiring Consumers Brochure PDF
This slide covers the return of investment from various promotional channels such as social media, banner ads, SEO, paid marketing, affiliate marketing, and email marketing. Present like a pro with Marketing Channels Return On Investment Roi Comparison Strategies For Acquiring Consumers Brochure PDF Create beautiful presentations together with your team, using our easy-to-use presentation slides. Share your ideas in real-time and make changes on the fly by downloading our templates. So whether you are in the office, on the go, or in a remote location, you can stay in sync with your team and present your ideas with confidence. With Slidegeeks presentation got a whole lot easier. Grab these presentations today.

Comparison Of Average Duration Of Stay In Different Years Summary PDF
This slide showcases an analysis of the average length of stay in different years. It also includes a decrease observed in the average length of years in the mentioned the years. Showcasing this set of slides titled Comparison Of Average Duration Of Stay In Different Years Summary PDF. The topics addressed in these templates are Key Insights, Average Duration. All the content presented in this PPT design is completely editable. Download it and make adjustments in color, background, font etc. as per your unique business setting.
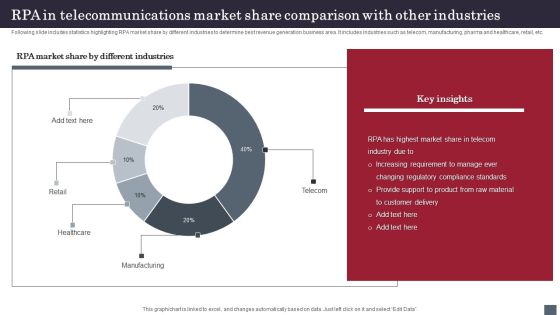
RPA In Telecommunications Market Share Comparison With Other Industries Rules PDF
Following slide includes statistics highlighting RPA market share by different industries to determine best revenue generation business area. It includes industries such as telecom, manufacturing, pharma and healthcare, retail, etc. Showcasing this set of slides titled RPA In Telecommunications Market Share Comparison With Other Industries Rules PDF. The topics addressed in these templates are Increasing Requirement, Changing Regulatory Compliance, Provide Support Product. All the content presented in this PPT design is completely editable. Download it and make adjustments in color, background, font etc. as per your unique business setting.

Budget Analysis Dashboard With Actual And Forecasted Revenue Comparison Structure PDF
This slide displays the budget analysis report comparing the budget with the actual year to date data. It also helps in making estimations for the remaining year. It includes variance between budgeted and actual gross margin results, service revenue, profit margin, product revenue, payroll cost, etc. Pitch your topic with ease and precision using this Budget Analysis Dashboard With Actual And Forecasted Revenue Comparison Structure PDF. This layout presents information on Payroll Cost, Budget Revenue Components, Product Revenue. It is also available for immediate download and adjustment. So, changes can be made in the color, design, graphics or any other component to create a unique layout.

Digital Advertising Plan For Bakery Business Competitor Comparison Based On Strengths Infographics PDF
This slide provides glimpse about competitor analysis that can help the bakery understand the competition and their acquired market share. It includes competitor, location, specialties, prices, strengths, weaknesses, etc. Take your projects to the next level with our ultimate collection of Digital Advertising Plan For Bakery Business Competitor Comparison Based On Strengths Infographics PDF. Slidegeeks has designed a range of layouts that are perfect for representing task or activity duration, keeping track of all your deadlines at a glance. Tailor these designs to your exact needs and give them a truly corporate look with your own brand colors they will make your projects stand out from the rest.

Marketing Budgetary Trends Comparison Pre And Post COVID 19 Background PDF
This slide shows investment by marketers in different areas. Some are hoping increase in the areas others are not willing to invest more due to uncertainty.Pitch your topic with ease and precision using this Marketing Budgetary Trends Comparison Pre And Post COVID 19 Background PDF. This layout presents information on Content Marketing, Influencer Marketing, Content Marketing. It is also available for immediate download and adjustment. So, changes can be made in the color, design, graphics or any other component to create a unique layout.

Profitability Comparison Of Business Investments In Securities Ppt PowerPoint Presentation Outline Deck PDF
This slide shows graphical report to analyze market timing and fluctuations in returns to gain maximum from the funds invested in share market. It includes details about most profitable ones, average and least growth. Pitch your topic with ease and precision using this Profitability Comparison Of Business Investments In Securities Ppt PowerPoint Presentation Outline Deck PDF. This layout presents information on Most Profitable, Least Profitable, Least Profitable. It is also available for immediate download and adjustment. So, changes can be made in the color, design, graphics or any other component to create a unique layout.

Digital And Offline Marketing Campaign Comparison Dashboard Ppt Inspiration Microsoft PDF
This slide showcases analysis of offline and online marketing in a dashboard covering key metrics. Performance indicators involved are purchases, free trial pay up rate and sign ups and monthly visitors. Pitch your topic with ease and precision using this Digital And Offline Marketing Campaign Comparison Dashboard Ppt Inspiration Microsoft PDF. This layout presents information on Online Marketing, Offline Marketing, Free Trial Sign, UPS. It is also available for immediate download and adjustment. So, changes can be made in the color, design, graphics or any other component to create a unique layout.

Paid Media Search Advertisement Lead Generation Survey Report Comparison Clipart PDF
This slide showcase per fence of digital marketers toward paid search marketing tools strategy for product promotion. It includes elements such as organic search, paid search, social media and email marketing strategy. Pitch your topic with ease and precision using this Paid Media Search Advertisement Lead Generation Survey Report Comparison Clipart PDF. This layout presents information on Search Marketing, B2B Marketing, Higher Profit. It is also available for immediate download and adjustment. So, changes can be made in the color, design, graphics or any other component to create a unique layout.

Insurance Business Financial Analysis Top Insurance Service Companies Growth Comparison Elements PDF
The slide showcases the growth of insurance companies over a decade. It compares top four companies on the basis of revenue growth from 2012 to 2022 along with the key highlights. Present like a pro with Insurance Business Financial Analysis Top Insurance Service Companies Growth Comparison Elements PDF Create beautiful presentations together with your team, using our easy-to-use presentation slides. Share your ideas in real-time and make changes on the fly by downloading our templates. So whether youre in the office, on the go, or in a remote location, you can stay in sync with your team and present your ideas with confidence. With Slidegeeks presentation got a whole lot easier. Grab these presentations today.
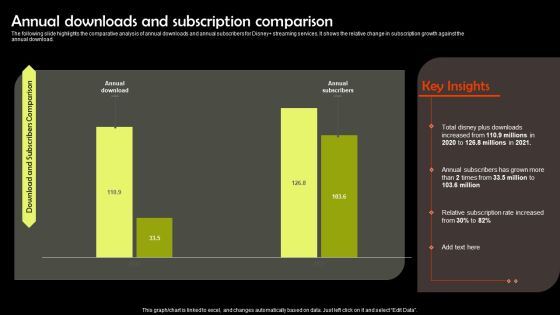
Digital Media Streaming Platform Company Profile Annual Downloads And Subscription Comparison Graphics PDF
The following slide highlights the comparative analysis of annual downloads and annual subscribers for Disney streaming services. It shows the relative change in subscription growth against the annual download. Welcome to our selection of the Digital Media Streaming Platform Company Profile Annual Downloads And Subscription Comparison Graphics PDF. These are designed to help you showcase your creativity and bring your sphere to life. Planning and Innovation are essential for any business that is just starting out. This collection contains the designs that you need for your everyday presentations. All of our PowerPoints are 100 percent editable, so you can customize them to suit your needs. This multi purpose template can be used in various situations. Grab these presentation templates today.

Coffee Cafe Company Profile Starbucks Product Price Comparison With Average Market Rate Introduction PDF
Mentioned slide provides insights into differences between Starbucks product pricing with average industry prices. It includes products such as cappuccino, Frappuccino, iced chai tea latte, hot chocolate, iced coffee, etc. Do you know about Slidesgeeks Coffee Cafe Company Profile Starbucks Product Price Comparison With Average Market Rate Introduction PDF. These are perfect for delivering any kind od presentation. Using it, create PowerPoint presentations that communicate your ideas and engage audiences. Save time and effort by using our pre designed presentation templates that are perfect for a wide range of topic. Our vast selection of designs covers a range of styles, from creative to business, and are all highly customizable and easy to edit. Download as a PowerPoint template or use them as Google Slides themes.

Company Profile For Online Video Service Provider Annual Downloads And Subscription Comparison Formats PDF
The following slide highlights the comparative analysis of annual downloads and annual subscribers for Disney streaming services. It shows the relative change in subscription growth against the annual download. This Company Profile For Online Video Service Provider Annual Downloads And Subscription Comparison Formats PDF from Slidegeeks makes it easy to present information on your topic with precision. It provides customization options, so you can make changes to the colors, design, graphics, or any other component to create a unique layout. It is also available for immediate download, so you can begin using it right away. Slidegeeks has done good research to ensure that you have everything you need to make your presentation stand out. Make a name out there for a brilliant performance.

Contrast Circle Graph Comparison Circular Shape Ppt PowerPoint Presentation Complete Deck
If designing a presentation takes a lot of your time and resources and you are looking for a better alternative, then this contrast circle graph comparison circular shape ppt powerpoint presentation complete deck is the right fit for you. This is a prefabricated set that can help you deliver a great presentation on the topic. All the ten slides included in this sample template can be used to present a birds-eye view of the topic. These slides are also fully editable, giving you enough freedom to add specific details to make this layout more suited to your business setting. Apart from the content, all other elements like color, design, theme are also replaceable and editable. This helps in designing a variety of presentations with a single layout. Not only this, you can use this PPT design in formats like PDF, PNG, and JPG once downloaded. Therefore, without any further ado, download and utilize this sample presentation as per your liking.

 Home
Home