Compare Cost

Raci Responsibility Matrix For Task Allocation And Management Ppt Powerpoint Presentation Ideas Diagrams
This is a raci responsibility matrix for task allocation and management ppt powerpoint presentation ideas diagrams. This is a six stage process. The stages in this process are resource management, wealth management, capital management.

Computer Laptop Tablet And Mobile With Percentage Values Powerpoint Slides
This slide which shows a mobile, a tablet and a laptop / TV screen can be perfectly used to demonstrate compatibility of an application or a website on different kind of devices, operating systems and screen sizes. This slide can be used by business and organizations dealing with technology in any manner. The slide can be used to demonstrate the usage experience on different screen sizes. It can be used to demonstrate the number of users of a website or an app or a particular platform. It can also easily depict the ratio of users on the based on their usage patterns and preferences of devise. This can be an effective way to compare one gadget with another. The slide is customizable and can be used with different icons and colors as per the convenience and needs of the user.

Artificial Intelligence Tools Expert System Human Expert Vs Expert System Ppt Infographic Template Images PDF
Presenting this set of slides with name artificial intelligence tools expert system human expert vs expert system ppt infographic template images pdf. This is a two stage process. The stages in this process are human experts, artificial expert systems, perishable, permanent, difficult transfer, easy transfer, difficult document, easy document, expensive, especially top notch, affordable, costly develop. This is a completely editable PowerPoint presentation and is available for immediate download. Download now and impress your audience.

AI High Tech PowerPoint Templates Human Expert Vs Expert System Elements PDF
Presenting this set of slides with name ai high tech powerpoint templates human expert vs expert system elements pdf. This is a two stage process. The stages in this process are permanent, perishable, difficult to transfer, easy to transfer, easy to document, difficult to document, expensive, especially top notch, affordable, costly to develop, but cheap to operate. This is a completely editable PowerPoint presentation and is available for immediate download. Download now and impress your audience.

Advantages Of Corporate Treasury Cash Management Ppt PowerPoint Presentation Slides Smartart
Presenting this set of slides with name advantages of corporate treasury cash management ppt powerpoint presentation slides smartart. This is a one stage process. The stages in this process are time efficiency, reduce costs and errors, full and accurate audit control, bank provider flexibility, compliance and system standardisation. This is a completely editable PowerPoint presentation and is available for immediate download. Download now and impress your audience.
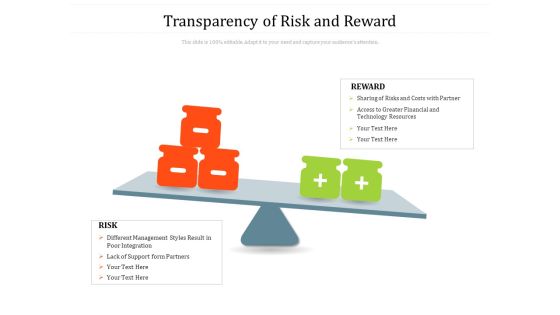
Transparency Of Risk And Reward Ppt PowerPoint Presentation Infographics Skills PDF
Presenting this set of slides with name transparency of risk and reward ppt powerpoint presentation infographics skills pdf. This is a two stage process. The stages in this process are risk, reward, different management styles result in poor integration, lack of support form partners, sharing of risks and costs with partner, access to greater financial and technology resources. This is a completely editable PowerPoint presentation and is available for immediate download. Download now and impress your audience.

Key Product Distribution Channels Hybrid Distribution Advantages And Challenges Ppt Outline Layout PDF
Presenting this set of slides with name key product distribution channels hybrid distribution advantages and challenges ppt outline layout pdf. This is a two stage process. The stages in this process are increased coverage by combining direct and indirect, conflict as more marketing channels compete for revenue, lower distribution costs via indirect, customized approaches. This is a completely editable PowerPoint presentation and is available for immediate download. Download now and impress your audience.

Marketing Guide For Segmentation Targeting And Positioning To Enhance Promotional Strategy Ppt PowerPoint Presentation Complete Deck With Slides
If you are looking for Marketing Guide For Segmentation Targeting And Positioning To Enhance Promotional Strategy Ppt PowerPoint Presentation Complete Deck With Slides to help improve your customer connect, this is the perfect option. Download this PowerPoint Template to make an effective observation on business strategies and policies. You can analyze techniques that prove beneficial or otherwise. You can easily monitor and compare other businesses on how they interact with customers and the industry benchmarks surrounding this with each of the eighty six slides of the complete deck a lesson the same. The 100 percent customizable feature of the presentation ensures that this has to be in your collection, at any cost. Download now.

E Commerce Business Development Plan Ecommerce Store A B Testing Workflow Process Professional PDF
The slide showcases various steps to perform A or B testing on e-commerce store to compare different versions of website element. It presents key steps such as identify elements to test, create two versions, randomly divide traffic and assess results. Slidegeeks is one of the best resources for PowerPoint templates. You can download easily and regulateE Commerce Business Development Plan Ecommerce Store A B Testing Workflow Process Professional PDF for your personal presentations from our wonderful collection. A few clicks is all it takes to discover and get the most relevant and appropriate templates. Use our Templates to add a unique zing and appeal to your presentation and meetings. All the slides are easy to edit and you can use them even for advertisement purposes.
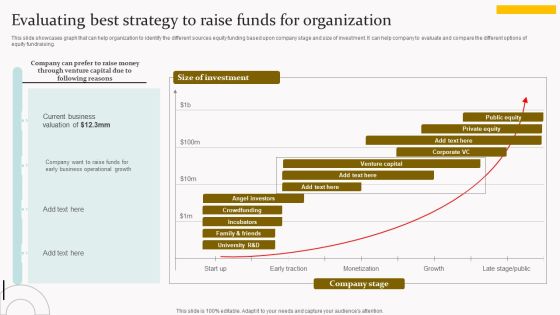
Evaluating Best Strategy To Raise Funds For Organization Ideas PDF
This slide showcases graph that can help organization to identify the different sources equity funding based upon company stage and size of investment. It can help company to evaluate and compare the different options of equity fundraising. Are you searching for a Evaluating Best Strategy To Raise Funds For Organization Ideas PDF that is uncluttered, straightforward, and original Its easy to edit, and you can change the colors to suit your personal or business branding. For a presentation that expresses how much effort you have put in, this template is ideal With all of its features, including tables, diagrams, statistics, and lists, its perfect for a business plan presentation. Make your ideas more appealing with these professional slides. Download Evaluating Best Strategy To Raise Funds For Organization Ideas PDF from Slidegeeks today.

Business And Financial Analysis Ppt PowerPoint Presentation Show Infographic Template
This is a business and financial analysis ppt powerpoint presentation show infographic template. This is a three stage process. The stages in this process are equipment, land cost, interior cost, employee cost, marketing cost, other cost.

Business And Financial Analysis Ppt PowerPoint Presentation Layouts Skills
This is a business and financial analysis ppt powerpoint presentation layouts skills. This is a three stage process. The stages in this process are investment, equipment, land cost, interior cost, employee cost, marketing cost, other cost.

Deploying House Flipping Business Plan Real Estate Rental Market Analysis To Determine Property Value Structure PDF
This slide represents rental market analysis that helps investors and buyers evaluate and compare properties. It covers job market trends, property prices, price to rent ratio etc. Present like a pro with Deploying House Flipping Business Plan Real Estate Rental Market Analysis To Determine Property Value Structure PDF Create beautiful presentations together with your team, using our easy to use presentation slides. Share your ideas in real time and make changes on the fly by downloading our templates. So whether you are in the office, on the go, or in a remote location, you can stay in sync with your team and present your ideas with confidence. With Slidegeeks presentation got a whole lot easier. Grab these presentations today.
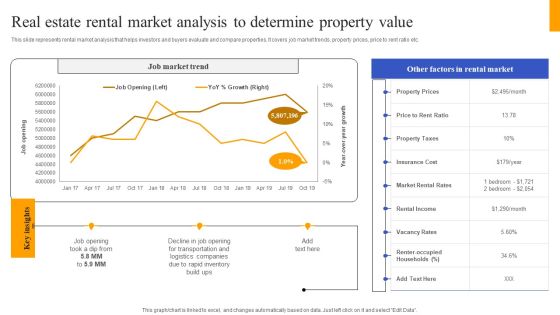
Fix And Flip Method For Renovating Real Estate Real Estate Rental Market Analysis To Determine Designs PDF
This slide represents rental market analysis that helps investors and buyers evaluate and compare properties. It covers job market trends, property prices, price to rent ratio etc. Find highly impressive Fix And Flip Method For Renovating Real Estate Real Estate Rental Market Analysis To Determine Designs PDF on Slidegeeks to deliver a meaningful presentation. You can save an ample amount of time using these presentation templates. No need to worry to prepare everything from scratch because Slidegeeks experts have already done a huge research and work for you. You need to download Fix And Flip Method For Renovating Real Estate Real Estate Rental Market Analysis To Determine Designs PDF for your upcoming presentation. All the presentation templates are 100 percent editable and you can change the color and personalize the content accordingly. Download now.
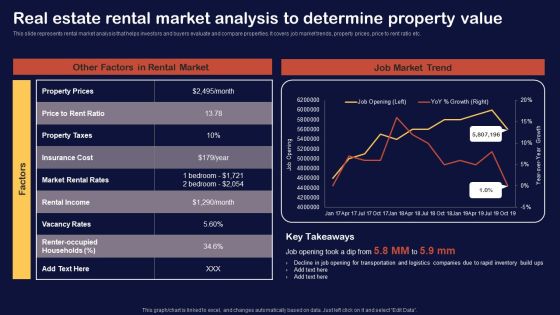
Synopsis For House Flipping Techniques Real Estate Rental Market Analysis Determine Property Introduction PDF
This slide represents rental market analysis that helps investors and buyers evaluate and compare properties. It covers job market trends, property prices, price to rent ratio etc. Do you know about Slidesgeeks Synopsis For House Flipping Techniques Real Estate Rental Market Analysis Determine Property Introduction PDF These are perfect for delivering any kind od presentation. Using it, create PowerPoint presentations that communicate your ideas and engage audiences. Save time and effort by using our pre designed presentation templates that are perfect for a wide range of topic. Our vast selection of designs covers a range of styles, from creative to business, and are all highly customizable and easy to edit. Download as a PowerPoint template or use them as Google Slides themes.

Strategies For Flipping Houses For Maximum Revenue Real Estate Rental Market Analysis Determine Property Value Download PDF
This slide represents rental market analysis that helps investors and buyers evaluate and compare properties. It covers job market trends, property prices, price to rent ratio etc. Are you in need of a template that can accommodate all of your creative concepts This one is crafted professionally and can be altered to fit any style. Use it with Google Slides or PowerPoint. Include striking photographs, symbols, depictions, and other visuals. Fill, move around, or remove text boxes as desired. Test out color palettes and font mixtures. Edit and save your work, or work with colleagues. Download Strategies For Flipping Houses For Maximum Revenue Real Estate Rental Market Analysis Determine Property Value Download PDF and observe how to make your presentation outstanding. Give an impeccable presentation to your group and make your presentation unforgettable.
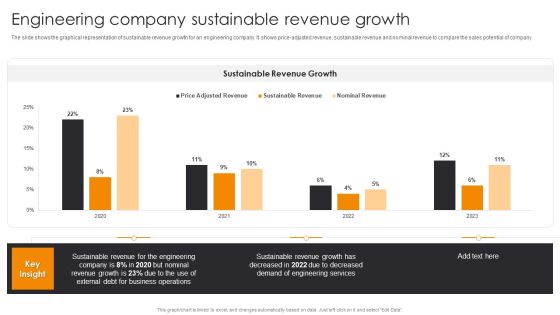
Engineering Company Sustainable Revenue Growth Engineering Company Financial Analysis Report Clipart PDF
The slide shows the graphical representation of sustainable revenue growth for an engineering company. It shows price-adjusted revenue, sustainable revenue and nominal revenue to compare the sales potential of company. Coming up with a presentation necessitates that the majority of the effort goes into the content and the message you intend to convey. The visuals of a PowerPoint presentation can only be effective if it supplements and supports the story that is being told. Keeping this in mind our experts created Engineering Company Sustainable Revenue Growth Engineering Company Financial Analysis Report Clipart PDF to reduce the time that goes into designing the presentation. This way, you can concentrate on the message while our designers take care of providing you with the right template for the situation.

Assessing Debt And Equity Fundraising Alternatives For Business Growth Assessing Debt And Best Strategy Template PDF
This slide showcases graph that can help organization to identify the different sources equity funding based upon company stage and size of investment. It can help company to evaluate and compare the different options of equity fundraising. Get a simple yet stunning designed Assessing Debt And Equity Fundraising Alternatives For Business Growth Assessing Debt And Best Strategy Template PDF. It is the best one to establish the tone in your meetings. It is an excellent way to make your presentations highly effective. So, download this PPT today from Slidegeeks and see the positive impacts. Our easy to edit Assessing Debt And Equity Fundraising Alternatives For Business Growth Assessing Debt And Best Strategy Template PDF can be your go to option for all upcoming conferences and meetings. So, what are you waiting for Grab this template today.
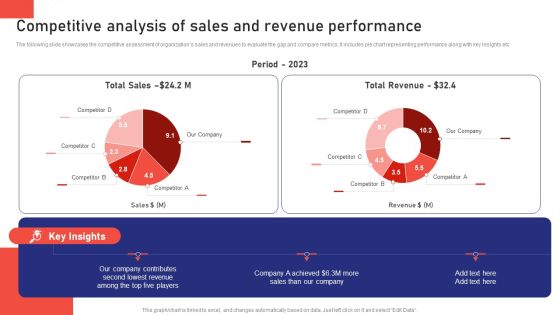
Sales Risk Assessment For Profit Maximization Competitive Analysis Of Sales And Revenue Performance Introduction PDF
The following slide showcases the competitive assessment of organizations sales and revenues to evaluate the gap and compare metrics. It includes pie chart representing performance along with key insights etc. Slidegeeks is one of the best resources for PowerPoint templates. You can download easily and regulate Sales Risk Assessment For Profit Maximization Competitive Analysis Of Sales And Revenue Performance Introduction PDF for your personal presentations from our wonderful collection. A few clicks is all it takes to discover and get the most relevant and appropriate templates. Use our Templates to add a unique zing and appeal to your presentation and meetings. All the slides are easy to edit and you can use them even for advertisement purposes.

Integration Automation Recent Tools Used For Workflow Automation By Industry Formats PDF
This slide includes the trending workflow automation tools for industries such as healthcare, IT, finance, marketing, human resources etc. It compare tools on the basis of usage, feature, pricing model, etc. Are you searching for a Integration Automation Recent Tools Used For Workflow Automation By Industry Formats PDF that is uncluttered, straightforward, and original Its easy to edit, and you can change the colors to suit your personal or business branding. For a presentation that expresses how much effort youve put in, this template is ideal With all of its features, including tables, diagrams, statistics, and lists, its perfect for a business plan presentation. Make your ideas more appealing with these professional slides. Download Integration Automation Recent Tools Used For Workflow Automation By Industry Formats PDF from Slidegeeks today.
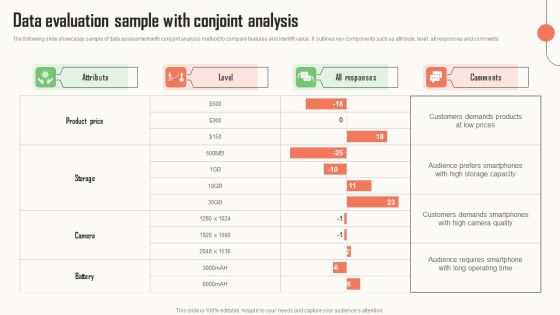
Strategic Market Insight Implementation Guide Data Evaluation Sample With Conjoint Analysis Background PDF
The following slide showcases sample of data assessment with conjoint analysis method to compare features and identify value. It outlines key components such as attribute, level, all responses and comments. Slidegeeks is here to make your presentations a breeze with Strategic Market Insight Implementation Guide Data Evaluation Sample With Conjoint Analysis Background PDF With our easy to use and customizable templates, you can focus on delivering your ideas rather than worrying about formatting. With a variety of designs to choose from, you are sure to find one that suits your needs. And with animations and unique photos, illustrations, and fonts, you can make your presentation pop. So whether you are giving a sales pitch or presenting to the board, make sure to check out Slidegeeks first.

Competitive Analysis Of Sales And Revenue Performance Ppt Introduction PDF
The following slide showcases the competitive assessment of organizations sales and revenues to evaluate the gap and compare metrics. It includes pie chart representing performance along with key insights etc. This modern and well arranged Competitive Analysis Of Sales And Revenue Performance Ppt Introduction PDF provides lots of creative possibilities. It is very simple to customize and edit with the Powerpoint Software. Just drag and drop your pictures into the shapes. All facets of this template can be edited with Powerpoint no extra software is necessary. Add your own material, put your images in the places assigned for them, adjust the colors, and then you can show your slides to the world, with an animated slide included.

Steps To Benchmark Report User Experience Of The Product Globally Structure PDF
The slide shows the steps to benchmark user experience to measure overall progress of product or service and to compare the user experience against competitors or industry benchmarks by using certain metrics. The elements are determine what to measure, select measurement method, initial measurement, interpret results and determining return on investment rate. Presenting Steps To Benchmark Report User Experience Of The Product Globally Structure PDF to dispense important information. This template comprises six stages. It also presents valuable insights into the topics including Select Measurement Method, Initial Measurement Collection, Measure Other Variables. This is a completely customizable PowerPoint theme that can be put to use immediately. So, download it and address the topic impactfully.

Guidebook For Executing Business Market Intelligence Description Of Conjoint Analysis As Data Professional PDF
The following slide provides an overview of conjoint analysis for analyzing data in market intelligence to compare various attributes and determine its value. It also highlights its benefits which are brand equity, market segmentation, price sensitivity and attribute interaction calculation. Create an editable Guidebook For Executing Business Market Intelligence Description Of Conjoint Analysis As Data Professional PDF that communicates your idea and engages your audience. Whether you are presenting a business or an educational presentation, pre designed presentation templates help save time. Guidebook For Executing Business Market Intelligence Description Of Conjoint Analysis As Data Professional PDF is highly customizable and very easy to edit, covering many different styles from creative to business presentations. Slidegeeks has creative team members who have crafted amazing templates. So, go and get them without any delay.
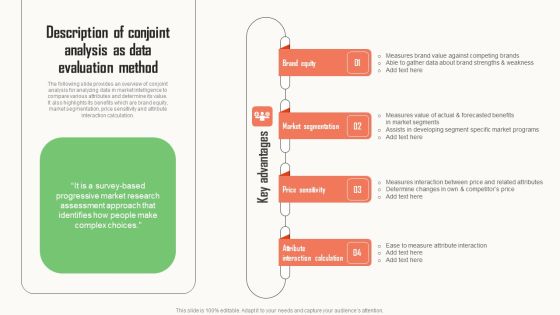
Strategic Market Insight Implementation Guide Description Of Conjoint Analysis As Data Evaluation Method Graphics PDF
The following slide provides an overview of conjoint analysis for analyzing data in market intelligence to compare various attributes and determine its value. It also highlights its benefits which are brand equity, market segmentation, price sensitivity and attribute interaction calculation. Whether you have daily or monthly meetings, a brilliant presentation is necessary. Strategic Market Insight Implementation Guide Description Of Conjoint Analysis As Data Evaluation Method Graphics PDF can be your best option for delivering a presentation. Represent everything in detail using Strategic Market Insight Implementation Guide Description Of Conjoint Analysis As Data Evaluation Method Graphics PDF and make yourself stand out in meetings. The template is versatile and follows a structure that will cater to your requirements. All the templates prepared by Slidegeeks are easy to download and edit. Our research experts have taken care of the corporate themes as well. So, give it a try and see the results.

Steps To Conduct Competitor Analysis Strategic Group Analysis To Evaluate Competitors Mockup PDF
The following slide showcases strategic group analysis used as tool to conduct competitor analysis and compare various attributes of competing businesses. It showcases components such as brand reputation and product categories. Slidegeeks is one of the best resources for PowerPoint templates. You can download easily and regulate Steps To Conduct Competitor Analysis Strategic Group Analysis To Evaluate Competitors Mockup PDF for your personal presentations from our wonderful collection. A few clicks is all it takes to discover and get the most relevant and appropriate templates. Use our Templates to add a unique zing and appeal to your presentation and meetings. All the slides are easy to edit and you can use them even for advertisement purposes.
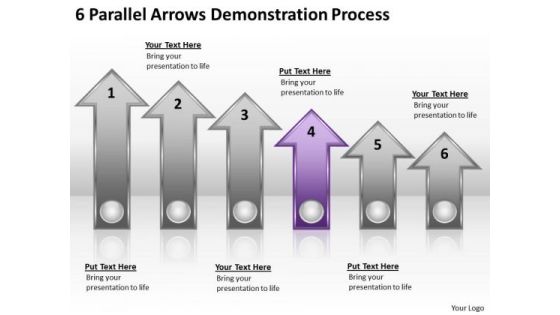
Advantage Of Parallel Processing 6 Arrows Demonstration PowerPoint Slides
We present our advantage of parallel processing 6 arrows demonstration PowerPoint Slides.Present our Arrows PowerPoint Templates because Your ideas provide food for thought. Our PowerPoint Templates and Slides will help you create a dish to tickle the most discerning palate. Use our Business PowerPoint Templates because Our PowerPoint Templates and Slides will let you Leave a lasting impression to your audiences. They possess an inherent longstanding recall factor. Present our Success PowerPoint Templates because It is Aesthetically crafted by artistic young minds. Our PowerPoint Templates and Slides are designed to display your dexterity. Present our Shapes PowerPoint Templates because You should Kick up a storm with our PowerPoint Templates and Slides. The heads of your listeners will swirl with your ideas. Use our Symbol PowerPoint Templates because Our PowerPoint Templates and Slides are topically designed to provide an attractive backdrop to any subject.Use these PowerPoint slides for presentations relating to accounting, arrow, ascending, background, bank, blue, business, charts, compare, comparison, computer, corporate, count, descending, fame, famous, finance, generated, gradient, grow, growth, illustration, income, international, linear, money, papers, parallel, percentage, point, record, scale, shares, signs, stock, success, symbols, tax, tip, vary, white, world. The prominent colors used in the PowerPoint template are Purple, Gray, White. You can be sure our advantage of parallel processing 6 arrows demonstration PowerPoint Slides help you meet deadlines which are an element of today's workplace. Just browse and pick the slides that appeal to your intuitive senses. People tell us our compare PowerPoint templates and PPT Slides will make you look like a winner. You can be sure our advantage of parallel processing 6 arrows demonstration PowerPoint Slides are second to none. Use our blue PowerPoint templates and PPT Slides are topically designed to provide an attractive backdrop to any subject. Presenters tell us our advantage of parallel processing 6 arrows demonstration PowerPoint Slides will save the presenter time. We assure you our bank PowerPoint templates and PPT Slides will help them to explain complicated concepts.

Business And Financial Analysis Ppt PowerPoint Presentation Infographics Slide Portrait
This is a business and financial analysis ppt powerpoint presentation infographics slide portrait. This is a three stage process. The stages in this process are investment, land cost, equipment, employee cost, marketing cost, other cost.

Business And Financial Analysis Ppt PowerPoint Presentation Layouts Portrait
This is a business and financial analysis ppt powerpoint presentation layouts portrait. This is a three stage process. The stages in this process are equipment, land cost, interior cost, employee cost, marketing cost.

Business And Financial Analysis Ppt PowerPoint Presentation Inspiration Structure
This is a business and financial analysis ppt powerpoint presentation inspiration structure. This is a three stage process. The stages in this process are equipment, land cost, interior cost, employee cost, marketing cost.

Budgeting Planned Actual Comparison Ppt PowerPoint Presentation Portfolio Display
This is a budgeting planned actual comparison ppt powerpoint presentation portfolio display. This is a three stage process. The stages in this process are type of cost, planned cost, actual cost, deviation, value difference.

Forecast Vs Actual Budget Ppt PowerPoint Presentation File Design Inspiration
This is a forecast vs actual budget ppt powerpoint presentation file design inspiration. This is a six stage process. The stages in this process are quantity, unit, cost, total cost, annual cost.

Business And Financial Analysis Ppt PowerPoint Presentation Professional
This is a business and financial analysis ppt powerpoint presentation professional. This is a three stage process. The stages in this process are investment, land cost, equipment, interior cost, employee cost.

Business And Financial Analysis Ppt PowerPoint Presentation Inspiration Design Templates
This is a business and financial analysis ppt powerpoint presentation inspiration design templates. This is a eight stage process. The stages in this process are investment, equipment, land cost, interior cost, employee cost.

Business And Financial Analysis Ppt PowerPoint Presentation Styles Summary
This is a business and financial analysis ppt powerpoint presentation styles summary. This is a four stage process. The stages in this process are investment, equipment, marketing cost, employee cost, interior cost.

Break Even Analysis Ppt PowerPoint Presentation Model Portfolio
This is a break even analysis ppt powerpoint presentation model portfolio. This is a five stage process. The stages in this process are fixed cost, variable cost, total cost, sales revenue.

Break Even Analysis Ppt PowerPoint Presentation Inspiration Microsoft
This is a break even analysis ppt powerpoint presentation inspiration microsoft. This is a five stage process. The stages in this process are fixed cost, variable cost, total cost, sales revenue.

Break Even Analysis Ppt PowerPoint Presentation Summary Background Designs
This is a break even analysis ppt powerpoint presentation summary background designs. This is a five stage process. The stages in this process are units of output, fixed cost, variable cost, total cost, sales revenue.

Breakeven Analysis Ppt PowerPoint Presentation Professional Design Templates
This is a breakeven analysis ppt powerpoint presentation professional design templates. This is a six stage process. The stages in this process are units of output, fixed cost, variable cost, total cost, sales revenue.

Break Even Analysis Ppt PowerPoint Presentation Gallery Master Slide
This is a break even analysis ppt powerpoint presentation gallery master slide. This is a two stage process. The stages in this process are total revenue, total costs, variable cost, fixed costs, units sold.

Break Even Analysis Ppt PowerPoint Presentation Styles Influencers
This is a break even analysis ppt powerpoint presentation styles influencers. This is a five stage process. The stages in this process are units of output, fixed cost, variable cost, total cost, sales revenue.

Break Even Analysis Ppt PowerPoint Presentation Portfolio Graphics Design
This is a break even analysis ppt powerpoint presentation portfolio graphics design. This is a five stage process. The stages in this process are units of output, fixed cost, variable cost, total cost, sales revenue.
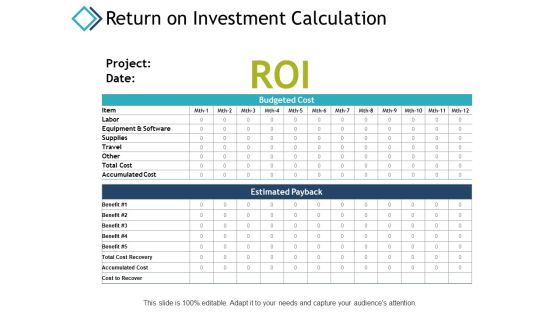
Return On Investment Calculation Ppt PowerPoint Presentation Show Gallery
This is a return on investment calculation ppt powerpoint presentation show gallery. This is a two stage process. The stages in this process are budgeted cost, estimated payback, supplies, accumulated cost, marketing.

Budgeting Planned Actual Comparison Ppt PowerPoint Presentation Portfolio Background
This is a budgeting planned actual comparison ppt powerpoint presentation portfolio background. This is a three stage process. The stages in this process are planned cost, actual cost, value difference, deviation, bar graph.

Business And Financial Analysis Required Investment Ppt PowerPoint Presentation Inspiration
This is a business and financial analysis required investment ppt powerpoint presentation inspiration. This is a three stage process. The stages in this process are equipment, interior cost, investment by indian entrepreneurs, marketing cost.

Budgeting Planned Actual Comparison Ppt PowerPoint Presentation Deck
This is a budgeting planned actual comparison ppt powerpoint presentation deck. This is a two stage process. The stages in this process are planned cost, actual cost, value difference.
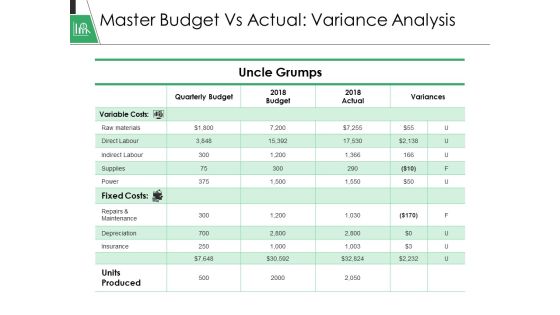
Master Budget Vs Actual Variance Analysis Ppt PowerPoint Presentation Template
This is a master budget vs actual variance analysis ppt powerpoint presentation template. This is a four stage process. The stages in this process are variable costs, fixed costs, units produced, quarterly budget, actual, variances.

Forecast Vs Actual Budget Ppt PowerPoint Presentation Infographics Smartart
This is a forecast vs actual budget ppt powerpoint presentation infographics smartart. This is a six stage process. The stages in this process are irrigation setup, quantity, unit, cost, annual cost.
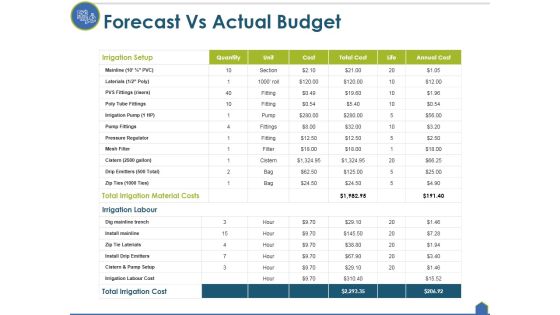
Forecast Vs Actual Budget Ppt PowerPoint Presentation File Template
This is a forecast vs actual budget ppt powerpoint presentation file template. This is a two stage process. The stages in this process are irrigation setup, total irrigation material costs, irrigation labour, total irrigation cost.
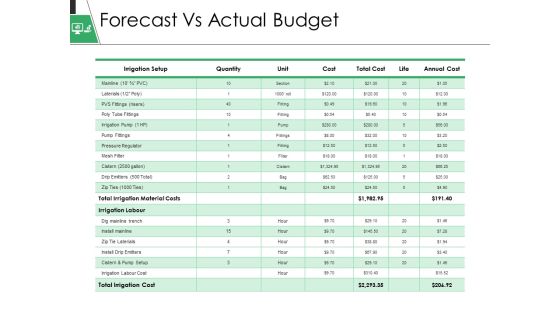
Forecast Vs Actual Budget Ppt PowerPoint Presentation Pictures Objects
This is a forecast vs actual budget ppt powerpoint presentation pictures objects. This is a six stage process. The stages in this process are irrigation setup, total irrigation material costs, irrigation labour, total irrigation cost, quantity.

Calculating Customer Lifetime Value Ppt PowerPoint Presentation Templates
This is a calculating customer lifetime value ppt powerpoint presentation templates. This is a five stage process. The stages in this process are average acquisition cost, average customer revenue, average customer costs, average customer profit, customer retention rate.

Cash Position By Quarter Ppt PowerPoint Presentation Model
This is a cash position by quarter ppt powerpoint presentation model. This is a four stage process. The stages in this process are average acquisition cost, average customer revenue, average customer costs, average customer profit, customer retention rate.

Break Even Analysis Ppt PowerPoint Presentation Deck
This is a break even analysis ppt powerpoint presentation deck. This is a five stage process. The stages in this process are key comments on the table, units of output, fixed cost, variable cost.

Calculating Customer Lifetime Value Clv Ppt PowerPoint Presentation Show Icon
This is a calculating customer lifetime value clv ppt powerpoint presentation show icon. This is a five stage process. The stages in this process are average acquisition cost, average customer revenue, average customer costs, average customer profit, customer retention rate.

Calculating Customer Lifetime Value Ppt PowerPoint Presentation Styles Slides
This is a calculating customer lifetime value ppt powerpoint presentation styles slides. This is a four stage process. The stages in this process are average acquisition cost, average customer costs, discount rate.

Break Even Analysis Ppt PowerPoint Presentation Portfolio Clipart
This is a break even analysis ppt powerpoint presentation portfolio clipart. This is a five stage process. The stages in this process are fixed cost, variable cost, sales revenue, profit, key comments on the table, units of output.

Break Even Analysis Ppt PowerPoint Presentation Styles Template
This is a break even analysis ppt powerpoint presentation styles template. This is a five stage process. The stages in this process are fixed cost, variable cost, key comments on the table, units of output, business.

Break Even Analysis Ppt PowerPoint Presentation Outline Example Topics
This is a break even analysis ppt powerpoint presentation outline example topics. This is a five stage process. The stages in this process are units of output, variable, fixed cost, total cost, sales revenue.
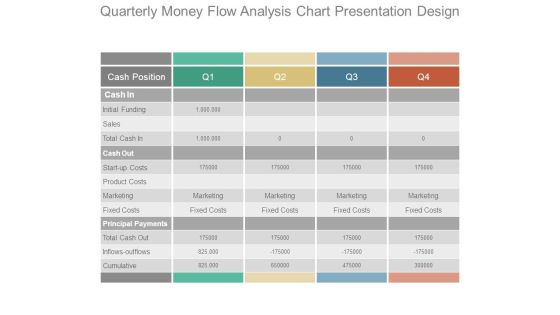
Quarterly Money Flow Analysis Chart Presentation Design
This is a quarterly money flow analysis chart presentation design. This is a four stage process. The stages in this process are cash position, cash in, initial funding, sales, total cash in, cash out, start up costs, product costs, marketing, fixed costs, principal payments, total cash out, inflows outflows, cumulative.
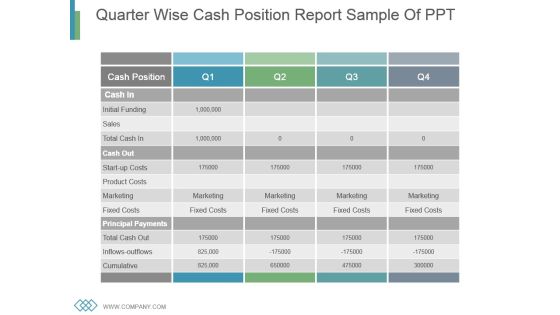
Quarter Wise Cash Position Report Sample Of Ppt
This is a quarter wise cash position report sample of ppt. This is a four stage process. The stages in this process are initial funding, sales, total cash in, cash out, start up costs, product costs, marketing, fixed costs, total cash out, inflows outflows, cumulative.

 Home
Home