Comparative Analysis

Chart Showing Comparison Of Database Systems Ppt PowerPoint Presentation Portfolio Styles
Presenting this set of slides with name chart showing comparison of database systems ppt powerpoint presentation portfolio styles. The topics discussed in these slides are price in usd, basic, professional, premium, data functionality features, data backup and recovery, multiuser access control, minimum duplication and redundancy. This is a completely editable PowerPoint presentation and is available for immediate download. Download now and impress your audience.
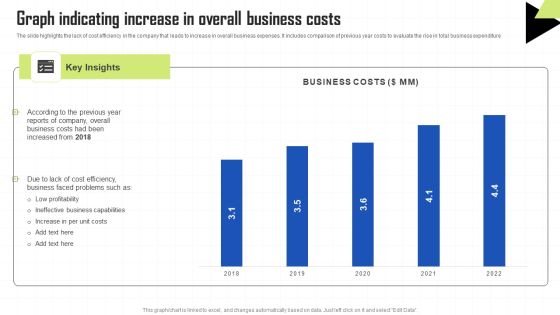
Key Techniques To Enhance Cost Efficiency Graph Indicating Increase In Overall Business Costs Structure PDF
The slide highlights the lack of cost efficiency in the company that leads to increase in overall business expenses. It includes comparison of previous year costs to evaluate the rise in total business expenditure Welcome to our selection of the Key Techniques To Enhance Cost Efficiency Graph Indicating Increase In Overall Business Costs Structure PDF. These are designed to help you showcase your creativity and bring your sphere to life. Planning and Innovation are essential for any business that is just starting out. This collection contains the designs that you need for your everyday presentations. All of our PowerPoints are 100 percent editable, so you can customize them to suit your needs. This multi purpose template can be used in various situations. Grab these presentation templates today.

Blue Ocean Tactics Fundamental Differences Between Red Ocean Strategy And Blue Ocean Template PDF
This template covers comparison between red ocean strategy and blue ocean strategy. It depicts that in red ocean strategy, organizations has to choose between creating more value for customers and a lower price whereas in blue ocean strategy companies attempt to achieve both differentiation and a low cost, opening up a new market space. Are you in need of a template that can accommodate all of your creative concepts This one is crafted professionally and can be altered to fit any style. Use it with Google Slides or PowerPoint. Include striking photographs, symbols, depictions, and other visuals. Fill, move around, or remove text boxes as desired. Test out color palettes and font mixtures. Edit and save your work, or work with colleagues. Download Blue Ocean Tactics Fundamental Differences Between Red Ocean Strategy And Blue Ocean Template PDF and observe how to make your presentation outstanding. Give an impeccable presentation to your group and make your presentation unforgettable.

Ppt Analogous Diagram PowerPoint Templates Explaining 3 State
PPT analogous diagram powerpoint templates explaining 3 state-This PowerPoint diagram provides better understanding of three state functions. Emphasizes on improve the standards for more effective results.-PPT analogous diagram powerpoint templates explaining 3 state-3d, Abstract, Backgrounds, Ball, Business, Choice, Comparison, Concept, Descriptive, Equilibrium, Grow, Illustrations, Instrument, Measurement, Metallic, Part, Partnership, Pattern, Progress, Reflections, Scales, Several, Sphere, Strategy, Success
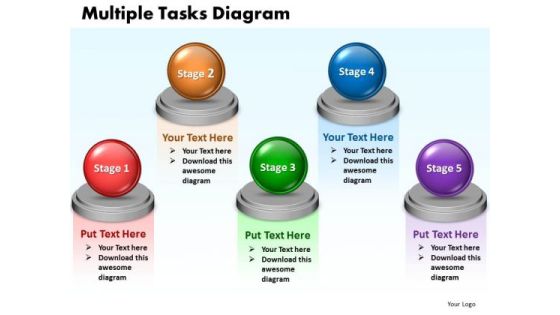
Ppt Multiple Tasks Chart 5 Stages PowerPoint Templates 2003
PPT multiple tasks chart 5 stages powerpoint templates 2003 0812-This diagram will help you to organize information, organize and run effective meetings, and generate useful member contributions.-PPT multiple tasks chart 5 stages powerpoint templates 2003 0812-3d, Abstract, Backgrounds, Ball, Business, Choice, Comparison, Concept, Descriptive, Equilibrium, Grow, Illustrations, Instrument, Measurement, Metallic, Part, Partnership, Pattern, Progress, Reflections, Scales, Several, Sphere, Strategy, Success
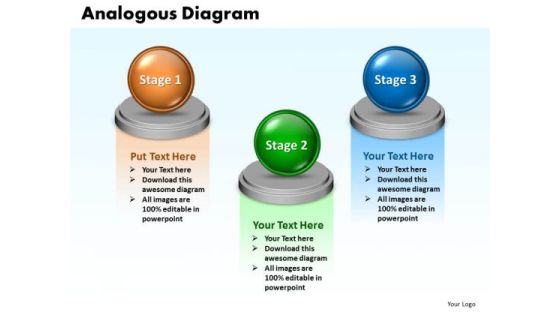
Ppt Analogous Diagram Describing 3 State PowerPoint Templates
PPT analogous diagram describing 3 state PowerPoint Templates-This PowerPoint diagram provides better understanding of three state functions. Emphasizes on improve the standards for more effective results.-PPT analogous diagram describing 3 state PowerPoint Templates-3d, Abstract, Backgrounds, Ball, Business, Choice, Comparison, Concept, Descriptive, Equilibrium, Grow, Illustrations, Instrument, Measurement, Metallic, Part, Partnership, Pattern, Progress, Reflections, Scales, Several, Sphere, Strategy, Success

Ppt Multiple Tasks Diagram Layouts PowerPoint 2007 Templates
PPT multiple tasks diagram layouts powerpoint 2007 Templates-This is an amazing graphics to pinpoint the critical paths and areas in your process and set the timelines for their completion.-PPT multiple tasks diagram layouts powerpoint 2007 Templates-3d, Abstract, Backgrounds, Ball, Business, Choice, Comparison, Concept, Descriptive, Equilibrium, Grow, Illustrations, Instrument, Measurement, Metallic, Part, Partnership, Pattern, Progress, Reflections, Scales, Several, Sphere, Strategy, Success
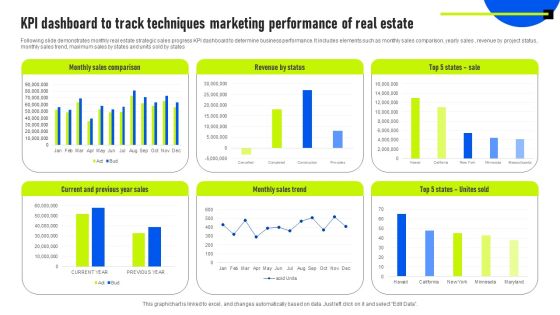
KPI Dashboard To Track Techniques Marketing Performance Of Real Estate Information PDF
Following slide demonstrates monthly real estate strategic sales progress KPI dashboard to determine business performance. It includes elements such as monthly sales comparison, yearly sales , revenue by project status, monthly sales trend, maximum sales by states and units sold by states. Showcasing this set of slides titled KPI Dashboard To Track Techniques Marketing Performance Of Real Estate Information PDF. The topics addressed in these templates are Revenue By Status, Monthly Sales Comparison, Monthly Sales Trend. All the content presented in this PPT design is completely editable. Download it and make adjustments in color, background, font etc. as per your unique business setting.

Employee Health And Safety Performance Measurements Comparison Of Actual And Targets In Workplace Mockup PDF
This slide contains the information of the key performance indicators for checking performance on safety. It also includes the target that has to be achieved with the actual outcome and their status. Persuade your audience using this Employee Health And Safety Performance Measurements Comparison Of Actual And Targets In Workplace Mockup PDF This PPT design covers five stages, thus making it a great tool to use. It also caters to a variety of topics including Performance Measures, Reduction Equipment Breakdowns, Employees Trained Download this PPT design now to present a convincing pitch that not only emphasizes the topic but also showcases your presentation skills.

Data Warehouse Implementation Data Warehousing And Business Intelligence Structure PDF
This slide represents the comparison between data warehousing and business intelligence and how business intelligence helps to generate useful output from raw data.Presenting Data Warehouse Implementation Data Warehousing And Business Intelligence Structure PDF to provide visual cues and insights. Share and navigate important information on seven stages that need your due attention. This template can be used to pitch topics like Data Governance, Data Integration, Data Discovery. In addtion, this PPT design contains high resolution images, graphics, etc, that are easily editable and available for immediate download.

Evaluating New Commodity Impact On Market Product Sales Vs Product Return Template PDF
Purpose of the following slide is to show the product sales vs. product return ratio of the organization, the provided graph displays the sales of the product in each month in comparison to the returns Deliver an awe inspiring pitch with this creative Evaluating New Commodity Impact On Market Product Sales Vs Product Return Template PDF bundle. Topics like Experienced Highest, Returns Comparison, Key Takeaways can be discussed with this completely editable template. It is available for immediate download depending on the needs and requirements of the user.
Steps To Achieve ISO 9001 Certification Guideline 1 Software Process Flow Icons PDF
This template covers quality management software design as an artifact including companys QMS statement, comparison, quality index and visualization. This is a Steps To Achieve ISO 9001 Certification Guideline 1 Software Process Flow Icons PDF template with various stages. Focus and dispense information on four stages using this creative set, that comes with editable features. It contains large content boxes to add your information on topics like Quality Index, Visualization, Software Process Flow. You can also showcase facts, figures, and other relevant content using this PPT layout. Grab it now.

ISO 9001 Standard For Quality Control Guideline 1 Software Process Flow Graphics PDF
This template covers quality management software design as an artifact including companys QMS statement, comparison, quality index and visualization. This is a ISO 9001 Standard For Quality Control Guideline 1 Software Process Flow Graphics PDF template with various stages. Focus and dispense information on four stages using this creative set, that comes with editable features. It contains large content boxes to add your information on topics like Platform Produces, Software Process Flow. You can also showcase facts, figures, and other relevant content using this PPT layout. Grab it now.

Post Merger And Acquisition Performance Gap Assessment Guide For Successful Merger And Acquisition Themes PDF
Following slide shows the comparison of current versus target capabilities of the firm post merger and acquisition. It includes information about the companys score as well as a performance rating.From laying roadmaps to briefing everything in detail, our templates are perfect for you. You can set the stage with your presentation slides. All you have to do is download these easy-to-edit and customizable templates. Post Merger And Acquisition Performance Gap Assessment Guide For Successful Merger And Acquisition Themes PDF will help you deliver an outstanding performance that everyone would remember and praise you for. Do download this presentation today.
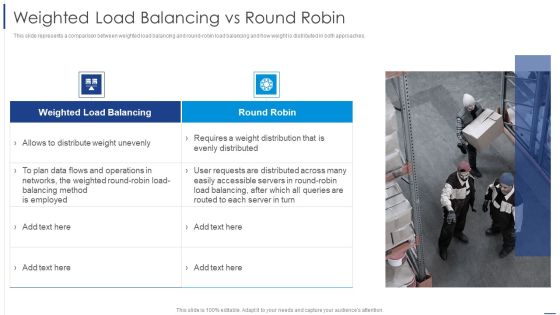
Load Balancing Technique Weighted Load Balancing Vs Round Robin Information PDF
This slide represents a comparison between weighted load balancing and round robin load balancing and how weight is distributed in both approaches. Deliver an awe inspiring pitch with this creative Load Balancing Technique Weighted Load Balancing Vs Round Robin Information PDF bundle. Topics like Networks, Plan Data, Load Balancing Method can be discussed with this completely editable template. It is available for immediate download depending on the needs and requirements of the user.
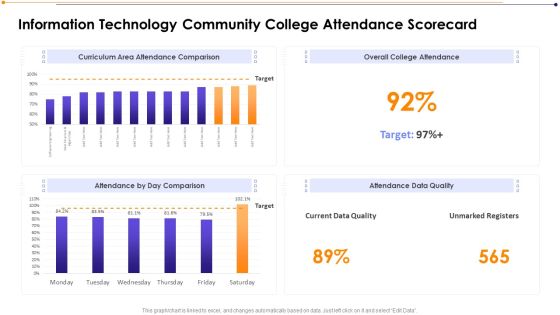
Information Technology Community College Attendance Scorecard Download PDF
Deliver an awe inspiring pitch with this creative Information Technology Community College Attendance Scorecard Download PDF bundle. Topics like Attendance Comparison, College Attendance, Attendance Quality can be discussed with this completely editable template. It is available for immediate download depending on the needs and requirements of the user.

China Australia Honduras Map Population Chart Powerpoint Slides
This PowerPoint template displays graphics of China, Australia and Honduras map. This Map template can be used in business presentations to depict population comparison. This slide can also be used by school students for educational projects.
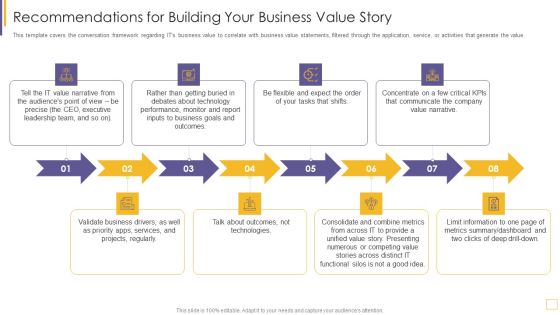
Guidelines For Exhibiting Business Value Of Information And Technology Recommendations For Building Ideas PDF
This template covers the conversation framework regarding ITs business value to correlate with business value statements, filtered through the application, service, or activities that generate the value. This is a guidelines for exhibiting business value of information and technology recommendations for building ideas pdf template with various stages. Focus and dispense information on eight stages using this creative set, that comes with editable features. It contains large content boxes to add your information on topics like technology, communicate, value, services. You can also showcase facts, figures, and other relevant content using this PPT layout. Grab it now.

Load Balancing Technique Stateful Vs Stateless Load Balancing Mockup PDF
This slide represents a comparison between stateful and stateless load balancing and the working style of both approaches as stateful load balancer uses a session table and stateless load balancer use hashing algorithm. Deliver an awe inspiring pitch with this creative Load Balancing Technique Stateful Vs Stateless Load Balancing Mockup PDF bundle. Topics like Determined, Target Server can be discussed with this completely editable template. It is available for immediate download depending on the needs and requirements of the user.

Pitch Deck To Raise Capital From Commercial Financial Institution Using Bonds Debt Financing Capitalization Table Portrait PDF
This slide shows companys Debt Financing pre and post capitalization comparison table with total valuation of shares and their ownership percentage Deliver and pitch your topic in the best possible manner with this pitch deck to raise capital from commercial financial institution using bonds debt financing capitalization table portrait pdf. Use them to share invaluable insights on pre money debt financing valuation, venture capitalist, private equity investors and impress your audience. This template can be altered and modified as per your expectations. So, grab it now.

Choosing The Right Financing Type Based On Total Costs And Parameters Pictures PDF
This slide shows the comparison of financing types that the company can opt based on certain parameters such as loan amount, interest rate, legal costs, appraisal costs, total borrowing costs etc. This is a choosing the right financing type based on total costs and parameters pictures pdf. template with various stages. Focus and dispense information on two stages using this creative set, that comes with editable features. It contains large content boxes to add your information on topics like legal costs, appraisal cost, total cost of borrowing. You can also showcase facts, figures, and other relevant content using this PPT layout. Grab it now.

Financial Banking PPT Valuation Summary Along With Stock Price Performance Ideas PDF
The slide provides the target companys valuation summary along with stock price performance 9in comparison with index, key valuation metrics and share price estimates by the brokers for Dec 2021. Deliver and pitch your topic in the best possible manner with this financial banking ppt valuation summary along with stock price performance ideas pdf. Use them to share invaluable insights on target, revenues, valuation metrics and impress your audience. This template can be altered and modified as per your expectations. So, grab it now.

User Onboarding Process Development Current Performance Of The Team Microsoft PDF
This slide provides the current performance of the company in comparison with industry average. Major KPIs covered in this are customer progression, customer response time, time to complete onboarding, product adoption rate, and escalation response time. This is a User Onboarding Process Development Current Performance Of The Team Microsoft PDF template with various stages. Focus and dispense information on three stages using this creative set, that comes with editable features. It contains large content boxes to add your information on topics like customer response rate, customer progression, product adoption rates. You can also showcase facts, figures, and other relevant content using this PPT layout. Grab it now.

Coverage Financial Ratios Chart For 5 Financial Years Themes PDF
This slide illustrates graph for coverage ratios that are interest coverage ratio, debt service coverage ratio and asset coverage ratio. It showcases comparison for a period of 5 years that can help company to measure ability to service its debt and meet its financial obligations Showcasing this set of slides titled coverage financial ratios chart for 5 financial years themes pdf. The topics addressed in these templates are coverage financial ratios chart for 5 financial years. All the content presented in this PPT design is completely editable. Download it and make adjustments in color, background, font etc. as per your unique business setting.

Mergers Acquisition Playbook Mergers Acquisition Playbook Post Merger Acquisition Performance Designs PDF
Following slide shows the comparison of current versus target capabilities of the firm post merger and acquisition. It includes information about the companys score as well as a performance rating.Deliver and pitch your topic in the best possible manner with this Mergers Acquisition Playbook Mergers Acquisition Playbook Post Merger Acquisition Performance Designs PDF Use them to share invaluable insights on Current Capabilities, Improvement Opportunities, Target Capabilities and impress your audience. This template can be altered and modified as per your expectations. So, grab it now.

New Product Sales Strategy And Marketing Touchpoints To Measure Campaign Microsoft PDF
Mentioned slide illustrates the performance comparison of companys touchpoint with respect to its competitor. Performance measurement is based on the feelings about touchpoint Vs impact on likelihood of purchase. Presenting New Product Sales Strategy And Marketing Touchpoints To Measure Campaign Microsoft PDF to provide visual cues and insights. Share and navigate important information on one stages that need your due attention. This template can be used to pitch topics like Service Levels, Conversion Rate, Campaign Performance. In addtion, this PPT design contains high resolution images, graphics, etc, that are easily editable and available for immediate download.

Film Making Firm Profile Competitive Assessment Based On Market Share Ppt PowerPoint Presentation Gallery Files PDF
This slide represents the film production house comparison with competitors based on market share which shows our leading company with greatest share in US market. Deliver and pitch your topic in the best possible manner with this Film Making Firm Profile Competitive Assessment Based On Market Share Ppt PowerPoint Presentation Gallery Files PDF. Use them to share invaluable insights on Key Insights, US Market Share, Market Share and impress your audience. This template can be altered and modified as per your expectations. So, grab it now.

Dashboard Showing Construction Project Metrics Sample PDF
This slide shows the dashboard which depicts the construction project management performance such as billing date, working profit, total cost, billed percentage, budget spent, completed projects and comparison of two companies about revenues earned from project. Showcasing this set of slides titled Dashboard Showing Construction Project Metrics Sample PDF. The topics addressed in these templates are Dashboard, Construction Project Metrics. All the content presented in this PPT design is completely editable. Download it and make adjustments in color, background, font etc. as per your unique business setting.
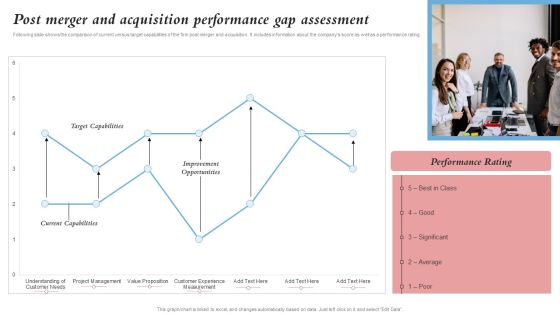
Post Merger And Acquisition Performance Gap Assessment Merger And Integration Procedure Topics PDF
Following slide shows the comparison of current versus target capabilities of the firm post merger and acquisition. It includes information about the companys score as well as a performance rating.Deliver and pitch your topic in the best possible manner with this Post Merger And Acquisition Performance Gap Assessment Merger And Integration Procedure Topics PDF. Use them to share invaluable insights on Target Capabilities, Current Capabilities, Improvement Opportunities and impress your audience. This template can be altered and modified as per your expectations. So, grab it now.

Commercial Property Administration And Advancement Property Valuation Approaches Rules PDF
Presenting commercial property administration and advancement property valuation approaches rules pdf to provide visual cues and insights. Share and navigate important information on three stages that need your due attention. This template can be used to pitch topics like market comparison approach, cost approach, income approach. In addtion, this PPT design contains high resolution images, graphics, etc, that are easily editable and available for immediate download.
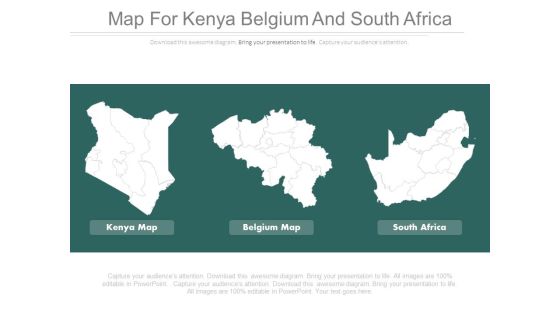
Maps For Kenya Belgium And South Africa Powerpoint Slides
This PowerPoint template has been designed with maps of Kenya, Belgium and South Africa. You may use this PPT slide depict area comparison of these three countries. Above slide provide ideal backdrop to make impressive presentations.

Comparison Report For Blog Hosting Website Ppt PowerPoint Presentation Inspiration Slideshow PDF
Pitch your topic with ease and precision using this comparison report for blog hosting website ppt powerpoint presentation inspiration slideshow pdf. This layout presents information on blog hosting website, premium, analytics, high quality photos, unlimited high definition data upload. It is also available for immediate download and adjustment. So, changes can be made in the color, design, graphics or any other component to create a unique layout.
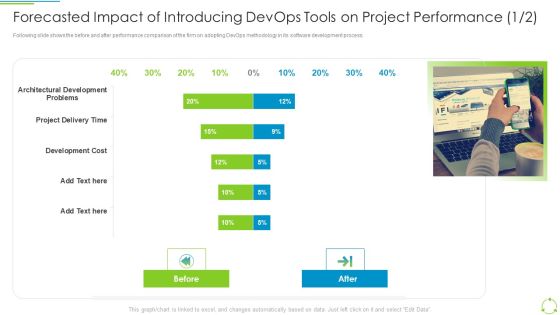
Executing Devops Framework Forecasted Impact Of Introducing Devops Tools Topics PDF
Following slide shows the before and after performance comparison of the firm on adopting DevOps methodology in its software development process. Deliver an awe inspiring pitch with this creative Executing Devops Framework Forecasted Impact Of Introducing Devops Tools Topics PDF bundle. Topics like Development Cost, Project Delivery Time, Architectural Development Problems can be discussed with this completely editable template. It is available for immediate download depending on the needs and requirements of the user.
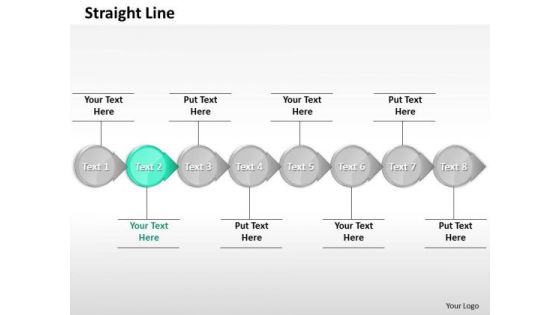
Ppt Interconnected Circular Arrows Horizontal Line 8 State Diagram Cyan PowerPoint Templates
PPT interconnected circular arrows horizontal line 8 state diagram cyan PowerPoint Templates-This PowerPoint Diagram shows you Correlated Circular Arrows in Horizontal Line which signifies step by step Execution, inter-related approaches etc.-PPT interconnected circular arrows horizontal line 8 state diagram cyan PowerPoint Templates-3d, Advertisement, Advertising, Arrow, Border, Business, Circles, Collection, Customer, Design, Element, Icon, Idea, Illustration, Info, Information, Isolated, Label, Light, Location, Needle, New, Notification, Notify, Point, Pointer, Promotion, Role, Rounded

Ppt Interconnected Synonym Arrows Horizontal Line 8 Stages Red PowerPoint Templates
PPT interconnected synonym arrows horizontal line 8 stages red PowerPoint Templates-This PowerPoint Diagram shows you Correlated Circular Arrows in Horizontal Line which signifies step by step Execution, inter-related approaches etc.-PPT interconnected synonym arrows horizontal line 8 stages red PowerPoint Templates-3d, Advertisement, Advertising, Arrow, Border, Business, Circles, Collection, Customer, Design, Element, Icon, Idea, Illustration, Info, Information, Isolated, Label, Light, Location, Needle, New, Notification, Notify, Point, Pointer, Promotion, Role, Rounded

Ppt Interrelated Circular Arrows PowerPoint 2010 Bee Line 8 Stages Green Templates
PPT interrelated circular arrows powerpoint 2010 bee line 8 stages green Templates-This PowerPoint Diagram shows you Correlated Circular Arrows in Horizontal Line which signifies step by step Execution, inter-related approaches etc.-PPT interrelated circular arrows powerpoint 2010 bee line 8 stages green Templates-3d, Advertisement, Advertising, Arrow, Border, Business, Circles, Collection, Customer, Design, Element, Icon, Idea, Illustration, Info, Information, Isolated, Label, Light, Location, Needle, New, Notification, Notify, Point, Pointer, Promotion, Role, Rounded
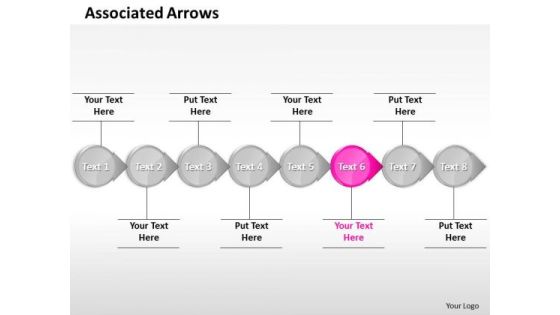
Ppt Intertwined Circular Arrows Straight Line 8 Stages Pink PowerPoint Templates
PPT intertwined circular arrows straight line 8 stages pink PowerPoint Templates-This PowerPoint Diagram shows you Correlated Circular Arrows in Horizontal Line which signifies step by step Execution, inter-related approaches etc.-PPT intertwined circular arrows straight line 8 stages pink PowerPoint Templates-3d, Advertisement, Advertising, Arrow, Border, Business, Circles, Collection, Customer, Design, Element, Icon, Idea, Illustration, Info, Information, Isolated, Label, Light, Location, Needle, New, Notification, Notify, Point, Pointer, Promotion, Role, Rounded

Ppt Invariable Circular Arrows PowerPoint Templates Bee Line 8 Stages Purple
PPT invariable circular arrows powerpoint templates bee line 8 stages purple-This PowerPoint Diagram shows you Correlated Circular Arrows in Horizontal Line which signifies step by step Execution, inter-related approaches etc.-PPT invariable circular arrows powerpoint templates bee line 8 stages purple-3d, Advertisement, Advertising, Arrow, Border, Business, Circles, Collection, Customer, Design, Element, Icon, Idea, Illustration, Info, Information, Isolated, Label, Light, Location, Needle, New, Notification, Notify, Point, Pointer, Promotion, Role, Rounded
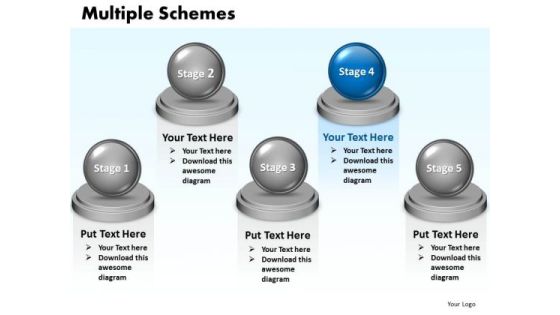
Ppt Multiple Schemes Diagram 5 Stages Presentation PowerPoint Tips 0812 Templates
PPT multiple schemes diagram 5 stages presentation powerpoint tips 0812 Templates-Use this circular implementation PPT slide to represent a series of interconnected ideas. Use this circular PPT abstraction to establish a link between your personal methodology and action research possibilities. -PPT multiple schemes diagram 5 stages presentation powerpoint tips 0812 Templates-3d, Abstract, Backgrounds, Ball, Business, Choice, Comparison, Concept, Descriptive, Equilibrium, Grow, Illustrations, Instrument, Measurement, Metallic, Part, Partnership, Pattern, Progress, Reflections, Scales, Several, Sphere, Strategy, Success

Project QA Through Agile Methodology IT Selecting The Suitable Agile Model Formats PDF
Mentioned table provides information on different agile models. Here the comparison is based on parameters namely goal workflow approach, coding standards, testing approach and design complexity. This is a Project QA Through Agile Methodology IT Selecting The Suitable Agile Model Formats PDF template with various stages. Focus and dispense information on four stages using this creative set, that comes with editable features. It contains large content boxes to add your information on topics like Extreme Programming, Coding Standards, Design Complexity You can also showcase facts, figures, and other relevant content using this PPT layout. Grab it now.

Maintaining Customer Relations Financial Statement Comparison Productivity Metrics Ppt PowerPoint Presentation Infographics Graphic Images
This is a maintaining customer relations financial statement comparison productivity metrics ppt powerpoint presentation infographics graphic images. This is a six stage process. The stages in this process are maintaining customer relations, financial statement comparison, productivity metrics.
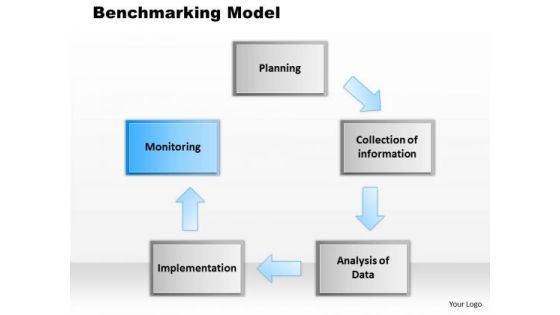
Business Framework Benchmarking Model PowerPoint Presentation
This power point diagram slide has been crafted with graphic of benchmark model. This model is a improvement model and used for risk management. This model is usable for systematic comparison of organizational processes and performance to get new standards to improve processes. Explain industrial or functional benchmarking with this B-model. Use this diagram slide for business and finance related presentations.

Rad Model Vs Traditional Sdlc Rapid Application Building RAB Model Template PDF
This slide describes a comparison between the RAD model and the traditional SDLC model based on stages, approach, changes, documentation, and requirements. This modern and well arranged Rad Model Vs Traditional Sdlc Rapid Application Building RAB Model Template PDF provides lots of creative possibilities. It is very simple to customize and edit with the Powerpoint Software. Just drag and drop your pictures into the shapes. All facets of this template can be edited with Powerpoint no extra software is necessary. Add your own material, put your images in the places assigned for them, adjust the colors, and then you can show your slides to the world, with an animated slide included.

Agile Unified Procedure It Determine Architecture Essentials In Essup Designs PDF
This slide provides information regarding architecture essential in essential unified process in terms of objective, key considerations and key competencies. Presenting agile unified procedure it comparison diagrams pdf to provide visual cues and insights. Share and navigate important information on three stages that need your due attention. This template can be used to pitch topics like comparison. In addtion, this PPT design contains high resolution images, graphics, etc, that are easily editable and available for immediate download.
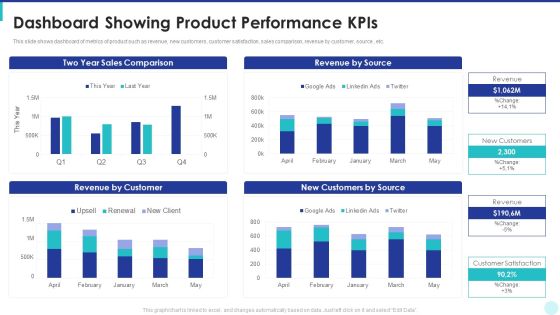
Optimization Of Product Development Life Cycle Dashboard Showing Product Performance Kpis Topics PDF
This slide shows dashboard of metrics of product such as revenue, new customers, customer satisfaction, sales comparison, revenue by customer, source , etc. Deliver an awe inspiring pitch with this creative optimization of product development life cycle dashboard showing product performance kpis topics pdf bundle. Topics like sales comparison, revenue by source, revenue by customer, customers by source can be discussed with this completely editable template. It is available for immediate download depending on the needs and requirements of the user.
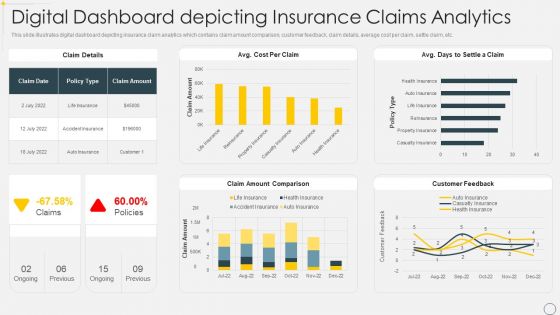
Digital Dashboard Depicting Insurance Claims Analytics Pictures PDF
This slide illustrates digital dashboard depicting insurance claim analytics which contains claim amount comparison, customer feedback, claim details, average cost per claim, settle claim, etc. Showcasing this set of slides titled Digital Dashboard Depicting Insurance Claims Analytics Pictures PDF. The topics addressed in these templates are Policy, Cost, Comparison. All the content presented in this PPT design is completely editable. Download it and make adjustments in color, background, font etc. as per your unique business setting.

Departments Of Visualization Research Sales Performance Dashboard After Visualization Sample PDF
This slide depicts the dashboard for sales performance after the implementation of visualization research based on revenue, quantity, regional sales.Deliver an awe inspiring pitch with this creative Departments Of Visualization Research Sales Performance Dashboard After Visualization Sample PDF bundle. Topics like Revenue Comparison, Quantity Comparison, Category Select can be discussed with this completely editable template. It is available for immediate download depending on the needs and requirements of the user.

Creating Successful Strategies To Enhance Customer Experience Customer Engagement Analytical Dashboard Slides PDF
This slide shows customer engagement analytical dashboard that covers total sales, total transaction, email received, links clicked, unique customer sales, sales comparison, customers name, product list, etc.Deliver an awe inspiring pitch with this creative Creating Successful Strategies To Enhance Customer Experience Customer Engagement Analytical Dashboard Slides PDF bundle. Topics like Sales Comparison, Engagement Performance, Customer Sales can be discussed with this completely editable template. It is available for immediate download depending on the needs and requirements of the user.

Services Marketing Sales Future Of Services Managed By Firm Ppt Professional Information PDF
This slide caters details about future of services managed by firm with details about firms overall future strategy. This is a services marketing sales future of services managed by firm ppt professional information pdf template with various stages. Focus and dispense information on three stages using this creative set, that comes with editable features. It contains large content boxes to add your information on topics like data correlation, integration, predictive analytics, cloud computing technology. You can also showcase facts, figures, and other relevant content using this PPT layout. Grab it now.

Reaching At Every Stage Of Consumer Purchasing Process Ppt PowerPoint Presentation File Infographic Template PDF
Presenting reaching at every stage of consumer purchasing process ppt powerpoint presentation file infographic template pdf to dispense important information. This template comprises five stages. It also presents valuable insights into the topics including awareness, retention, comparison. This is a completely customizable PowerPoint theme that can be put to use immediately. So, download it and address the topic impactfully.

Building Innovation Capabilities And USP Detection Sales Dashboard Ppt Diagram Templates PDF
Show your highlights of sale through our dashboard. Deliver an awe-inspiring pitch with this creative building innovation capabilities and usp detection sales dashboard ppt diagram templates pdf bundle. Topics like top products revenue, product sale comparison, incremental sales campaign can be discussed with this completely editable template. It is available for immediate download depending on the needs and requirements of the user.

Application Lifecycle Management ALM How Much Will It Cost To Replace The Asset Template PDF
Presenting this set of slides with name application lifecycle management alm how much will it cost to replace the asset template pdf. The topics discussed in these slides are cost, assets, replacement, comparison. This is a completely editable PowerPoint presentation and is available for immediate download. Download now and impress your audience.

Customer Journey Awareness Research Comparison Purchase Ppt PowerPoint Presentation Professional Slides
This is a customer journey awareness research comparison purchase ppt powerpoint presentation professional slides. This is a five stage process. The stages in this process are retain, retention.

Books And Laptop Education PowerPoint Templates And PowerPoint Themes 1012
Books And Laptop Education PowerPoint Templates And PowerPoint Themes 1012-This PowerPoint Template shows the Laptop and books on the either side of the See-Saw to weigh which one is heavy in every respect. It portrays the concept of Networking, Communication etc. It imitates the comparison between studying through books and laptop. Forward thinking is the way to go. Use our templates to emphasize your views.-Books And Laptop Education PowerPoint Templates And PowerPoint Themes 1012-This PowerPoint template can be used for presentations relating to-Books and laptop, education, people, technology, future, computer

Data Lineage Implementation Coarse Grained Vs Fine Grained Data Lineage Icons PDF
Slide depicts the comparison between coarse-grained and fine-grained data lineage that involves the degree of data lineage a user can access. The coarse-grained lineage explains the interrelations between information pipelines, databases and tables. From laying roadmaps to briefing everything in detail, our templates are perfect for you. You can set the stage with your presentation slides. All you have to do is download these easy to edit and customizable templates. Data Lineage Implementation Coarse Grained Vs Fine Grained Data Lineage Icons PDF will help you deliver an outstanding performance that everyone would remember and praise you for. Do download this presentation today.

Green Upward Arrow Showing Forecast Comparison Ppt PowerPoint Presentation Ideas Examples
Presenting this set of slides with name green upward arrow showing forecast comparison ppt powerpoint presentation ideas examples. This is a two stage process. The stages in this process are green upward arrow showing forecast comparison. This is a completely editable PowerPoint presentation and is available for immediate download. Download now and impress your audience.

Area Chart For Product Performance Comparison Ppt PowerPoint Presentation Outline Slide Portrait
Presenting this set of slides with name area chart for product performance comparison ppt powerpoint presentation outline slide portrait. The topics discussed in these slide is area chart for product performance comparison. This is a completely editable PowerPoint presentation and is available for immediate download. Download now and impress your audience.

Current State And Future State Comparison Ppt PowerPoint Presentation Pictures Design Ideas
Presenting this set of slides with name current state and future state comparison ppt powerpoint presentation pictures design ideas. This is a two stage process. The stages in this process are current state, future state, comparison. This is a completely editable PowerPoint presentation and is available for immediate download. Download now and impress your audience.

Performance Assessment Sales Initiative Report Sales Comparison Year Over Year Ppt Professional Design Ideas PDF
Presenting this set of slides with name performance assessment sales initiative report sales comparison year over year ppt professional design ideas pdf. The topics discussed in these slide is sales comparison year over year. This is a completely editable PowerPoint presentation and is available for immediate download. Download now and impress your audience.
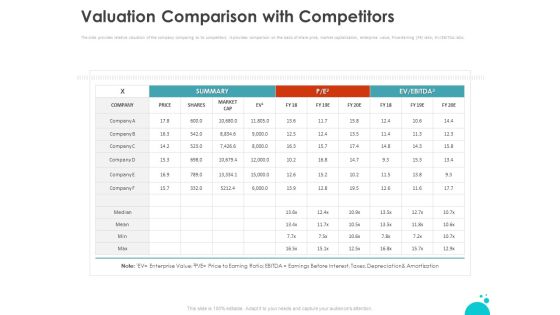
Investment Pitch For Aftermarket Valuation Comparison With Competitors Ppt PowerPoint Presentation Model Show PDF
Presenting this set of slides with name investment pitch for aftermarket valuation comparison with competitors ppt powerpoint presentation model show pdf. The topics discussed in these slides are valuation comparison, competitors. This is a completely editable PowerPoint presentation and is available for immediate download. Download now and impress your audience.

 Home
Home