AI PPT Maker
Templates
PPT Bundles
Design Services
Business PPTs
Business Plan
Management
Strategy
Introduction PPT
Roadmap
Self Introduction
Timelines
Process
Marketing
Agenda
Technology
Medical
Startup Business Plan
Cyber Security
Dashboards
SWOT
Proposals
Education
Pitch Deck
Digital Marketing
KPIs
Project Management
Product Management
Artificial Intelligence
Target Market
Communication
Supply Chain
Google Slides
Research Services
 One Pagers
All Categories
-
Home
- Customer Favorites
- Communications Calendar
Communications Calendar

Customer Relationship Management Action Plan CRM Goals Diagrams PDF
Presenting customer relationship management action plan crm goals diagrams pdf to provide visual cues and insights. Share and navigate important information on six stages that need your due attention. This template can be used to pitch topics like improved customer satisfaction, improve the efficiency of your business, expand your customer base. In addtion, this PPT design contains high resolution images, graphics, etc, that are easily editable and available for immediate download.

Bubble Ppt PowerPoint Presentation Guidelines
This is a bubble ppt powerpoint presentation guidelines. This is a five stage process. The stages in this process are bubble, business, bar graph, marketing, presentation.

Area Ppt PowerPoint Presentation Show
This is a area ppt powerpoint presentation show. This is a two stage process. The stages in this process are area, bar graph, growth, years, business.

Strategic And Planning Powerpoint Guide
This is a strategic and planning powerpoint guide. This is a nine stage process. The stages in this process are direct procurement, human resources, marketing and sales, delivery and after sale, indirect procurement, budgeting planning, design and development, strategic and planning, compliance and risk management.

Illustration Of Team Planning For Growth Powerpoint Templates
Visually support your presentation with our above template showing team planning icons. This slide has been professionally designed to define team planning process. This template offers an excellent background to build impressive presentation.
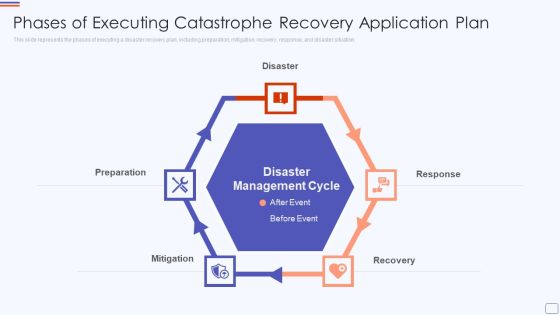
Phases Of Executing Catastrophe Recovery Application Plan Designs PDF
This slide represents the phases of executing a disaster recovery plan, including preparation, mitigation, recovery, response, and disaster situation. Presenting phases of executing catastrophe recovery application plan designs pdf to provide visual cues and insights. Share and navigate important information on five stages that need your due attention. This template can be used to pitch topics like disaster, response, recovery, mitigation, preparation. In addtion, this PPT design contains high resolution images, graphics, etc, that are easily editable and available for immediate download.
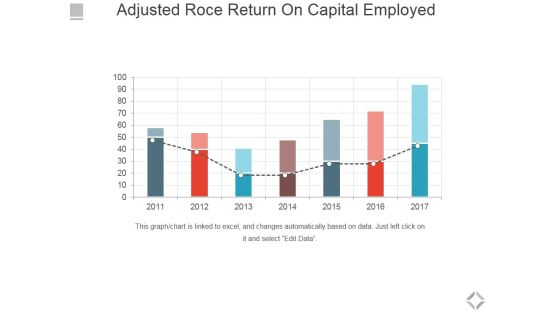
Adjusted Roce Return On Capital Employed Template 1 Ppt PowerPoint Presentation Layouts Themes
This is a adjusted roce return on capital employed template 1 ppt powerpoint presentation layouts themes. This is a seven stage process. The stages in this process are business, marketing, success, planning, management.
Adjusted Roce Return On Capital Employed Template 2 Ppt PowerPoint Presentation Icon Backgrounds
This is a adjusted roce return on capital employed template 2 ppt powerpoint presentation icon backgrounds. This is a five stage process. The stages in this process are business, marketing, success, planning, management.

Launch Plan At A Glance Ppt PowerPoint Presentation Samples
This is a launch plan at a glance ppt powerpoint presentation samples. This is a seven stage process. The stages in this process are ideation, business model, customer discovery, product design, launch, market planning, development.
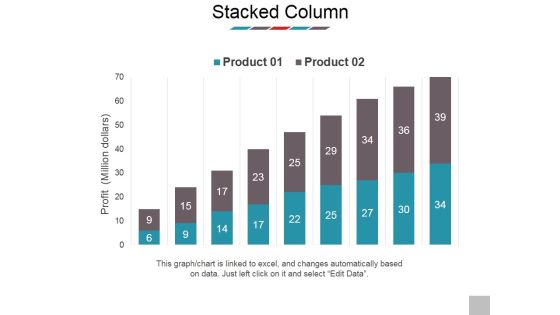
Stacked Column Ppt PowerPoint Presentation Professional Deck
This is a stacked column ppt powerpoint presentation professional deck. This is a two stage process. The stages in this process are profit, business, marketing, presentation, product.

Financial Ppt PowerPoint Presentation File Infographic Template
This is a financial ppt powerpoint presentation file infographic template. This is a five stage process. The stages in this process are financial, business, marketing, presentation, success.

Crm Dashboard Kpis Ppt PowerPoint Presentation Pictures
This is a crm dashboard kpis ppt powerpoint presentation pictures. This is a five stage process. The stages in this process are revenue, acquisition, active subscribers.

Bar Graph Ppt PowerPoint Presentation Background Images
This is a bar graph ppt powerpoint presentation background images. This is a twelve stage process. The stages in this process are bar graph, months, finance, growth, success.

Bar Graph Ppt PowerPoint Presentation Professional
This is a bar graph ppt powerpoint presentation professional. This is a five stage process. The stages in this process are business, bar graph, strategy, growth, success.

Campaign Performance Ppt PowerPoint Presentation Deck
This is a campaign performance ppt powerpoint presentation deck. This is a four stage process. The stages in this process are business, bar graph, strategy, growth, success.

Bar Graph Ppt PowerPoint Presentation Diagrams
This is a bar graph ppt powerpoint presentation diagrams. This is a nine stage process. The stages in this process are business, marketing, success, management, growth.

Real Estate Rents Ppt PowerPoint Presentation Ideas
This is a real estate rents ppt powerpoint presentation ideas. This is a one stage process. The stages in this process are business, marketing, success, management, growth.

Clustered Bar Ppt PowerPoint Presentation Good
This is a clustered bar ppt powerpoint presentation good. This is a five stage process. The stages in this process are product, circular, business, marketing, bar graph.

Clustered Column Line Ppt PowerPoint Presentation Backgrounds
This is a clustered column line ppt powerpoint presentation backgrounds. This is a four stage process. The stages in this process are fire, earthquake, axis title, in percentage.

Disaster Statistics Ppt PowerPoint Presentation Graphics
This is a disaster statistics ppt powerpoint presentation graphics. This is a seven stage process. The stages in this process are people displaced, weather, geophysical.
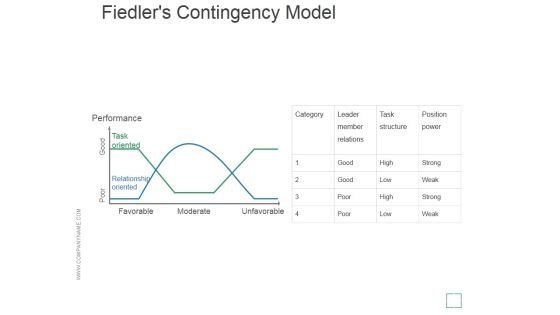
Fiedlers Contingency Model Ppt PowerPoint Presentation Templates
This is a fiedlers contingency model ppt powerpoint presentation templates. This is a one stage process. The stages in this process are performance, poor, good, favorable, moderate.

Staked Line Ppt PowerPoint Presentation Example
This is a staked line ppt powerpoint presentation example. This is a three stage process. The stages in this process are in million, product.
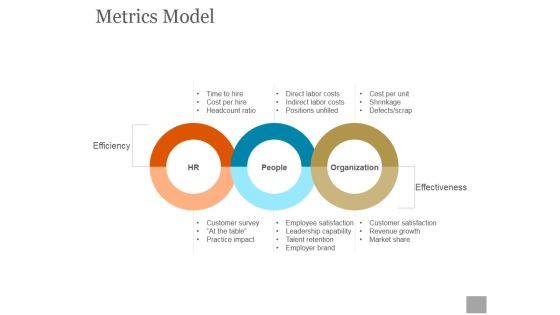
Metrics Model Ppt PowerPoint Presentation Guidelines
This is a metrics model ppt powerpoint presentation guidelines. This is a three stage process. The stages in this process are hr, people, organization, efficiency, effectiveness.

Clustered Bar Ppt PowerPoint Presentation Template
This is a clustered bar ppt powerpoint presentation template. This is a five stage process. The stages in this process are product, clustered bar, business, marketing, bar graph.
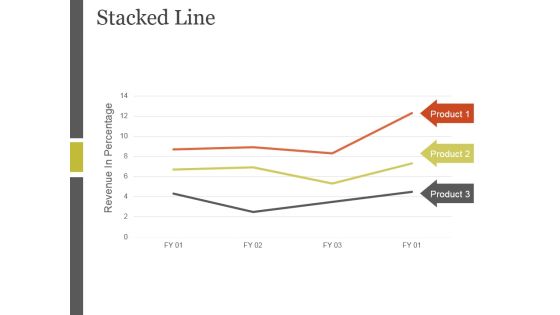
Stacked Line Ppt PowerPoint Presentation Inspiration
This is a stacked line ppt powerpoint presentation inspiration. This is a three stage process. The stages in this process are revenue in percentage, stacked line, product.

Crm Dashboard Kpis Ppt PowerPoint Presentation Rules
This is a crm dashboard kpis ppt powerpoint presentation rules. This is a three stage process. The stages in this process are revenue, acquisition, active subscribers.

Annual Run Rate Ppt PowerPoint Presentation Icon
This is a annual run rate ppt powerpoint presentation icon. This is a four stage process. The stages in this process are annual run rate, product.

Bar Graph Ppt PowerPoint Presentation Summary Skills
This is a bar graph ppt powerpoint presentation summary skills. This is a three stage process. The stages in this process are bar graph, business, marketing, success, growth.

Capital Spending Ppt PowerPoint Presentation Infographics Show
This is a capital spending ppt powerpoint presentation infographics show. This is a two stage process. The stages in this process are capital spending, financials, business, marketing, growth.

Financial Report Ppt PowerPoint Presentation Styles Skills
This is a financial report ppt powerpoint presentation styles skills. This is a four stage process. The stages in this process are bar graph, business, marketing, success, growth.

Financial Strength Ppt PowerPoint Presentation Summary Ideas
This is a financial strength ppt powerpoint presentation summary ideas. This is a four stage process. The stages in this process are bar graph, business, marketing, success, growth.

Bar Graph Ppt PowerPoint Presentation Portfolio Background
This is a bar graph ppt powerpoint presentation portfolio background. This is a four stage process. The stages in this process are sale, years, product.
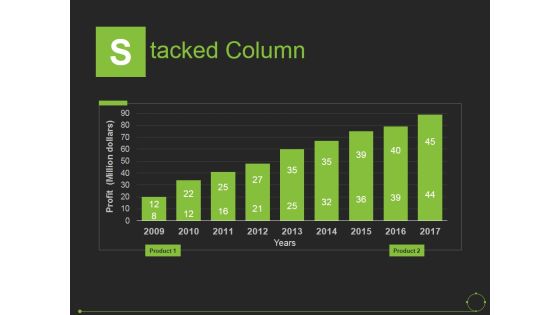
Stacked Column Ppt PowerPoint Presentation Slides Introduction
This is a stacked column ppt powerpoint presentation slides introduction. This is a nine stage process. The stages in this process are years, profit, product, business, marketing.

Bar Graph Ppt PowerPoint Presentation Portfolio Vector
This is a bar graph ppt powerpoint presentation portfolio vector. This is a nine stage process. The stages in this process are business, marketing, graph, finance, growth.
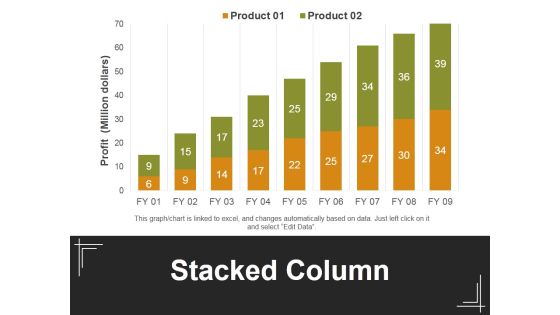
Stacked Column Ppt PowerPoint Presentation Outline Maker
This is a stacked column ppt powerpoint presentation outline maker. This is a two stage process. The stages in this process are profit, stacked bar, product, business, marketing.
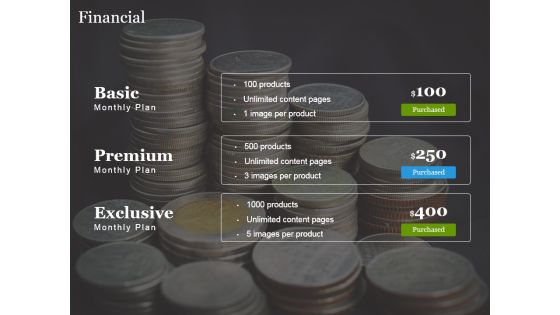
Financial Ppt PowerPoint Presentation Show Microsoft
This is a financial ppt powerpoint presentation show microsoft. This is a three stage process. The stages in this process are basic, premium, exclusive, purchased.

Financial Ppt PowerPoint Presentation File Grid
This is a financial ppt powerpoint presentation file grid. This is a three stage process. The stages in this process are beginner, advanced, professional.
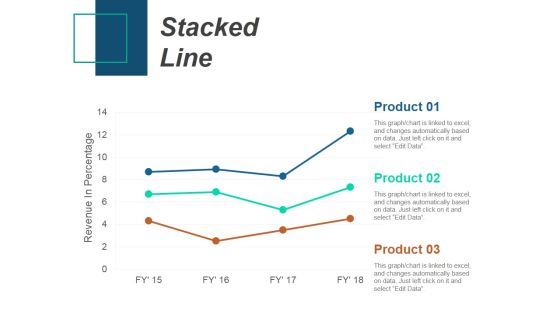
Stacked Line Ppt PowerPoint Presentation Infographics Slideshow
This is a stacked line ppt powerpoint presentation infographics slideshow. This is a three stage process. The stages in this process are stacked line, revenue in percentage, product.

Financial Ppt PowerPoint Presentation Ideas Shapes
This is a financial ppt powerpoint presentation ideas shapes. This is a three stage process. The stages in this process are financial, strategy, business, marketing, success.

Bar Graph Ppt PowerPoint Presentation Ideas Objects
This is a bar graph ppt powerpoint presentation ideas objects. This is a four stage process. The stages in this process are management, business, marketing, bar graph, success.
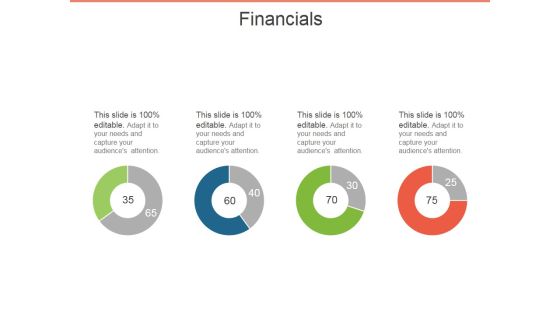
Financials Ppt PowerPoint Presentation Model Background
This is a financials ppt powerpoint presentation model background. This is a four stage process. The stages in this process are financials, business, process, marketing, success.
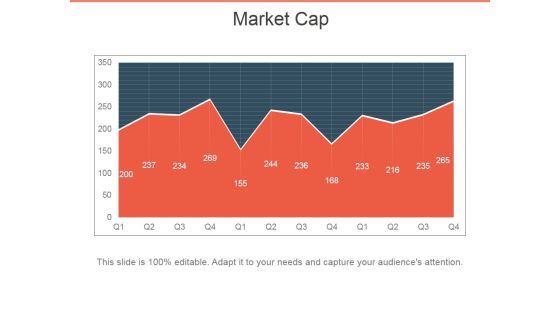
Market Cap Ppt PowerPoint Presentation File Display
This is a market cap ppt powerpoint presentation file display. This is a two stage process. The stages in this process are market cap, business, marketing, success, graph.
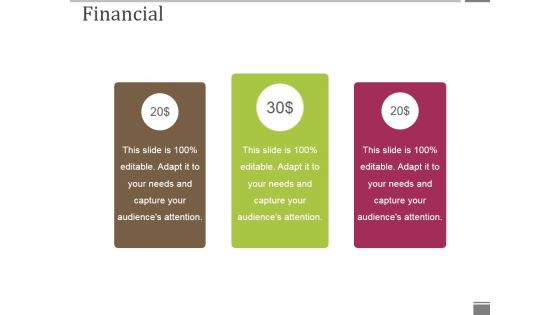
Financial Ppt PowerPoint Presentation Slides Inspiration
This is a financial ppt powerpoint presentation slides inspiration. This is a three stage process. The stages in this process are financial, business, marketing, management, sales.

Industry Snapshot Ppt PowerPoint Presentation Styles Microsoft
This is a industry snapshot ppt powerpoint presentation styles microsoft. This is a two stage process. The stages in this process are employment, revenue, bar, marketing, success.

Comparison Ppt PowerPoint Presentation Outline Guidelines
This is a comparison ppt powerpoint presentation outline guidelines. This is a two stage process. The stages in this process are male, years, business, female, marketing.
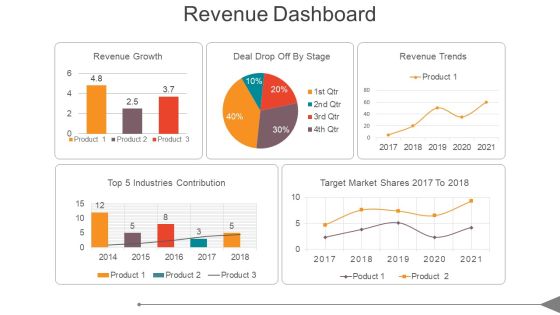
Revenue Dashboard Ppt PowerPoint Presentation Show
This is a revenue dashboard ppt powerpoint presentation show. This is a five stage process. The stages in this process are top 5 industries contribution, revenue growth, deal drop off by stage, revenue trends, target market shares 2017 to 2018.
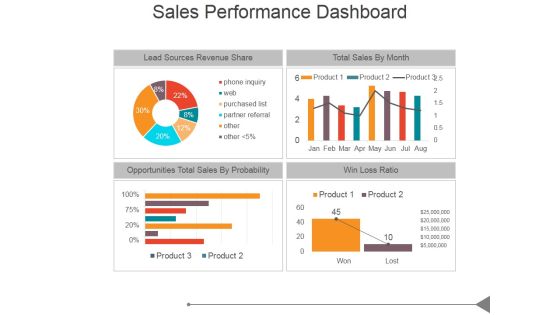
Sales Performance Dashboard Ppt PowerPoint Presentation Good
This is a sales performance dashboard ppt powerpoint presentation good. This is a four stage process. The stages in this process are lead sources revenue share, total sales by month, opportunities total sales by probability, win loss ratio.

Real Estate Demand Ppt PowerPoint Presentation Graphics
This is a real estate demand ppt powerpoint presentation graphics. This is a four stage process. The stages in this process are fundamental factors for expected to drive growth, residential, square feet in millions.

Crm Dashboard Ppt PowerPoint Presentation Good
This is a crm dashboard ppt powerpoint presentation good. This is a five stage process. The stages in this process are open tickets, new orders, closed tickets, new clients, week income.
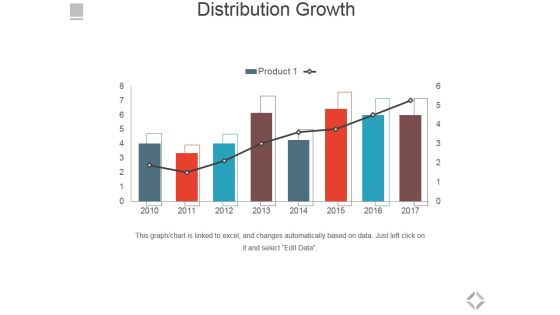
Distribution Growth Ppt PowerPoint Presentation Slides Clipart
This is a distribution growth ppt powerpoint presentation slides clipart. This is a eight stage process. The stages in this process are distribution growth, bar graph, business, marketing, success.

Bar Graph Ppt PowerPoint Presentation File Vector
This is a bar graph ppt powerpoint presentation file vector. This is a four stage process. The stages in this process are in percentage, bar graph, growth, business, process.

Bar Graph Ppt PowerPoint Presentation Gallery Skills
This is a bar graph ppt powerpoint presentation gallery skills. This is a four stage process. The stages in this process are in percentage, bar graph, business, marketing, product.

Competitor Positioning Ppt PowerPoint Presentation Infographics Gridlines
This is a competitor positioning ppt powerpoint presentation infographics gridlines. This is a two stage process. The stages in this process are competitor positioning, company, growth, market growth, business, marketing.

Bar Graph Ppt PowerPoint Presentation Model Clipart
This is a bar graph ppt powerpoint presentation model clipart. This is a six stage process. The stages in this process are sales in percentage, product, bar graph, business, marketing.
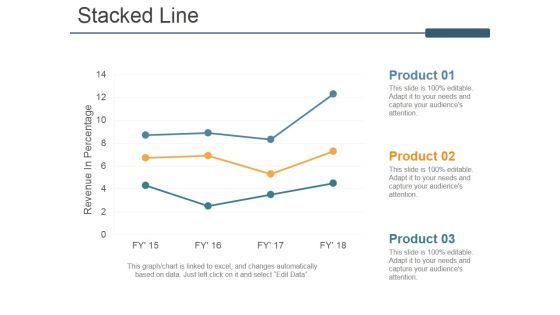
Stacked Line Ppt PowerPoint Presentation Ideas Model
This is a stacked line ppt powerpoint presentation ideas model. This is a three stage process. The stages in this process are revenue in percentage, stacked line, product, business, marketing.
Employee Turnover Ppt PowerPoint Presentation Gallery Icons
This is a employee turnover ppt powerpoint presentation gallery icons. This is a one stage process. The stages in this process are turnover, rate, number of employee separations during the year, total number of employees during the year.

Bar Graph Ppt PowerPoint Presentation Outline Layout
This is a bar graph ppt powerpoint presentation outline layout. This is a four stage process. The stages in this process are sales in percentage, product, bar graph, business, marketing.

Bar Graph Ppt PowerPoint Presentation Professional Guide
This is a bar graph ppt powerpoint presentation professional guide. This is a eight stage process. The stages in this process are axis title, bar graph, business, marketing, management.
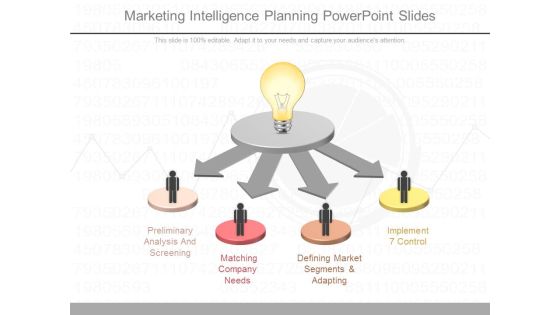
Marketing Intelligence Planning Powerpoint Slides
This is a marketing intelligence planning powerpoint slides. This is a four stage process. The stages in this process are preliminary analysis and screening, matching company needs, defining market segments and adapting, implement 7 control.

Business Strategy Development Process Business Plan Product Graphics PDF
Presenting business strategy development process business plan product graphics pdf to provide visual cues and insights. Share and navigate important information on three stages that need your due attention. This template can be used to pitch topics like product development, marketing and sales, customer service. In addtion, this PPT design contains high resolution images, graphics, etc, that are easily editable and available for immediate download.
