Client Management
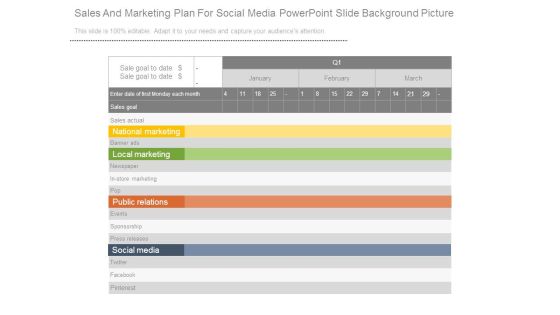
Sales And Marketing Plan For Social Media Powerpoint Slide Background Picture
This is a sales and marketing plan for social media powerpoint slide background picture. This is a three stage process. The stages in this process are national marketing, local marketing, public relations, social media.
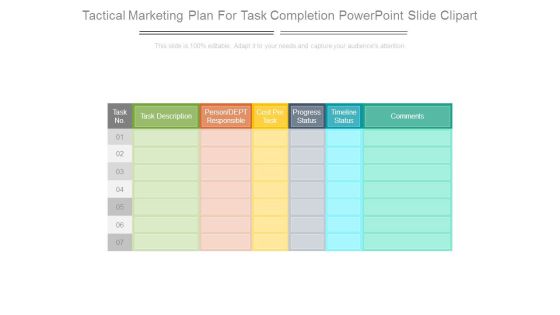
Tactical Marketing Plan For Task Completion Powerpoint Slide Clipart
This is a tactical marketing plan for task completion powerpoint slide clipart. This is a seven stage process. The stages in this process are task description, person dept responsible, cost per task, progress task, timeline status, comments.
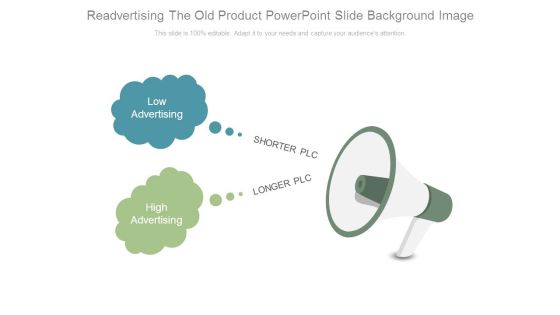
Readvertising The Old Product Powerpoint Slide Background Image
This is a readvertising the old product powerpoint slide background image. This is a two stage process. The stages in this process are low advertising, high advertising, shorter plc, longer plc.
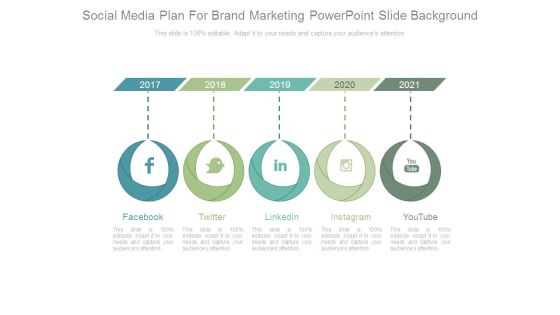
Social Media Plan For Brand Marketing Powerpoint Slide Background
This is a social media plan for brand marketing powerpoint slide background. This is a five stage process. The stages in this process are facebook, twitter, linkedin, instagram, youtube.
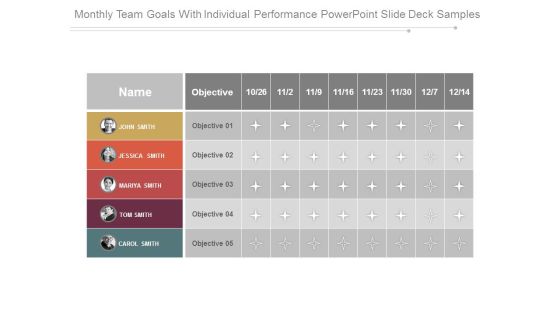
Monthly Team Goals With Individual Performance Powerpoint Slide Deck Samples
This is a monthly team goals with individual performance powerpoint slide deck samples. This is a five stage process. The stages in this process are name, objective, john smith, jessica smith, mariya smith, tom smith, carol smith.
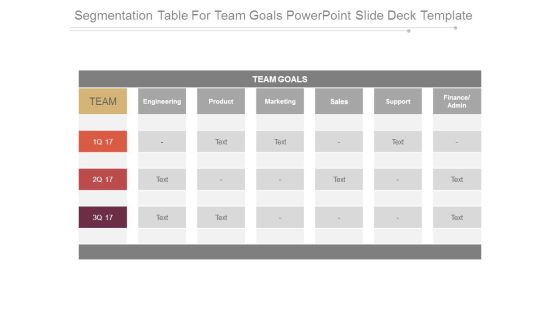
Segmentation Table For Team Goals Powerpoint Slide Deck Template
This is a segmentation table for team goals powerpoint slide deck template. This is a six stage process. The stages in this process are team goals, team, engineering, product, marketing, sales, support, finance admin.
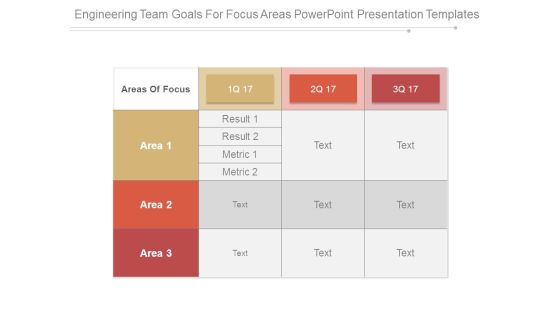
Engineering Team Goals For Focus Areas Powerpoint Presentation Templates
This is a engineering team goals for focus areas powerpoint presentation templates. This is a three stage process. The stages in this process are areas of focus, area, result, metric.

Curve Chart For Product Life Cycle Presentation Outline
This is a curve chart for product life cycle presentation outline. This is a five stage process. The stages in this process are sales over time, product extension, introduction, growth, maturity, decline, time.
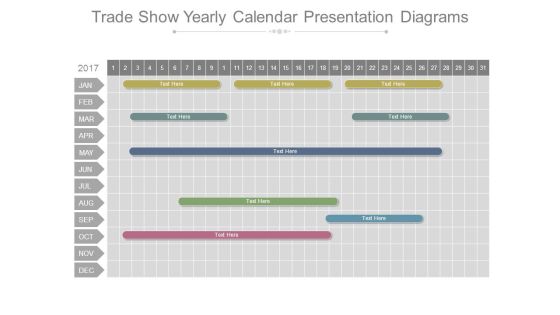
Trade Show Yearly Calendar Presentation Diagrams
This is a trade show yearly calendar presentation diagrams. This is a six stage process. The stages in this process are jan, feb, mar, apr, may, jun, jul, aug, sep, oct, nov, dec.
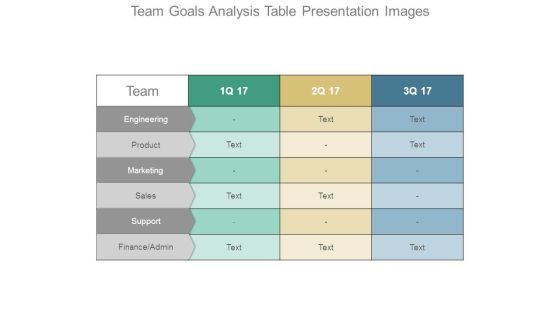
Team Goals Analysis Table Presentation Images
This is a team goals analysis table presentation images. This is a three stage process. The stages in this process are team, engineering, product, marketing, sales, support, finance admin.

Team Goals For Company Success Presentation Layouts
This is a team goals for company success presentation layouts. This is a five stage process. The stages in this process are name, objective, john smith, jessica smith, mariya smith, tom smith, carol smith.

Area Of Focus With Team Goals Ppt Slide Examples
This is a area of focus with team goals ppt slide examples. This is a three stage process. The stages in this process are areas of focus, area, result, matric, text.
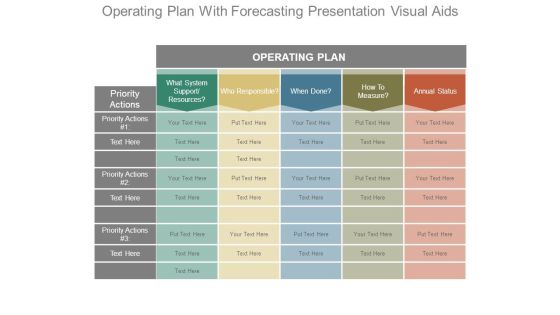
Operating Plan With Forecasting Presentation Visual Aids
This is a operating plan with forecasting presentation visual aids. This is a five stage process. The stages in this process are operating plan, what system support resources, who responsible, when done, how to measure, annual status, priority actions.

Different Team Goals For Growth Powerpoint Shapes
This is a different team goals for growth powerpoint shapes. This is a three stage process. The stages in this process are team, engineering, product, marketing, sales, support, finance admin.

Product Roadmap Product Launch Deliverables Gantt Chart Ppt Example
This is a product roadmap product launch deliverables gantt chart ppt example. This is a three stage process. The stages in this process are product launch deliverables, product family, product.

Team Goals With Performance Analysis Ppt Images
This is a team goals with performance analysis ppt images. This is a five stage process. The stages in this process are name, john smith, jessica smith, mariya smith, tom smith, carol smith, objective.
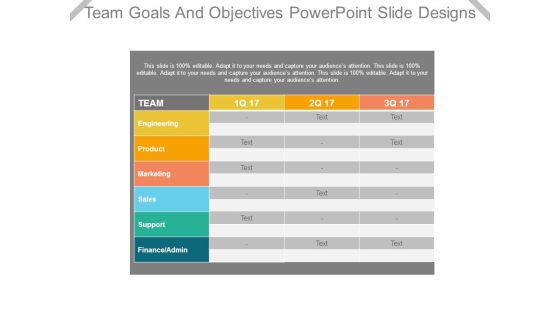
Team Goals And Objectives Powerpoint Slide Designs
This is a team goals and objectives powerpoint slide designs. This is a three stage process. The stages in this process are team, engineering, product, marketing, sales, support, finance admin.
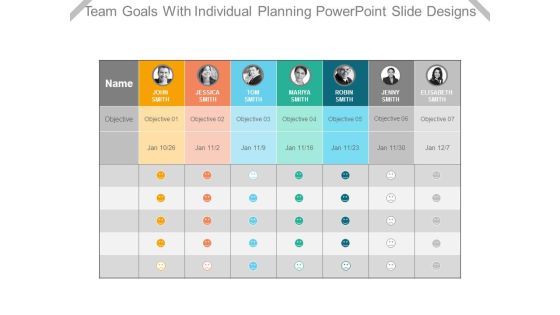
Team Goals With Individual Planning Powerpoint Slide Designs
This is a team goals with individual planning powerpoint slide designs. This is a seven stage process. The stages in this process are john smith, jessica smith, tom smith, mariya smith, robin smith, jenny smith, elisabeth smith, objective, name, jan.
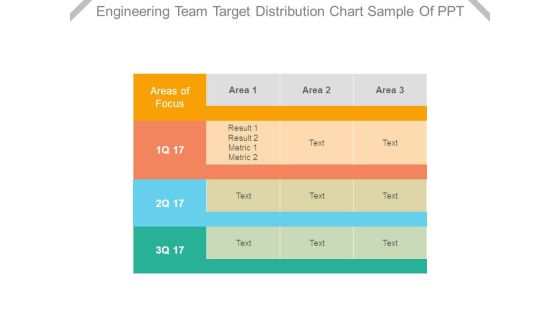
Engineering Team Target Distribution Chart Sample Of Ppt
This is a engineering team target distribution chart sample of ppt. This is a three stage process. The stages in this process are areas of focus, area, result, metric.
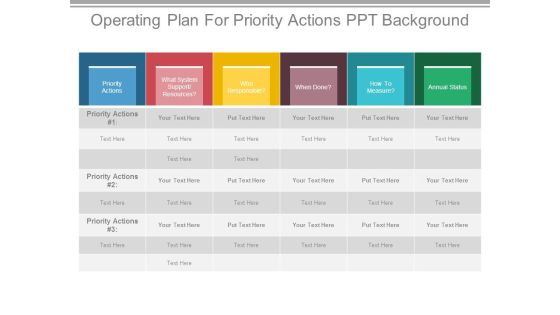
Operating Plan For Priority Actions Ppt Background
This is a operating plan for priority actions ppt background. This is a six stage process. The stages in this process are priority actions, what system support resources, who responsible, when done, annual status.

Operation Cost Priority Action Ppt Background Designs
This is a operation cost priority action ppt background designs. This is a four stage process. The stages in this process are fixed asset cost rm, monthly expenses rm, other expenses rm.
Sales Summary Base Plan Vs Stretch Plan Ppt Icon
This is a sales summary base plan vs stretch plan ppt icon. This is a three stage process. The stages in this process are base plan, stretch plan, comments.
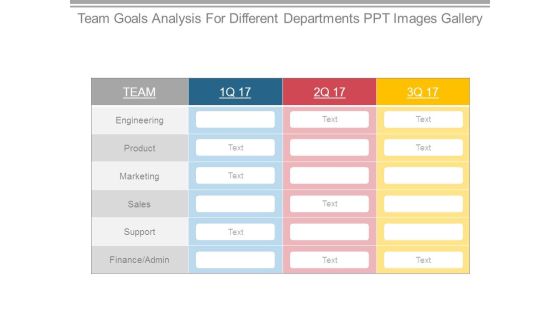
Team Goals Analysis For Different Departments Ppt Images Gallery
This is a team goals analysis for different departments ppt images gallery. This is a three stage process. The stages in this process are engineering, product, marketing, sales, support, finance admin.
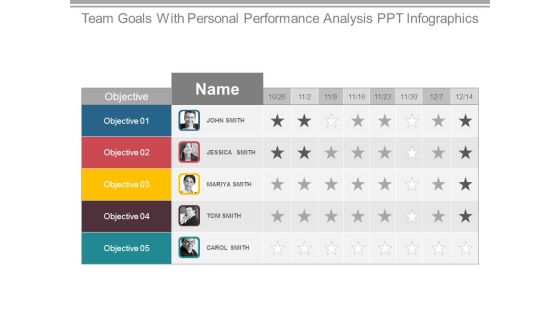
Team Goals With Personal Performance Analysis Ppt Infographics
This is a team goals with personal performance analysis ppt infographics. This is a five stage process. The stages in this process are john smith, jessica smith, mariya smith, tom smith, carol smith.
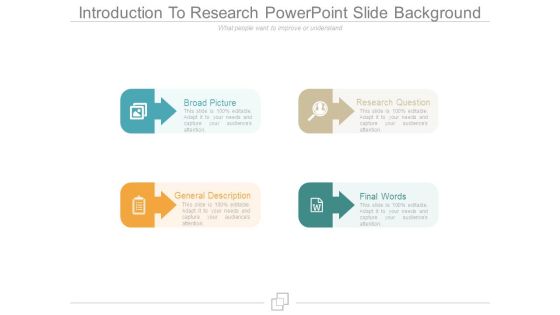
Introduction To Research Powerpoint Slide Background
This is a introduction to research powerpoint slide background. This is a four stage process. The stages in this process are broad picture, general description, research question, final words.
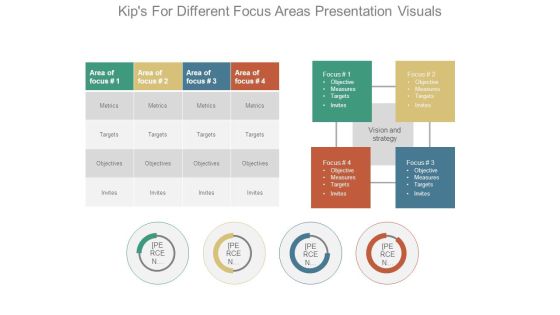
Kips For Different Focus Areas Presentation Visuals
This is a kips for different focus areas presentation visuals. This is a four stage process. The stages in this process are area of focus, metrics, targets, objectives, invites, vision and strategy, focus.

Bar Graph For Changes In Competitive Environment Example Of Ppt
This is a bar graph for changes in competitive environment example of ppt. This is a four stage process. The stages in this process are engagement, brand, monthly, weekly.

Changes In Competitive Environment Bar Chart Sample Of Ppt Presentation
This is a changes in competitive environment bar chart sample of ppt presentation. This is a four stage process. The stages in this process are engagement, brand, monthly, weekly.

Hiring Plan Bar Chart Powerpoint Slide Background Image
This is a hiring plan bar chart powerpoint slide background image. This is a five stage process. The stages in this process are engineering, sales, marketing, product, support, finance.

Hiring Plan Bar Graph With Categories Powerpoint Slide Graphics
This is a hiring plan bar graph with categories powerpoint slide graphics. This is a five stage process. The stages in this process are finance, support, product, marketing, sales, engineering.

Key Performance Indicators Dashboard Powerpoint Slide Show
This is a key performance indicators dashboard powerpoint slide show. This is a four stage process. The stages in this process are focus, objective, measures, targets, invites, vision and strategy, area of focus, metrics, objectives.

Key Performance Indicators Dashboard Powerpoint Themes
This is a key performance indicators dashboard powerpoint themes. This is a four stage process. The stages in this process are focus, objective, measures, targets, invites, vision and strategy, area of focus.
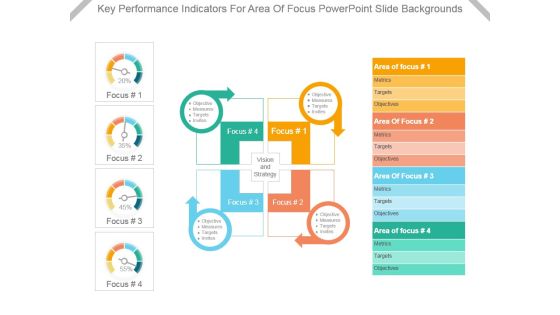
Key Performance Indicators For Area Of Focus Powerpoint Slide Backgrounds
This is a key performance indicators for area of focus powerpoint slide backgrounds. This is a four stage process. The stages in this process are area of focus, metrics, targets, objectives, focus, measures, invites, vision and strategy.
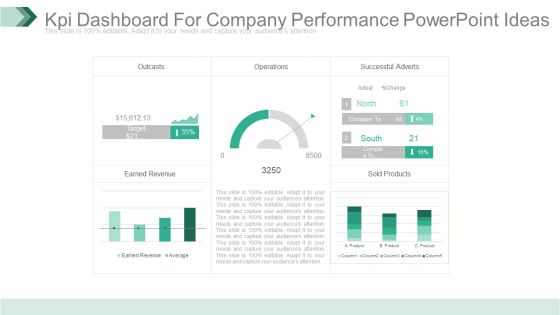
Kpi Dashboard For Company Performance Powerpoint Ideas
This is a kpi dashboard for company performance powerpoint ideas. This is a five stage process. The stages in this process are outcasts, operations, successful adverts, earned revenue, sold products.
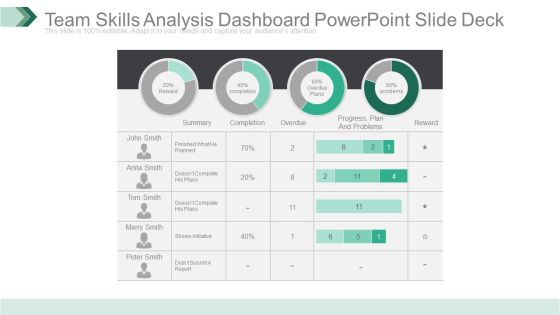
Team Skills Analysis Dashboard Powerpoint Slide Deck
This is a team skills analysis dashboard powerpoint slide deck. This is a four stage process. The stages in this process are reward, summary, completion, overdue, progress plan and problems, problems, reward.

Consumer Behavior Building Marketing Strategy Ppt Slides Examples
This is a consumer behavior building marketing strategy ppt slides examples. This is a five stage process. The stages in this process are consumer behavior, purchasing power, brand knowledge, marketing program, consumer preferences.

Corporate Sustainability Strategies Template Ppt Example
This is a corporate sustainability strategies template ppt example. This is a four stage process. The stages in this process are high performance operations, lower costs, increase profits, gain competitive operations.
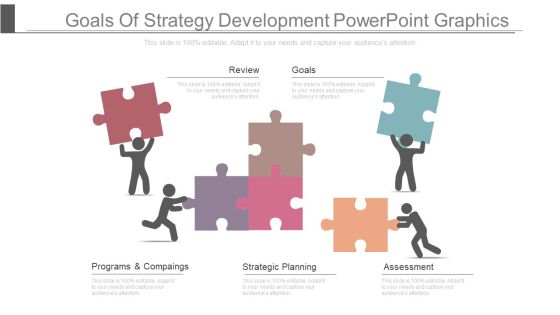
Goals Of Strategy Development Powerpoint Graphics
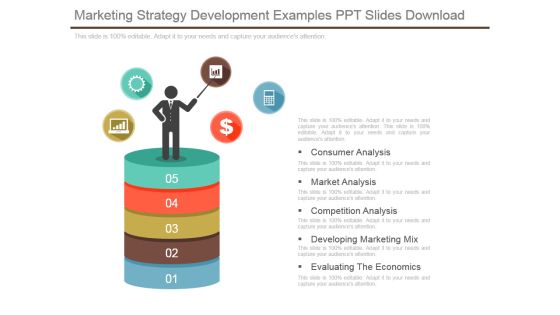
Marketing Strategy Development Examples Ppt Slides Download
This is a marketing strategy development examples ppt slides download. This is a five stage process. The stages in this process are consumer analysis, market analysis, competition analysis, developing marketing mix, evaluating the economics.
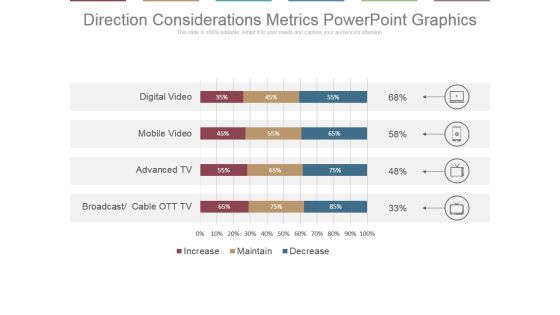
Direction Considerations Metrics Powerpoint Graphics
This is a direction considerations metrics powerpoint graphics. This is a four stage process. The stages in this process are digital video, mobile video, advanced tv, broadcast, cable ott tv.
Spending Directions For Media Channels Ppt Icon
This is a spending directions for media channels ppt icon. This is a four stage process. The stages in this process are digital video, mobile video, advanced tv, broadcast, cable ott tv.
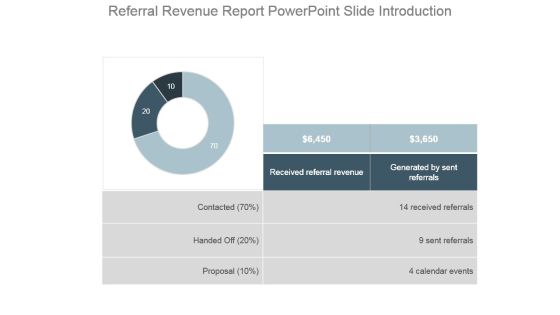
Referral Revenue Report Powerpoint Slide Introduction
This is a referral revenue report powerpoint slide introduction. This is a three stage process. The stages in this process are contacted, handed off, proposal, received referral revenue, generated by sent referrals, received referrals, sent referrals, calendar events.
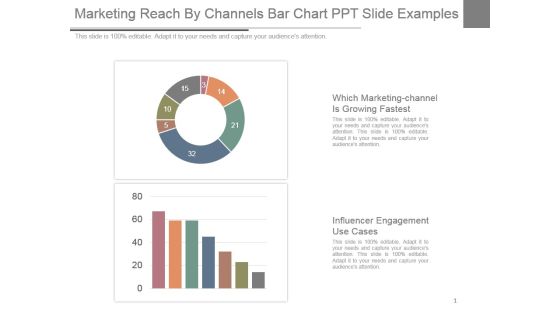
Marketing Reach By Channels Bar Chart Ppt Slide Examples
This is a marketing reach by channels bar chart ppt slide examples. This is a two stage process. The stages in this process are which marketing-channel is growing fastest, influencer engagement use cases.
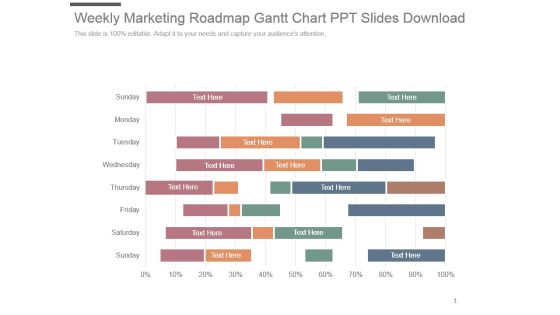
Weekly Marketing Roadmap Gantt Chart Ppt Slides Download
This is a weekly marketing roadmap gantt chart ppt slides download. This is a eight stage process. The stages in this process are sunday, monday, tuesday, wednesday, thursday, friday, saturday, Sunday.

Kpi Dashboard For Operations Powerpoint Slide Images
This is a kpi dashboard for operations powerpoint slide images. This is a four stage process. The stages in this process are outcasts, earned revenue, operations, successful adverts, sold products.
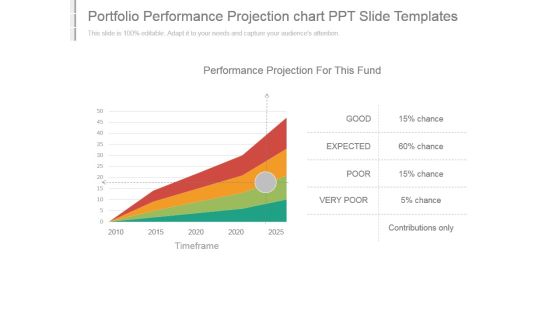
Portfolio Performance Projection Chart Ppt Slide Templates
This is a portfolio performance projection chart ppt slide templates. This is a four stage process. The stages in this process are performance projection for this fund, good, expected, poor, very poor, contributions only, timeframe.
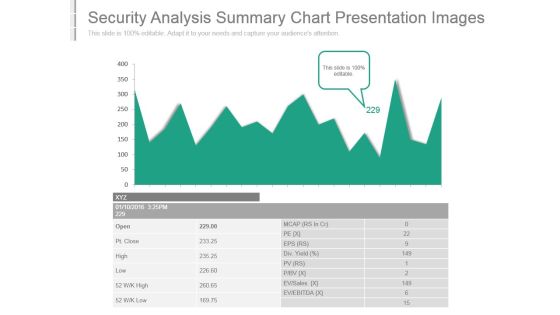
Security Analysis Summary Chart Presentation Images
This is a security analysis summary chart presentation images. This is a one stage process. The stages in this process are ev ebitda, ev sales, div yield, open, pt close, high, low, mcap, eps.
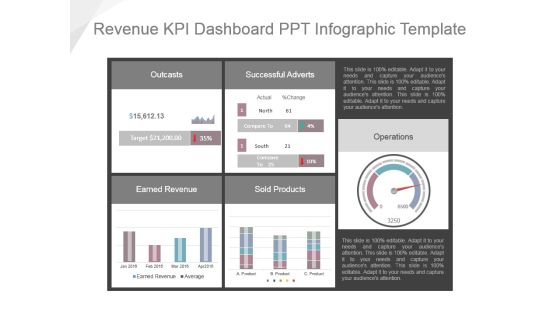
Revenue Kpi Dashboard Ppt Infographic Template
This is a revenue kpi dashboard ppt infographic template. This is a five stage process. The stages in this process are outcasts, successful adverts, earned revenue, sold products, operations.
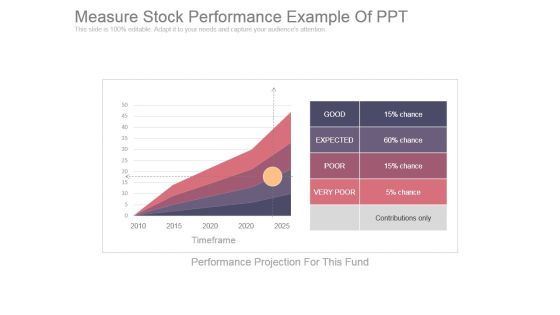
Measure Stock Performance Example Of Ppt
This is a measure stock performance example of ppt. This is a four stage process. The stages in this process are good, poor, expected, very poor, chance, contributions only, performance projection for this fund, timeframe.

Security Analysis Trends Ppt Example
This is a security analysis trends ppt example. This is a one stage process. The stages in this process are open, pt close, high, low, mcap, pe, eps, div, pv, p bv, ev sales, ev ebidta.
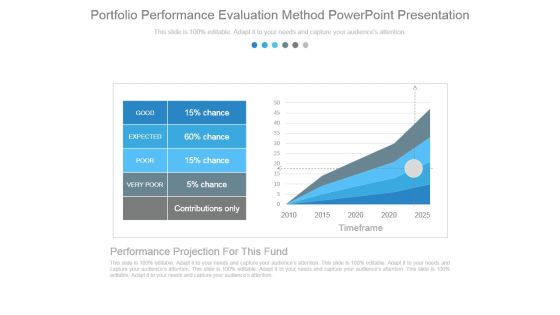
Portfolio Performance Evaluation Method Powerpoint Presentation
This is a portfolio performance evaluation method powerpoint presentation. This is a five stage process. The stages in this process are good, expected, poor, very poor, chance, contributions only, timeframe, performance projection for this fund.

Charts For Portfolio Evaluation Techniques Example Ppt Presentation
This is a charts for portfolio evaluation techniques example ppt presentation. This is a five stage process. The stages in this process are peso govt debt securities, foreign govt debt securities, peso corporate debt securities, dollar corporate debt securities, equity.
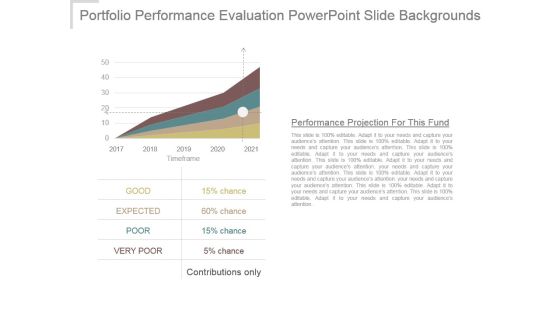
Portfolio Performance Evaluation Powerpoint Slide Backgrounds
This is a portfolio performance evaluation powerpoint slide backgrounds. This is a four stage process. The stages in this process are performance projection for this fund, timeframe, good, expected, poor, very poor, contributions only, chance.

Book Value Per Share Pat Curve Powerpoint Presentation Examples
This is a book value per share pat curve powerpoint presentation examples. This is a one stage process. The stages in this process are gain, lost, book value per share, total equity, total outstanding shares, series.

Financial Highlights Growth Analysis Dashboard Powerpoint Slide
This is a financial highlights growth analysis dashboard powerpoint slide. This is a four stage process. The stages in this process are profit and loss, sales, operating expenses, operating income, net income, profitability.

Inflation Rate Analysis Bar Graph Powerpoint Slide Backgrounds
This is a inflation rate analysis bar graph powerpoint slide backgrounds. This is a twelve stage process. The stages in this process are jan, feb, mar, apr, may, jun, jul, aug, sep, oct, nov, dec.
Referral Tracking Ppt Examples Professional
This is a referral tracking ppt examples professional. This is a three stage process. The stages in this process are received referrals, sent referrals, calendar events, contacted, handed off, proposal.
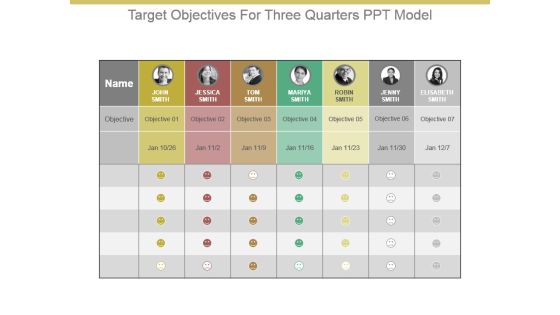
Target Objectives For Three Quarters Ppt Model
This is a target objectives for three quarters ppt model. This is a seven stage process. The stages in this process are name, john smith, jessica smith, tom smith, maria smith, robin smith, elizabeth smith, objective, jan.
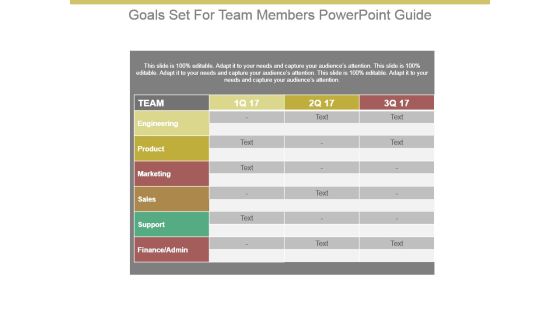
Goals Set For Team Members Powerpoint Guide
This is a goals set for team members powerpoint guide. This is a three stage process. The stages in this process are team, iq, engineering, product, marketing, sales, support, finance admin.

Improvement Goals For Marketing Team Ppt Design
This is a improvement goals for marketing team ppt design. This is a three stage process. The stages in this process are areas of focus, area, iq, result, metric.
 Home
Home