Client Background
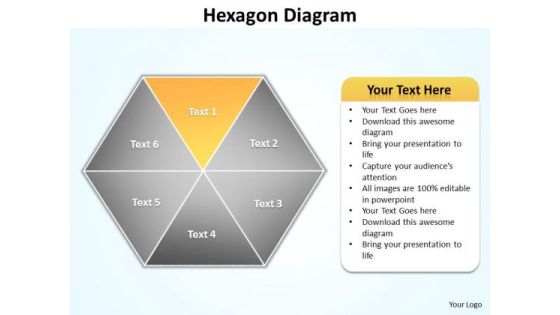
Ppt Yellow Factor Hexagon Cause And Effect Diagram PowerPoint Template Editable Templates
PPT yellow factor hexagon cause and effect diagram PowerPoint template editable Templates-Create visually stimulating Microsoft office PPT Presentations with our above Diagram. This image has been professionally designed to emphasize the concept of interrelated issues, Approaches or Methods. This Business Diagram can be used in Marketing, Banking, and Management etc. This Diagram explains the Yellow Component.-PPT yellow factor hexagon cause and effect diagram PowerPoint template editable Templates-attached, backgrounds, blue, cell, color, component, connect, connection, diagram, elements, geometric, graphic, group, hexagon, honeycomb, icon, illustration, intricacy, lines, link, map, mesh, model, network, science, shape, shiny, strategy, structure, symbol, teamwork, technology

Ppt Fourth Stage Description Using PowerPoint Graphics Arrows Templates
PPT fourth stage description using powerpoint graphics arrows Templates-A management technique that scrutinizes the processes that a company goes through to perform certain tasks. The intention is to create a more efficient way of working, thereby saving time and money. This image represents the concept of Defining five different points of view on the same topic using Arrows. Deliver amazing presentations to mesmerize your audience using this Diagram.-PPT fourth stage description using powerpoint graphics arrows Templates-arrow, background, banner, bar, blank, box, bubble, business, colorful, communication, cubes, curve, decorative, design, glowing, graphic, icon, label, message, number, pattern, product, sale, shape, shiny, sign, sticker, symbol, tag, template, text, title, vector, web
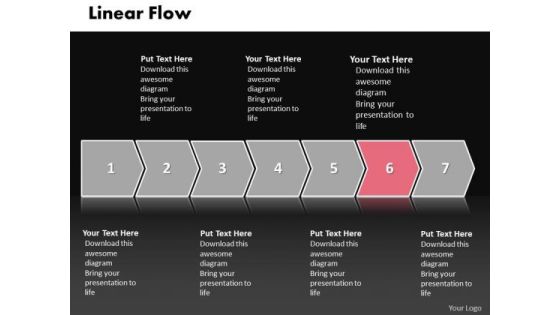
Ppt Linear Demo Create Flow Chart PowerPoint Illustration Steps Of Strategy Templates
PPT linear demo create flow chart powerpoint illustration steps of strategy Templates-This PowerPoint of Linear Arrow Diagram consist of seven stages which are constructed using effective color and design to make it more attractive and good looking. Original thinking is the need of the hour. This Diagram provides the means to project your views.-PPT linear demo create flow chart powerpoint illustration steps of strategy Templates-3d, Arrow, Background, Banner, Business, Chart, Colorful, Diagram, Direction, Element, Financial, Flow, Gradient, Illustration, Isolated, Mirrored, Placeholder, Presentation, Process, Steps
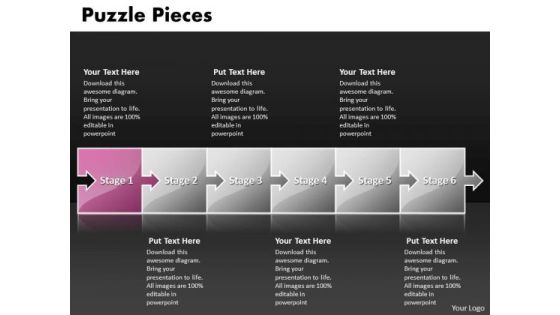
Ppt Puzzle Pieces Steps Working With Slide Numbers Of A Task PowerPoint Templates
PPT puzzle pieces steps working with slide numbers of a task PowerPoint Templates-This Puzzle PowerPoint template incorporates the idea of both the flow chart and a puzzle. It excels in many different ways, presenting information in a unique and engaging way.-PPT puzzle pieces steps working with slide numbers of a task PowerPoint Templates-Abstract, Arrow, Backgrounds, Business, Computer, Concepts, Connection, Cooperation, Creativity, Crowd, Design, Digital, Digitally, Electric, Equalizer, Generated, Graph, Graphic, Group, Icon, Ideas, Illustration, Image, Individuality, Isolated, Leader, Leadership, Link, Motivation, Music, Objects, Order, Part, Pattern, Piece, Playing, Puzzle
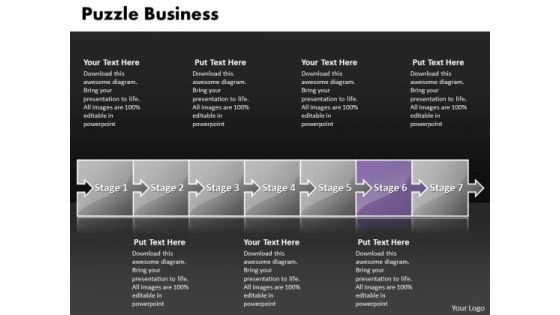
Ppt Puzzle Pieces Writing Process PowerPoint Presentation Flow Diagarm Templates
PPT puzzle pieces writing process powerpoint presentation flow diagarm Templates-The PowerPoint slides can be used a normal timeline or to show a flow in the work in progress. The visuals of the puzzle design make this template an interesting and enjoyable addition to a PowerPoint presentation.-PPT puzzle pieces writing process powerpoint presentation flow diagarm Templates-Abstract, Arrow, Backgrounds, Business, Computer, Concepts, Connection, Cooperation, Creativity, Crowd, Design, Digital, Digitally, Electric, Equalizer, Generated, Graph, Graphic, Group, Icon, Ideas, Illustration, Image, Individuality, Isolated, Leader, Leadership, Link, Motivation, Music, Objects, Order, Part, Pattern, Piece, Playing, Puzzle
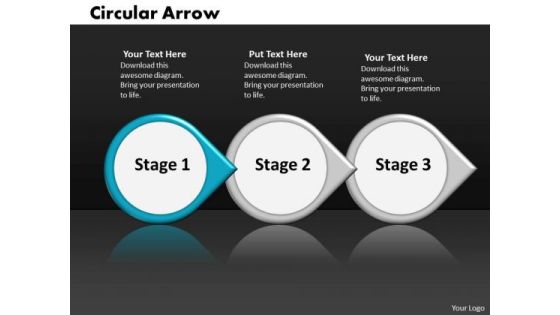
Ppt Regular Flow Of 3 Steps Working With Slide Numbers Circular Arrow PowerPoint Templates
PPT regular flow of 3 steps working with slide numbers circular arrow PowerPoint Templates-Our compelling Diagram consists of a design of Circular Arrows representing three different views on the Similar Issue. You can also add goals to the timeline project and milestones using this Diagram. This is a basic project timeline that comes with a dark PowerPoint Diagram background.-PPT regular flow of 3 steps working with slide numbers circular arrow PowerPoint Templates-3d, Abstract, Advertisement, Aim, Arrow, Business, Circular, Cursor, Direction, Down, Environment, Form, Glossy, Graphic, Icon, Illustration, Information, Mark, Motion, Perspective, Point, Sale, Shadow, Shape, Shiny, Sign

Ppt Arrow Circle Insert Default Graph Chart PowerPoint 2003 5 Stages Templates
PPT arrow circle insert default graph chart powerpoint 2003 5 stages Templates-This PowerPoint Diagram shows you Inter-connected Layers using Arrows in Horizontal Line which signifies step by step Execution, inter-related approaches etc. You can change color, size and orientation of any icon to your liking.-PPT arrow circle insert default graph chart powerpoint 2003 5 stages Templates-Arrow, Art, Background, Beautiful, Bright, Business, Circle, Collection, Color, Colorful, Concentric, Concept, Connection, Contrast, Creative, Decoration, Design, Effect, Element, Graphic, Green, Group, Icon, Illustration, Image, Isolated, Light, Pattern, Pie, Red, Render, Round, Sample, Shape, Solution, Style, Success, Symbol, Technology, Wheel, White, Yellow

Ppt Factors In Cycle Procurement Process PowerPoint Presentation 5 Stages Templates
PPT factors in cycle procurement process powerpoint presentation 5 stages Templates-Select the key concepts of the topic under study use this slide to discuss that topic with your team. This Diagram is an effective way of displaying information. You can edit text, color, shade and style as per you need.-PPT factors in cycle procurement process powerpoint presentation 5 stages Templates-Arrow, Art, Background, Beautiful, Bright, Business, Circle, Collection, Color, Colorful, Concentric, Concept, Connection, Contrast, Creative, Decoration, Design, Effect, Element, Graphic, Green, Group, Icon, Illustration, Image, Isolated, Light, Pattern, Pie, Red, Render, Round, Sample, Shape, Solution, Style, Success, Symbol, Technology, Wheel, White, Yellow

Ppt Direction Arrows Of Layout Editable PowerPoint World Map Templates
PPT direction arrows of layout editable powerpoint world map Templates-The above template contains a graphic of arrows pointing towards the center. Clarity of thought has been the key to your growth. Use our templates to illustrate your ability.-PPT direction arrows of layout editable powerpoint world map Templates-Abstract, Achievement, Aim, Arrow, Background, Business, Chart, Communication, Competition, Concept, Design, Direction, Development, Diagram, Direction, Finance, Financial, Forecast, Forward, Goal, Graph, Graphic, Growth, Icon, Illustration, Increase, Investment, Leader, Leadership, Design, Marketing, Price, Process, Profit, Progress, Progress, Shape, Sign, Success, Symbol, Target, Team, Teamwork

Golden Key With Coins Secured Investment Finance PowerPoint Templates And PowerPoint Themes 1012
Golden Key With Coins Secured Investment Finance PowerPoint Templates And PowerPoint Themes 1012-Visually support your Microsoft office PPT Presentation with our above Template illustrating Golden Key along with golden coins on a beautiful dollar background. This Template Signifies the concept of asset, speculation, venture, outlay, savings, deal, stock, share, venture capital, security, investing, capital spending, financing etc. Use our creative template to lay down your views.-Golden Key With Coins Secured Investment Finance PowerPoint Templates And PowerPoint Themes 1012-This PowerPoint template can be used for presentations relating to-Golden Key With Coins, Security, Symbol, Money, Finance, Business
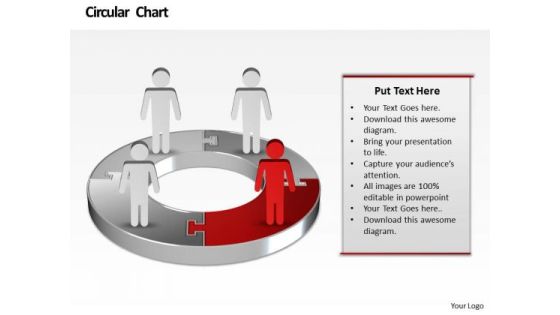
Ppt Illustration Of Financial Pie Chart Marketing Presentation PowerPoint Templates
PPT illustration of financial pie chart marketing presentation powerpoint Templates-You have the people in place, selected the team leaders and all are raring to go. You have the plans ready for them to absorb and understand. Educate your team with your thoughts and logic. -PPT illustration of financial pie chart marketing presentation powerpoint Templates-Abstract, Access, Arrow, Background, Business, Chart, Circle, Concept, Conceptual, Connection, Corporate, Creative, Cycle, Design, Different, Element, Empty, Form, Frame, Graphic, Group, Idea, Illustration, Part, Piece, Place, Process, Red, Shapes, Solution, Special, Speech, Strategy, Symbol

Competitive Edge Performance Representation For Variance Analysis Techniques And Models Ideas PDF
This slide covers the graphical representation for gap analyzation process. It also covers the important factors such as, sales metrics, time frame, potential and performance. Showcasing this set of slides titled competitive edge performance representation for variance analysis techniques and models ideas pdf. The topics addressed in these templates are competitive edge performance representation for variance analysis techniques and models. All the content presented in this PPT design is completely editable. Download it and make adjustments in color, background, font etc. as per your unique business setting.
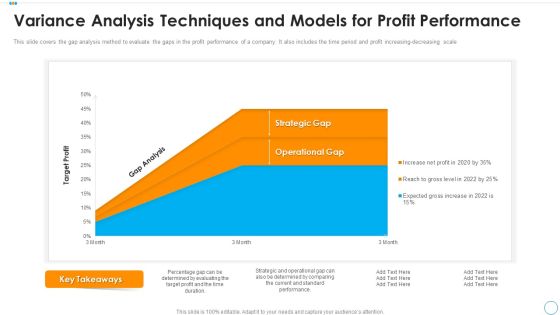
Variance Analysis Techniques And Models For Profit Performance Sample PDF
This slide covers the gap analysis method to evaluate the gaps in the profit performance of a company. It also includes the time period and profit increasing decreasing scale. Showcasing this set of slides titled variance analysis techniques and models for profit performance sample pdf. The topics addressed in these templates are variance analysis techniques and models for profit performance. All the content presented in this PPT design is completely editable. Download it and make adjustments in color, background, font etc. as per your unique business setting.
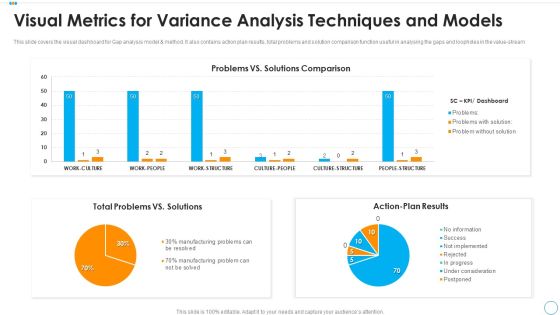
Visual Metrics For Variance Analysis Techniques And Models Mockup PDF
This slide covers the visual dashboard for Gap analysis model and method. It also contains action plan results, total problems and solution comparison function useful in analysing the gaps and loopholes in the value stream. Showcasing this set of slides titled visual metrics for variance analysis techniques and models mockup pdf. The topics addressed in these templates are total problems vs solutions, action plan results, problems vs solutions comparison. All the content presented in this PPT design is completely editable. Download it and make adjustments in color, background, font etc. as per your unique business setting.

5 Step Strategy For Enhancement In Product Quality Professional PDF
This slide shows 30 60 90 day improvement plan for product designers which can benefit the organizations in improvising the current plan and employing new outline for higher success rate of fresh techniques. It includes information about designated meetings, product plan, assessment and implementing the design strategies. Showcasing this set of slides titled 5 Step Strategy For Enhancement In Product Quality Professional PDF. The topics addressed in these templates are 30 Days, 60 Days, 90 Days. All the content presented in this PPT design is completely editable. Download it and make adjustments in color, background, font etc. as per your unique business setting.

Inbound Tech Support Process Flow Chart Workflow To Improve Operational Efficiency Summary PDF
This slide covers inbound technical support workflow to improve operational efficiency. It involves details such as technical sales team, technical support and upselling team. Showcasing this set of slides titled Inbound Tech Support Process Flow Chart Workflow To Improve Operational Efficiency Summary PDF. The topics addressed in these templates are Provide Operational Training, Conduct Right People, Baseline Evaluation. All the content presented in this PPT design is completely editable. Download it and make adjustments in color, background, font etc. as per your unique business setting.
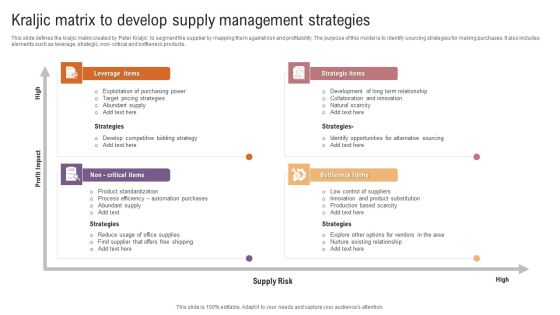
Kraljic Matrix To Develop Supply Management Strategies Clipart PDF
This slide defines the kraljic matrix created by Peter Kraljic to segment the supplier by mapping them against risk and profitability. The purpose of this model is to identify sourcing strategies for making purchases. It also includes elements such as leverage, strategic, non- critical and bottleneck products. Showcasing this set of slides titled Kraljic Matrix To Develop Supply Management Strategies Clipart PDF. The topics addressed in these templates are Exploitation Of Purchasing Power, Abundant Supply. All the content presented in this PPT design is completely editable. Download it and make adjustments in color, background, font etc. as per your unique business setting.

30 60 90 New Job Appointment Plan For Chief Information Officer Graphics PDF
This slide represents the 30 60 90 new job plan for the chief information officer. The purpose of this slide is to demonstrate the various objectives of the chief information officer in the new job role. The primary components include learning, performance, initiative, and personal goals.Showcasing this set of slides titled 30 60 90 New Job Appointment Plan For Chief Information Officer Graphics PDF. The topics addressed in these templates are Performance Goals, Initiative Goals, Personal Goals. All the content presented in this PPT design is completely editable. Download it and make adjustments in color, background, font etc. as per your unique business setting.

Dashboard To Track Energy Efficiency After Campaign Implementation Pictures PDF
This slide consists of a Dashboard which can be used to track energy saving which will be used by managers to track effectiveness of program implementation. The key performance indicators include electric vs gas allocation, equipment activity, changes in costs, budget load etc. Showcasing this set of slides titled Dashboard To Track Energy Efficiency After Campaign Implementation Pictures PDF. The topics addressed in these templates are Equipment Activity, Budget Load, Cost Projection. All the content presented in this PPT design is completely editable. Download it and make adjustments in color, background, font etc. as per your unique business setting.
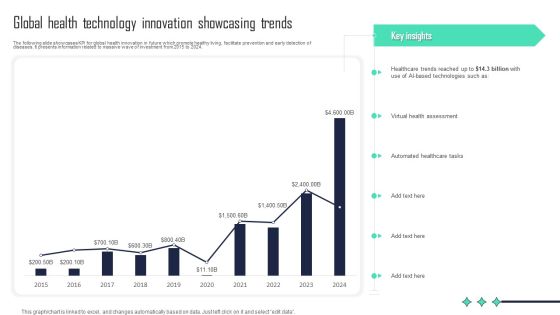
Global Health Technology Innovation Showcasing Trends Formats PDF
The following slide showcases KPI for global health innovation in future which promote healthy living, facilitate prevention and early detection of diseases. It presents information related to massive wave of investment from 2015 to 2024. Showcasing this set of slides titled Global Health Technology Innovation Showcasing Trends Formats PDF. The topics addressed in these templates are Virtual Health Assessment, Automated Healthcare Tasks, Key Insights. All the content presented in this PPT design is completely editable. Download it and make adjustments in color, background, font etc. as per your unique business setting.

Trends In Digital Global Health Technology Applications By Disease State Pictures PDF
The following slide showcases digital trends in healthcare application market categorized by different disease states. It presents information related to wellness management, health condition, diet and nutrition, etc. Showcasing this set of slides titled Trends In Digital Global Health Technology Applications By Disease State Pictures PDF. The topics addressed in these templates are Healthcare Providers, Medication Information, Women Health. All the content presented in this PPT design is completely editable. Download it and make adjustments in color, background, font etc. as per your unique business setting.
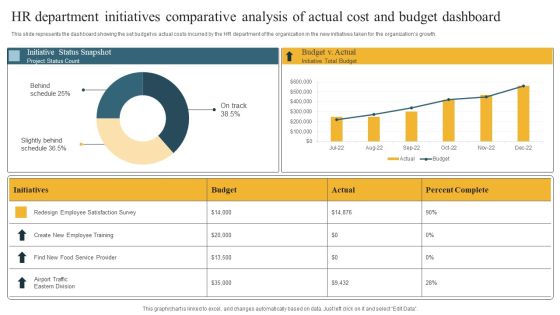
HR Department Initiatives Comparative Analysis Of Actual Cost And Budget Dashboard Introduction PDF
This slide represents the dashboard showing the set budget vs actual costs incurred by the HR department of the organization in the new initiatives taken for the organizations growth. Showcasing this set of slides titled HR Department Initiatives Comparative Analysis Of Actual Cost And Budget Dashboard Introduction PDF. The topics addressed in these templates are Behind Schedule, Slightly Behind Schedule, Initiative Status Snapshot. All the content presented in this PPT design is completely editable. Download it and make adjustments in color, background, font etc. as per your unique business setting.
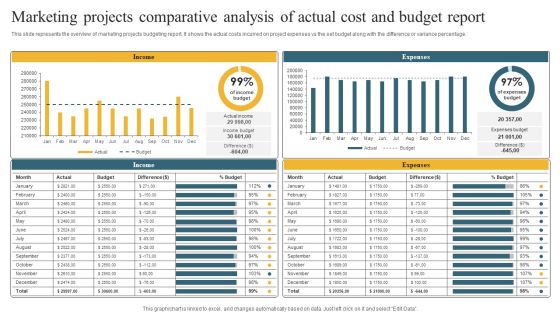
Marketing Projects Comparative Analysis Of Actual Cost And Budget Report Themes PDF
This slide represents the overview of marketing projects budgeting report. It shows the actual costs incurred on project expenses vs the set budget along with the difference or variance percentage. Showcasing this set of slides titled Marketing Projects Comparative Analysis Of Actual Cost And Budget Report Themes PDF. The topics addressed in these templates are Income, Expenses, Report. All the content presented in this PPT design is completely editable. Download it and make adjustments in color, background, font etc. as per your unique business setting.

Digital Multi Channel Marketing Roi Strategy Clipart PDF
This slide covers online marketing channels rate on investment. The purpose of this template is to judge how well a particular marketing channel perform in comparison of others. It includes elements such as Email, SEO, direct mail and online ads Showcasing this set of slides titled Digital Multi Channel Marketing Roi Strategy Clipart PDF. The topics addressed in these templates are Return On Investment, Digital Marketing Channels, Key Takeaways. All the content presented in this PPT design is completely editable. Download it and make adjustments in color, background, font etc. as per your unique business setting.

Effectiveness Of Social Media Data Insights For Marketers Ideas PDF
The following slide depicts the effectiveness of social media insights for marketers. This data analysis helps them to formulate strategies, understand the target audience, evaluate campaign performance, assess ROI etc. Showcasing this set of slides titled Effectiveness Of Social Media Data Insights For Marketers Ideas PDF. The topics addressed in these templates are Effectiveness, Social Media, Marketers. All the content presented in this PPT design is completely editable. Download it and make adjustments in color, background, font etc. as per your unique business setting.

Quarterly Revenue Data Insights Report Template PDF
The following slide gives an insight of organizations quarter wise revenue to assess the most profitable and weak segment for strategy formulation. It also includes operating divisions, product segments, SEQ and YOY growth. Showcasing this set of slides titled Quarterly Revenue Data Insights Report Template PDF. The topics addressed in these templates are Operating, Divisions products, Insights Report. All the content presented in this PPT design is completely editable. Download it and make adjustments in color, background, font etc. as per your unique business setting.

Call Center Metrics And Metrics Dashboard With Tickets Raised Graphics PDF
Mentioned slide outlines a KPI dashboard showcasing the call center performance. The metrics covered in the slide are total dropped calls, waiting calls, total calls, team performance, recurring calls, tickets raised. Showcasing this set of slides titled Call Center Metrics And Metrics Dashboard With Tickets Raised Graphics PDF. The topics addressed in these templates are Call Management Data, Monthly Statics, Performance Records. All the content presented in this PPT design is completely editable. Download it and make adjustments in color, background, font etc. as per your unique business setting.

Call Center Metrics Dashboard With Average Response Time Inspiration PDF
Mentioned slide outlines KPI dashboard which can be used by call center to measure the performance of their agents. The key metrics highlighted in the dashboard are first call resolution, daily abandonment rate, total number of calls by topic, top performing call agents etc. Showcasing this set of slides titled Call Center Metrics Dashboard With Average Response Time Inspiration PDF. The topics addressed in these templates are Efficiency, Quality, Activity, Daily Average Response, Daily Average Transfer. All the content presented in this PPT design is completely editable. Download it and make adjustments in color, background, font etc. as per your unique business setting.

Call Center Metrics Dashboard With Key Metrics Information PDF
Mentioned slide outlines various call center KPIs dashboard. Call resolution in the current and previous month, agents schedule adherence today, currently active and waiting calls are some of the key metrics mentioned in the slide. Showcasing this set of slides titled Call Center Metrics Dashboard With Key Metrics Information PDF. The topics addressed in these templates are Currently Active, Call Resolution, Key Metrics. All the content presented in this PPT design is completely editable. Download it and make adjustments in color, background, font etc. as per your unique business setting.

Metrics Dashboard To Measure Call Center Success Themes PDF
Mentioned slide outlines a comprehensive KPI dashboard used to measure the call center performance. The dashboard monitors the status of key metrics such as call abandonment levels, current service level, average call length, total calls attended, calls waiting etc. Showcasing this set of slides titled Metrics Dashboard To Measure Call Center Success Themes PDF. The topics addressed in these templates are Center Success, Call Center Status, Call Monitor. All the content presented in this PPT design is completely editable. Download it and make adjustments in color, background, font etc. as per your unique business setting.

Operations Status Report To Analyze Sales Performance Portrait PDF
Following slide outlines operational status report which can be used to measure the companys sales performance in different years. The report covers information about expenses and sales in different regions, sales volume trend, operational effectiveness by different industries, etc. Showcasing this set of slides titled Operations Status Report To Analyze Sales Performance Portrait PDF. The topics addressed in these templates are Operations Status Report, Analyze Sales Performance. All the content presented in this PPT design is completely editable. Download it and make adjustments in color, background, font etc. as per your unique business setting.
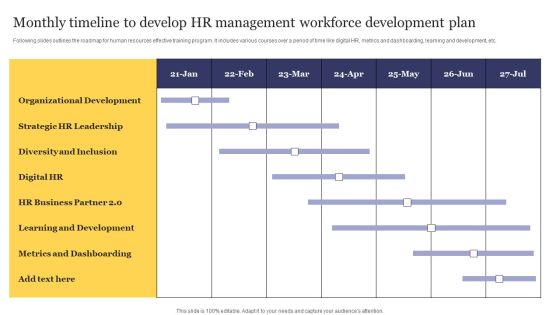
Monthly Timeline To Develop HR Management Workforce Development Plan Summary PDF
Following slides outlines the roadmap for human resources effective training program. It includes various courses over a period of time like digital HR, metrics and dashboarding, learning and development, etc. Showcasing this set of slides titled Monthly Timeline To Develop HR Management Workforce Development Plan Summary PDF. The topics addressed in these templates are Organizational Development, Metrics And Dashboarding, Learning And Development. All the content presented in this PPT design is completely editable. Download it and make adjustments in color, background, font etc. as per your unique business setting.
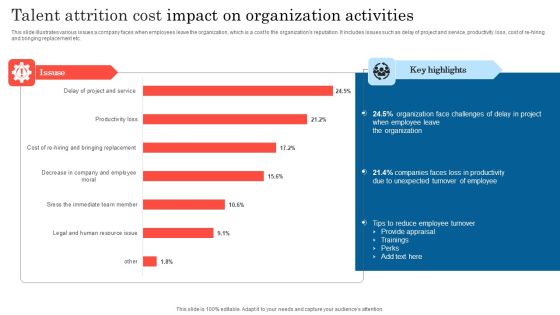
Talent Attrition Cost Impact On Organization Activities Ideas PDF
This slide illustrates various issues a company faces when employees leave the organization, which is a cost to the organizations reputation. It includes issues such as delay of project and service, productivity loss, cost of re-hiring and bringing replacement etc. Showcasing this set of slides titled Talent Attrition Cost Impact On Organization Activities Ideas PDF. The topics addressed in these templates are Organization, Employee Leave, Productivity. All the content presented in this PPT design is completely editable. Download it and make adjustments in color, background, font etc. as per your unique business setting.
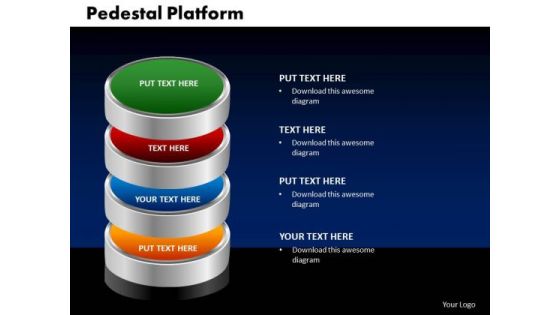
PowerPoint Process Pedestal Platform Image Ppt Presentation Designs
PowerPoint Process Pedestal Platform Image PPT Presentation Designs-Use this graphics to explain your dream step by step, stage by stage till the process rings loud and clear to your audience. Churn their interest and imagination with this diagram-PowerPoint Process Pedestal Platform Image PPT Presentation Designs-This ppt can be used for presentations relating to-Abstract, Background, Ball, Business, Dark, Decoration, Design, Digital, Earth, Education, Global, Globe, Graphic, High, Icon, Idea, Illustration, Image, Map, Metal, Object, Ocean, Peace, Pedestal, Planet, Reflection, Retro, Sea, Single, Sphere, Stand, Success

Ppt 3 Interconnected Stock Exchange Components Using Wheels Ratios Templates PowerPoint
PPT 3 interconnected stock exchange components using wheels ratios templates PowerPoint-This PowerPoint Diagram consists of Three interconnected Gears which portrays interconnected factors or components. It signifies accessory, accouterment, adjunct, apparatus, appendage, appurtenance, baggage, belongings, contraption, effects, encumbrances, fittings etc.-Can be used for presentations on adult, arrow, background, bright, business, career, chart, circle, cogs, communication, concept, corporate, creative, design, direction, earth, economy, friends, gears, group, growth, idea, increase, leader, mechanism, meeting, new, occupation, people, person, professional, progress, standing, success-PPT 3 interconnected stock exchange components using wheels ratios templates PowerPoint
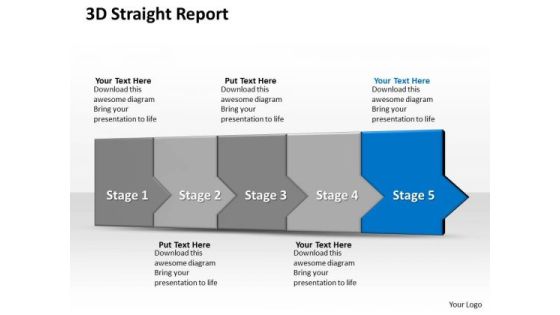
Ppt 3d Steady Description To Prevent Financial Losses Five Steps PowerPoint Templates
PPT 3d steady description to prevent financial losses five steps PowerPoint Templates-The theme of this PowerPoint template is linear arrows. Use them to illustrate a stepwise process or a phase structure.-PPT 3d steady description to prevent financial losses five steps PowerPoint Templates-Abstract, Background, Banking, Banknote, Business, Cash, Chain, Chained, Commerce, Commercial, Concept, Conceptual, Crime, Currency, Cutout, Dollar, Finance, Fraud, Guard, Insurance, Investment, Isolated, Law, Locked, Money, Note, Object, Padlock, Paper, Prevention, Protect, Protection, Risk, Rusty, Safe, Safeguard, Safety, Savings, Secure, Security, Theft, Trust, Us, Wealth, White

Ppt 3d Straight Description To Prevent Marketing Losses Five Steps PowerPoint Templates
PPT 3d straight description to prevent marketing losses five steps PowerPoint Templates-The theme of this PowerPoint template is linear arrows. Use them to illustrate a stepwise process or a phase structure.-PPT 3d straight description to prevent marketing losses five steps PowerPoint Templates-Abstract, Background, Banking, Banknote, Business, Cash, Chain, Chained, Commerce, Commercial, Concept, Conceptual, Crime, Currency, Cutout, Dollar, Finance, Fraud, Guard, Insurance, Investment, Isolated, Law, Locked, Money, Note, Object, Padlock, Paper, Prevention, Protect, Protection, Risk, Rusty, Safe, Safeguard, Safety, Savings, Secure, Security, Theft, Trust, Us, Wealth, White
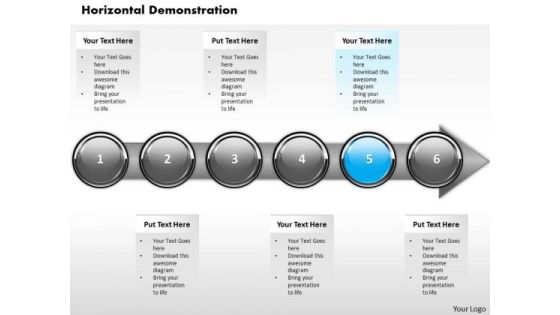
Ppt Consistent Demonstration Of Financial Process Using Stage 5 PowerPoint Templates
PPT consistent demonstration of financial process using stage 5 PowerPoint Templates-Highlight the key components of your entire financial process. Illustrate how each element flows seamlessly onto the next stage.-PPT consistent demonstration of financial process using stage 5 PowerPoint Templates-Abstract, Achievement, Aim, Arrow, Background, Business, Chart, Communication, Company, Competition, Concept, Design, Development, Diagram, Direction, Finance, Financial, Forecast, Forward, Goal, Graph, Graphic, Growth, Icon, Illustration, Increase, Investment, Leader, Leadership, Marketing, Motion, Moving, Orange, Path, Price, Process, Profit, Progress, Shape, Sign, Success, Symbol, Target, Team, Teamwork, Up, Upwards

Ppt Homogeneous Demonstration Of Financial Process Using Stage 3 PowerPoint Templates
PPT homogeneous demonstration of financial process using stage 3 PowerPoint Templates-With this pre-designed process arrows diagram you can visualize almost any type of concept, chronological process or steps of your strategies.-PPT homogeneous demonstration of financial process using stage 3 PowerPoint Templates-Abstract, Achievement, Aim, Arrow, Background, Business, Chart, Communication, Company, Competition, Concept, Design, Development, Diagram, Direction, Finance, Financial, Forecast, Forward, Goal, Graph, Graphic, Growth, Icon, Illustration, Increase, Investment, Leader, Leadership, Marketing, Motion, Moving, Orange, Path, Price, Process, Profit, Progress, Shape, Sign, Success, Symbol, Target, Team, Teamwork, Up, Upwards

Ppt Horizontal Abstraction Of Financial Process Using Stage 4 PowerPoint Templates
PPT horizontal abstraction of financial process using stage 4 PowerPoint Templates-This diagram can be used in analyzing, designing, documenting or managing a process or program in various fields.-PPT horizontal abstraction of financial process using stage 4 PowerPoint Templates-Abstract, Achievement, Aim, Arrow, Background, Business, Chart, Communication, Company, Competition, Concept, Design, Development, Diagram, Direction, Finance, Financial, Forecast, Forward, Goal, Graph, Graphic, Growth, Icon, Illustration, Increase, Investment, Leader, Leadership, Marketing, Motion, Moving, Orange, Path, Price, Process, Profit, Progress, Shape, Sign, Success, Symbol, Target, Team, Teamwork, Up, Upwards
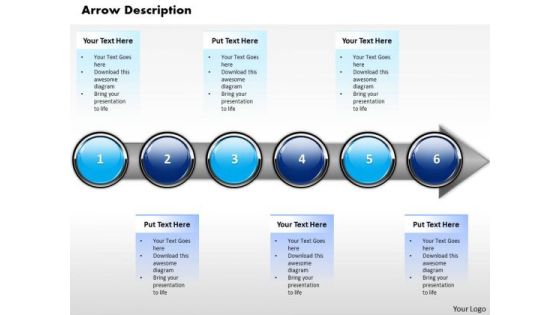
Ppt Horizontal Illustration Of Financial Process Using 6 State Diagram PowerPoint Templates
PPT horizontal illustration of financial process using 6 state diagram PowerPoint Templates-This diagram can be used in analyzing, designing, documenting or managing a process or program in various fields.-PPT horizontal illustration of financial process using 6 state diagram PowerPoint Templates-Abstract, Achievement, Aim, Arrow, Background, Business, Chart, Communication, Company, Competition, Concept, Design, Development, Diagram, Direction, Finance, Financial, Forecast, Forward, Goal, Graph, Graphic, Growth, Icon, Illustration, Increase, Investment, Leader, Leadership, Marketing, Motion, Moving, Orange, Path, Price, Process, Profit, Progress, Shape, Sign, Success, Symbol, Target, Team, Teamwork, Up, Upwards
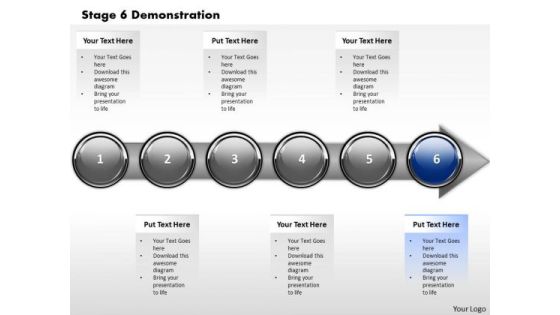
Ppt Linear Abstraction Of Financial Layouts Process Using Stage 6 PowerPoint Templates
PPT linear abstraction of financial layouts process using stage 6 PowerPoint Templates-The theme of this PowerPoint template is linear arrow. Use this slide to detail and highlight your thought process, your views and your positive expectations.-PPT linear abstraction of financial layouts process using stage 6 PowerPoint Templates-Abstract, Achievement, Aim, Arrow, Background, Business, Chart, Communication, Company, Competition, Concept, Design, Development, Diagram, Direction, Finance, Financial, Forecast, Forward, Goal, Graph, Graphic, Growth, Icon, Illustration, Increase, Investment, Leader, Leadership, Marketing, Motion, Moving, Orange, Path, Price, Process, Profit, Progress, Shape, Sign, Success, Symbol, Target, Team, Teamwork, Up, Upwards
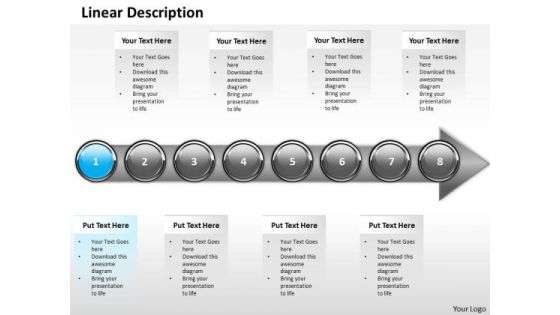
Ppt Linear Demonstration Of Marketing Process Using Stage 1 PowerPoint Templates
PPT linear demonstration of marketing process using stage 1 PowerPoint Templates-Your business and plans for its growth consist of processes that are highly co-related. Use this template to enlighten your team and colleagues on the critical factors involved.-PPT linear demonstration of marketing process using stage 1 PowerPoint Templates-Advertising, Arrow, Background, Banner, Blue, Bookmark, Card, Choice, Concept, Creative, Design, Direction, Flow, Illustration, Infographic, Instruction, Label, Layout, Manual, Marketing, Modern, Next, Number, Offer, One, Options, Order, Page, Paper, Pointer, Process, Product, Promotion, Sequence, Simple, Special, Step, Symbol, Tab, Tag, Template, Three, Tutorial, Two, Vector, Version, Web, Webdesign, Website

Ppt Sequential Demonstration Of Arrow Process Step 1 PowerPoint Templates
PPT sequential demonstration of arrow process step 1 PowerPoint Templates-With this pre-designed process arrows diagram you can visualize almost any type of concept, chronological process or steps of your strategies-PPT sequential demonstration of arrow process step 1 PowerPoint Templates-Abstract, Achievement, Aim, Arrow, Background, Business, Chart, Communication, Company, Competition, Concept, Design, Development, Diagram, Direction, Finance, Financial, Forecast, Forward, Goal, Graph, Graphic, Growth, Icon, Illustration, Increase, Investment, Leader, Leadership, Marketing, Motion, Moving, Orange, Path, Price, Process, Profit, Progress, Shape, Sign, Success, Symbol, Target, Team, Teamwork, Up, Upwards
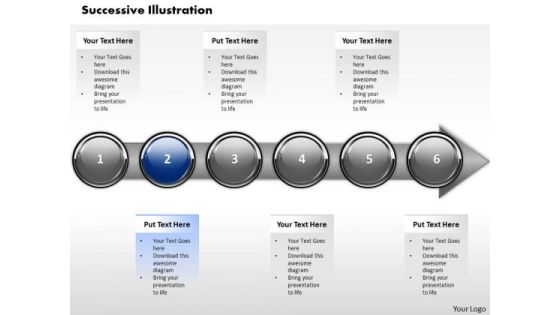
Ppt Sequential Illustration Of Financial PowerPoint Presentation Process Step 2 Templates
PPT sequential illustration of financial powerpoint presentation process step 2 Templates-This diagram helps to determine your targets and you can sequence them as per your priorities. Educate your listeners on the relevance and importance of each one as per your plan.-PPT sequential illustration of financial powerpoint presentation process step 2 Templates-Abstract, Achievement, Aim, Arrow, Background, Business, Chart, Communication, Company, Competition, Concept, Design, Development, Diagram, Direction, Finance, Financial, Forecast, Forward, Goal, Graph, Graphic, Growth, Icon, Illustration, Increase, Investment, Leader, Leadership, Marketing, Motion, Moving, Orange, Path, Price, Process, Profit, Progress, Shape, Sign, Success, Symbol, Target, Team, Teamwork, Up, Upwards

Ppt Concepts Of Circular Procedure 7 Phase Diagram PowerPoint Templates
PPT concepts of circular procedure 7 phase diagram PowerPoint Templates-This PowerPoint Diagram shows you the Circular Interpretation of the process which includes seven phases. This Diagram can be used for the Presentation on art, arrow, bright, calendar, chart, circle, circular, clip, clipart, collection, graphic, illustration, isolated, menu, process, round. -PPT concepts of circular procedure 7 phase diagram PowerPoint Templates-7Arrows, Art, Background, Beautiful, Bright, Business, Circle, Collection, Color, Colorful, Concentric, Concept, Decoration, Design, Icon, Illustration, Image, Isolated, Light, Pattern, Pie, Red, Render, Round, Sample, Shape, Solution, Style, Success, Symbol, Technology, Wheel
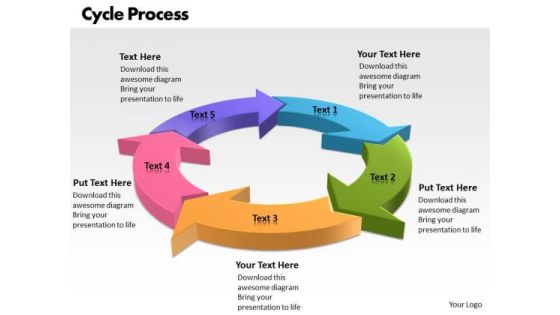
Ppt Factors Of Cycle Communication Process PowerPoint Presentation 5 Stages Templates
PPT factors of cycle communication process powerpoint presentation 5 stages Templates-Use this PowerPoint Diagram to explain the cycle process for communication purpose. It shows five stages attached to each other to form an interconnected Mechanism. It symbolizes affiliation, affinity, alliance, association, connection etc.-PPT factors of cycle communication process powerpoint presentation 5 stages Templates-Cycle, Process, 5 Stages, Arrows, Background, Beautiful, Bright, Business, Circle, Collection, Color, Colorful, Concentric, Concept, Element, Graphic, Green, Group, Icon, Illustration, Image, Render, Round, Sample, Shape, Solution, Style, Success, Symbol, Technology, Wheel
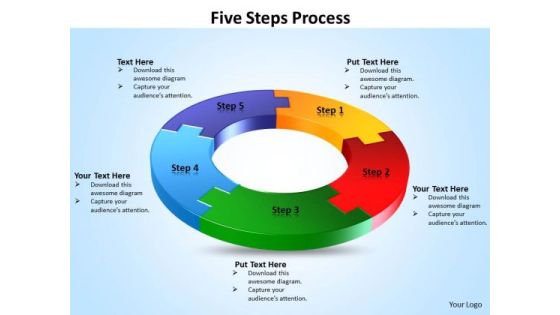
Ppt Five Steps Working With Slide Numbers Forging Process PowerPoint Slides Templates
PPT five steps working with slide numbers forging process powerpoint slides Templates-By using this Amazing PowerPoint Diagram you can make your Presentation Interesting to watch for audiences. This Diagram shows five Puzzle Pieces connected to each other forming a circle. Use this diagram to present your contents in a clear and structured manner.-PPT five steps working with slide numbers forging process powerpoint slides Templates-Around, Arrow, Background, Business, Chart, Circle, Circular, Circulation, Color, Colorful, Concept, Curving, Cycle, Diagram, Direction, Element, Flow, Flowchart, Graphic, Illustration, Motion, Movement, Part, Phase, Presentation, Process, Puzzle, Rotation, Round, Section, Sequence, Simple, Stage, Step, Strategy, Success

Ppt Flower Petal Diagram Presentation PowerPoint Tips Editable Templates
PPT flower petal diagram presentation powerpoint tips editable Templates-Use this Flower Based PowerPoint Diagram to make your Presentation Beautiful to watch for Audiences. It shows six Petals describing six different topics included in one mechanism. It signifies move, movement, moving, network, networking, people, progress, render, society, blossom, bud, cluster, efflorescence etc.-PPT flower petal diagram presentation powerpoint tips editable Templates-Abstract, Arrow, Background, Blank, Blue, Business, Button, Chart, Circle, Concept, Cycle, Diagram, Direction, Element, Flower, Graph, Graphic, Green, Guide, Icon, Illustration, Isolated, Leader, Management, Marketing, Model, Organization, Presentation, Process, Red, Report, Representation, Step, Template, Text, Tool, Vector, White

Ppt PowerPoint Presentation Circular Flow Of Process 4 State Diagram Templates
PPT powerpoint presentation circular flow of process 4 state diagram Templates-This PowerPoint Diagram shows four colorful curved arrows combining together to form a 3D circle. It is helpful to describe interrelated issues, Approaches or Methods. It imitates alternation, chain, circle, circuit, course, loop, period, periodicity, revolution, rhythm, ring, rotation, round, run, sequel, sequence, series, succession etc.-PPT powerpoint presentation circular flow of process 4 state diagram Templates-Arrow, Art, Background, Beautiful, Bright, Business, Circle, Collection, Color, Colorful, Concentric, Concept, Connection, Contrast, Creative, Decoration, Design, Effect, Element, Graphic, Green, Group, Icon, Illustration, Image, Isolated, Light, Pattern, Pie, Red, Render, Round, Sample, Shape, Solution, Style, Success, Symbol, Technology, Wheel, White, Yellow
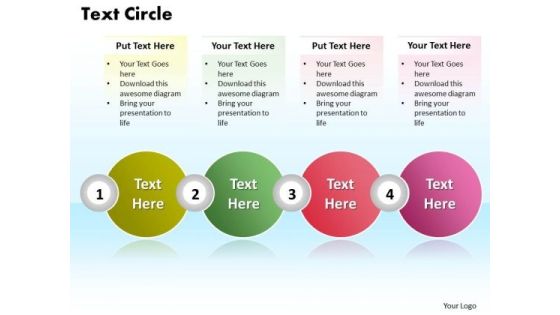
Ppt 4 Stages Rotate Text PowerPoint 2010 Unit Circle Presentation Templates
PPT 4 stages rotate text powerpoint 2010 unit circle presentation Templates-Circular Text boxes can illustrate the flow of money in the economy. This Interconnected circular-flow diagram of four stages is a visual model of the economy that shows how dollars flow through markets among households and firms.-PPT 4 stages rotate text powerpoint 2010 unit circle presentation Templates-Abstract, Art, Artistic, Backdrop, Background, Bend, Black, Business, Circle, Copy-Space, Create, Design, Dot, Dotted, Draw, Element, Flower, Gradient, Grid, Icon, Illustration, Leaf, Leaves, Logo, Mold, Motif, Nature, Pattern, Petal, Radiate, Retro, Round

Ppt Abstraction Of Three Text Circles PowerPoint Templates
PPT abstraction of three text circles PowerPoint Templates-Circular Text boxes can illustrate the flow of money in the economy. This Interconnected circular-flow diagram of four stages is a visual model of the economy that shows how dollars flow through markets among households and firms. It shows three text boxes to represent issues.-PPT abstraction of three text circles PowerPoint Templates-Abstract, Art, Artistic, Backdrop, Background, Bend, Black, Business, Circle, Copy-Space, Create, Design, Dot, Dotted, Draw, Element, Flower, Gradient, Grid, Icon, Illustration, Leaf, Leaves, Logo, Mold, Motif, Nature, Pattern, Petal, Radiate, Retro, Round
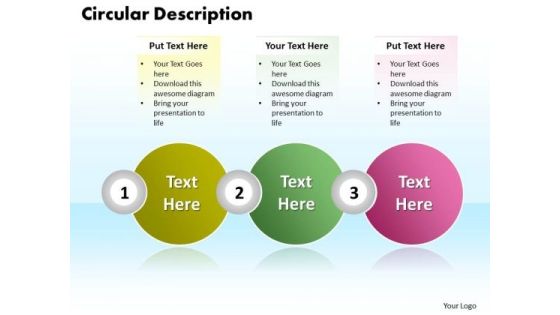
Ppt Circular Motion PowerPoint Description Of Three Text Boxes Templates
PPT circular motion powerpoint description of three text boxes Templates-Use this diagram as a method of graphically representing the flow of data through an information processing system. This PowerPoint Diagram will let you express the views about capital and labor, commercialism, market, merchandising, production and distribution, racket, sales, selling, trading, traffic, transaction, undertaking through this three colorful circular text boxes.-PPT circular motion powerpoint description of three text boxes Templates-Abstract, Art, Artistic, Backdrop, Background, Bend, Black, Business, Circle, Copy-Space, Create, Design, Dot, Dotted, Draw, Element, Flower, Gradient, Grid, Icon, Illustration, Leaf, Leaves, Logo, Mold, Motif, Nature, Pattern, Petal, Radiate, Retro, Round

Ppt Comparison Diagram Of 4 Colorful State PowerPoint Templates
PPT comparison diagram of 4 colorful state PowerPoint Templates-This Detailed Flow Diagram displays the activities you may need to execute to achieve successful implementation and in-service management of your services program. You can show various processes with these linear designed Circular pieces. This image has been conceived to enable you to emphatically communicate your ideas in your Comparing 4 quantities PPT presentation.-PPT comparison diagram of 4 colorful state PowerPoint Templates-3d, Abstract, Backgrounds, Ball, Business, Choice, Comparison, Concept, Descriptive, Equilibrium, Grow, Illustrations, Instrument, Measurement, Metallic, Part, Partnership, Pattern, Progress, Reflections, Scales, Several, Sphere, Strategy, Success
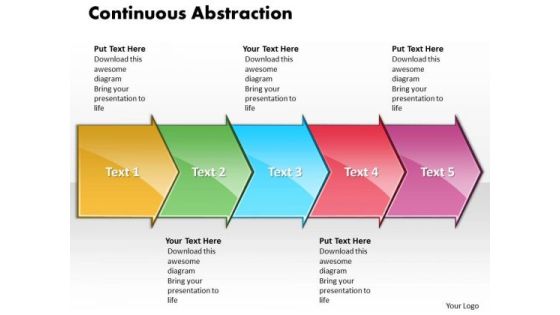
Ppt Continuous Abstraction By 5 Circular Arrows PowerPoint 2010 Templates
PPT continuous abstraction by 5 circular arrows powerpoint 2010 Templates-This diagram helps you to analyze all the connected ideas and also can be used to show three aspects of an issue. This PowerPoint Linear process diagram is used to show interrelated ideas or concepts. This diagram is useful in just about any type of presentation.-PPT continuous abstraction by 5 circular arrows powerpoint 2010 Templates-Arrow, Background, Process, Business, Chart, Diagram, Financial, Graphic, Gray, Icon, Illustration, Management, Orange, Perspective, Process, Reflection, Stage, Spheres, Text, Transparency, Linear

Ppt Continuous Illustration Of 6 Issues PowerPoint Templates
PPT continuous illustration of 6 issues PowerPoint Templates-Use this 3d Arrow PPT slide to show the sequence of events in a story or describe the steps to be taken in a process. This Diagram can present a simple, high-level view of the operations that a system performs, in the order in which they are performed, or a more detailed view-PPT continuous illustration of 6 issues PowerPoint Templates-Linear, Flow, Arrow, Background, Process, Business, Chart, Diagram, Financial, Graphic, Gray, Icon, Illustration, Management, Orange, Perspective, Process, Reflection, Stage, Spheres, Text,

Ppt Uniform Demonstration Of 6 Power Point Stage PowerPoint Templates
PPT uniform demonstration of 6 power point stage PowerPoint Templates-Develop competitive advantage with our above Diagram which contains a Picture of six stages organized in Horizontal Manner. It is a useful captivating tool enables you to define your message in your Marketing PPT presentations. You can edit text, color, shade and style as per you need.-PPT uniform demonstration of 6 power point stage PowerPoint Templates-Linear, Flow, Arrow, Background, Process, Business, Chart, Diagram, Financial, Graphic, Gray, Icon, Illustration, Management, Orange, Perspective, Process, Reflection, Stage, Spheres, Text,

Ppt Vertical 6 Steps Downward PowerPoint Templates
PPT vertical 6 steps downward PowerPoint Templates-This PowerPoint Diagram shows six arrows placed Vertically to give an effective way to present your views. This Diagram can be used to show complex processes. This can be used for Presentations on circuitous, complicated, composite, compound, compounded, confused, conglomerate, convoluted, elaborate, entangled etc. An excellent graphic to attract the attention of your audience to improve earnings.-PPT vertical 6 steps downward PowerPoint Templates-Arrow, Background, Process, Business, Chart, Diagram, Financial, Graphic, Gray, Icon, Illustration, Management, Orange, Perspective, Planning Process, Stages, Steps, Text

Ppt Consistent Course Of Four State Diagram Involved Procedure PowerPoint Templates
PPT consistent course of four state diagram involved procedure PowerPoint Templates-This PowerPoint diagram slide shows explanation of four stages. The arrows move from one stage to another. Use this diagram to show general stages in the development of a product, or a timeline or schedule. Our stunning image makes your presentations simpler and professional showing that you care about even the smallest details.-PPT consistent course of four state diagram involved procedure PowerPoint Templates-Abstraction, Ad, Arrow, Background, Banner, Brochure, Business, Color, Company, Corporate, Cover, Coworker, Abstract, Design, Digital, Folder, Friends, Gradient, Graphic, Icon, Illustration, Label, Layout, Magazine, Marketing

Ppt Consistent Movement Of Four State Diagram Involved Procedure PowerPoint Templates
PPT consistent movement of four state diagram involved procedure PowerPoint Templates-This PowerPoint diagram slide shows explanation of four stages. The arrows moves from one stage to another. Use this diagram to show general stages in the development of a product, or a timeline or schedule. Our stunning image makes your presentations simpler and professional showing that you care about even the smallest details.-PPT consistent movement of four state diagram involved procedure PowerPoint Templates-Abstraction, Ad, Arrow, Background, Banner, Brochure, Business, Color, Company, Corporate, Cover, Coworker, Abstract, Design, Digital, Folder, Friends, Gradient, Graphic, Icon, Illustration, Label, Layout, Magazine, Marketing
 Home
Home