Circular Text
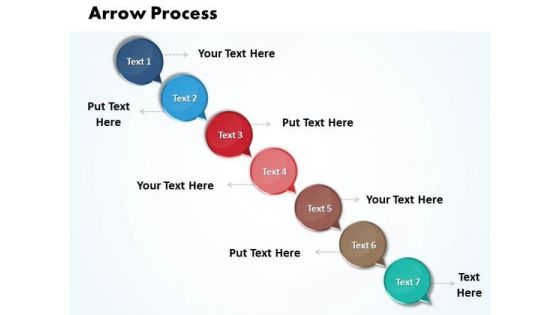
Ppt Arrow 7 Power Point Stage PowerPoint Templates
PPT arrow 7 power point stage PowerPoint Templates-Analyze the seven success factors of your business with this circular business chart for Microsoft PowerPoint presentations-PPT arrow 7 power point stage PowerPoint Templates-Arrow Process, Business, Circle, Circular, Collection, Connection, Cursor, Decoration, Design, Dimensional, Direction, Element, Icon, Illustration, Information, Modern, Motion, Paper, Perspective, Plastic, Pointer, 7 Pointing, Recycle, Recycling, Reflective, Set, Shape, Shiny, Sign, Symbol, Technology

Circles For Business Process And Technology Powerpoint Templates
This PowerPoint diagram slide contains circular infographic. Download this diagram slide to display six steps of business process. You can edit text, color, shade and style of this diagram as per you need.

Ppt Parellel Demonstration Of 7 Phase Diagram PowerPoint Templates
PPT parellel demonstration of 7 phase diagram PowerPoint Templates-Use this graphic to represent a continuing sequence of stages, tasks, or events and emphasizes the connection between all components. This 3D Circular Diagram in Horizontal manner can be helpful for explaining different approaches which are connected to other arrows for business process.-PPT parellel demonstration of 7 phase diagram PowerPoint Templates-Arrow, Background, Process, Business, Chart, Diagram, Financial, Graphic, Gray, Icon, Illustration, Management, Orange, Perspective, Planning Process, Stages, Steps, Text

Apple Emotional Marketing Strategy Brand Storytelling Overview Elements Statistics Professional PDF
This slide showcases general overview of brand storytelling strategy with elements and key statistics. It provides details about plot points, neural activity, stats, information, marketers, content marketing, service and product value, authentic, relatable, user generated content, etc. If you are looking for a format to display your unique thoughts, then the professionally designed Apple Emotional Marketing Strategy Brand Storytelling Overview Elements Statistics Professional PDF is the one for you. You can use it as a Google Slides template or a PowerPoint template. Incorporate impressive visuals, symbols, images, and other charts. Modify or reorganize the text boxes as you desire. Experiment with shade schemes and font pairings. Alter, share or cooperate with other people on your work. Download Apple Emotional Marketing Strategy Brand Storytelling Overview Elements Statistics Professional PDF and find out how to give a successful presentation. Present a perfect display to your team and make your presentation unforgettable.
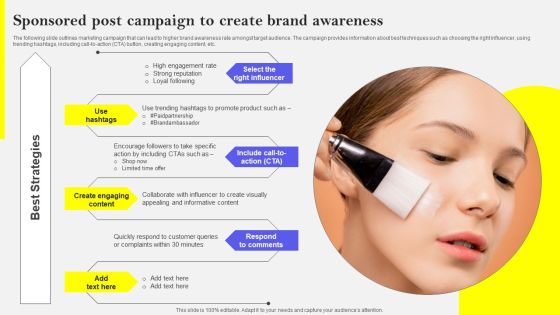
Sponsored Post Campaign To Create Brand Awareness Introduction PDF
The following slide outlines marketing campaign that can lead to higher brand awareness rate amongst target audience. The campaign provides information about best techniques such as choosing the right influencer, using trending hashtags, including call-to-action CTA button, creating engaging content, etc. If you are looking for a format to display your unique thoughts, then the professionally designed Sponsored Post Campaign To Create Brand Awareness Introduction PDF is the one for you. You can use it as a Google Slides template or a PowerPoint template. Incorporate impressive visuals, symbols, images, and other charts. Modify or reorganize the text boxes as you desire. Experiment with shade schemes and font pairings. Alter, share or cooperate with other people on your work. Download Sponsored Post Campaign To Create Brand Awareness Introduction PDF and find out how to give a successful presentation. Present a perfect display to your team and make your presentation unforgettable.

Operational Risk Assessment And Management Plan Five Categories Of Operational Risk Management Pictures PDF
This slide represents the types of risks which occur as result of uncertainties faced by the business in course of conducting daily business activities, procedures and system. It includes ORM categories such as people risk, process risk etc. Are you in need of a template that can accommodate all of your creative concepts This one is crafted professionally and can be altered to fit any style. Use it with Google Slides or PowerPoint. Include striking photographs, symbols, depictions, and other visuals. Fill, move around, or remove text boxes as desired. Test out color palettes and font mixtures. Edit and save your work, or work with colleagues. Download Operational Risk Assessment And Management Plan Five Categories Of Operational Risk Management Pictures PDF and observe how to make your presentation outstanding. Give an impeccable presentation to your group and make your presentation unforgettable.

Regenerative Artificial Intelligence Systems Future Role Of Chatgpt Openai Model Inspiration PDF
This slide talks about the predicted upgradations and improvements of ChatGPT model in future. These are accuracy improvement, more adaptable, better speed, precise use case, compatible with other technologies, and security and privacy. If you are looking for a format to display your unique thoughts, then the professionally designed Regenerative Artificial Intelligence Systems Future Role Of Chatgpt Openai Model Inspiration PDF is the one for you. You can use it as a Google Slides template or a PowerPoint template. Incorporate impressive visuals, symbols, images, and other charts. Modify or reorganize the text boxes as you desire. Experiment with shade schemes and font pairings. Alter, share or cooperate with other people on your work. Download Regenerative Artificial Intelligence Systems Future Role Of Chatgpt Openai Model Inspiration PDF and find out how to give a successful presentation. Present a perfect display to your team and make your presentation unforgettable.

Infographic Cycle Of Data Communication Powerpoint Template
Our above PPT slide contains graphics of circular diagram. This business diagram helps to display outline of business plan. Use this template to impart more clarity to data and to create more sound impact on viewers.

Five Steps Business Planning Process Ppt PowerPoint Presentation Portfolio Information
This is a five steps business planning process ppt powerpoint presentation portfolio information. This is a five stage process. The stages in this process are 5 stages circular arrows, 5 steps circle arrows, 5 stages cycle arrows.
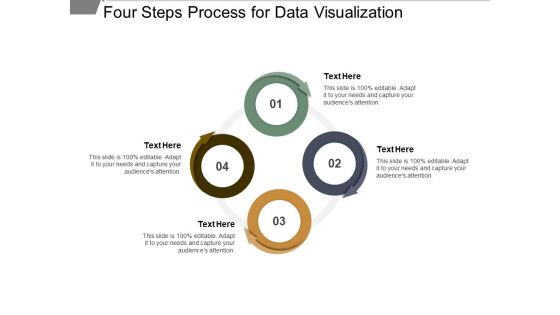
Four Steps Process For Data Visualization Ppt PowerPoint Presentation Infographic Template Inspiration
This is a four steps process for data visualization ppt powerpoint presentation infographic template inspiration. This is a four stage process. The stages in this process are circle process 4 arrows, circle cycle 4 arrows, circular process 4 arrows.

Business Information Processing With Icons Ppt PowerPoint Presentation Outline Example File
This is a business information processing with icons ppt powerpoint presentation outline example file. This is a four stage process. The stages in this process are cycle diagram, circular process, cyclical process.

Colorful Circle Arrow Diagram Powerpoint Template
Our above PPT slide contains circular arrow design. This business diagram helps to exhibit process flow. Use this diagram to impart more clarity to data and to create more sound impact on viewers.

Colorful Circle Arrow Design Powerpoint Template
Our above PPT slide contains circular arrow design. This business diagram helps to exhibit process flow. Use this diagram to impart more clarity to data and to create more sound impact on viewers.
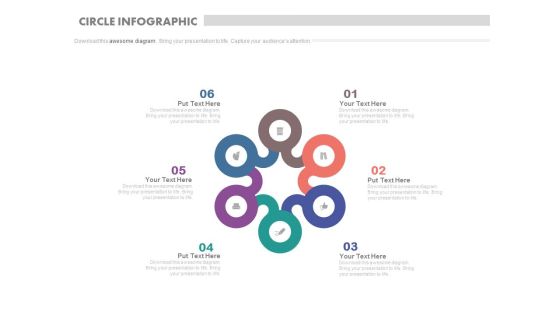
Six Steps Circle Infographics For Process Flow Powerpoint Slides
This business slide contains circular infographic design. This diagram provides schematic representation of any information. Visual effect this slide helps in maintaining the flow of the discussion and provides more clarity to the subject.

Circle For Strategic Marketing Plan Outline Powerpoint Template
This PowerPoint template has been designed with circular wheels diagram. This diagram provides schematic representation of any information. Visual effect this slide helps in maintaining the flow of the discussion and provides more clarity to the subject.

Eight Steps Circle Infographic Chart Powerpoint Slides
This business slide contains circular infographic design. This diagram provides schematic representation of any information. Visual effect this slide helps in maintaining the flow of the discussion and provides more clarity to the subject.

Comprehensive Guide On AI Chat Assistant Open AI Chatgpt Use Case Customer Service Clipart PDF
This slide represents details related to the use case of AI technology designed to understand and generate human like texts based on received inputs. This slide covers details related to the use case of customer serviceFind highly impressive Comprehensive Guide On AI Chat Assistant Open AI Chatgpt Use Case Customer Service Clipart PDF on Slidegeeks to deliver a meaningful presentation. You can save an ample amount of time using these presentation templates. No need to worry to prepare everything from scratch because Slidegeeks experts have already done a huge research and work for you. You need to download Comprehensive Guide On AI Chat Assistant Open AI Chatgpt Use Case Customer Service Clipart PDF for your upcoming presentation. All the presentation templates are 100 percent editable and you can change the color and personalize the content accordingly. Download now.

Circle Infographics For Market Research Analysis Powerpoint Template
This PowerPoint template has been designed with circular infographic diagram. You can use this PPT diagram slide to visually support your content. Above slide is suitable for business presentation.

Circle Chart With Business Planning Icons Powerpoint Slides
This business slide contains circular infographic design. This diagram provides schematic representation of any information. Visual effect this slide helps in maintaining the flow of the discussion and provides more clarity to the subject.

Circle Chart Marketing Research Analysis Powerpoint Template
Above PPT slide provides the ideal backdrop to display marketing research analysis. This PowerPoint template contains graphics of circular arrows chart. Add this diagram in your presentations to visually support your content.

Colorful Infographics For Corporate Financing Powerpoint Template
This business slide contains five steps circular infographic design. This diagram provides schematic representation of any information. Visual effect this slide helps in maintaining the flow of the discussion and provides more clarity to the subject.
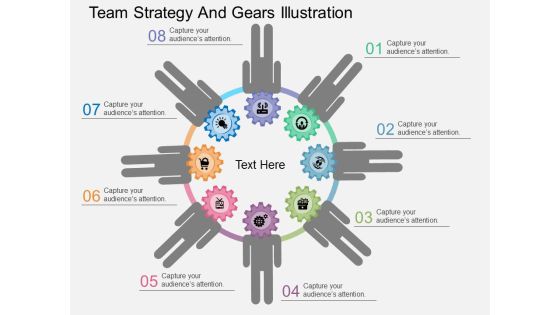
Team Strategy And Gears Illustration Powerpoint Template
Our above PPT slide contains graphics of team gear icons in circular flow. This PowerPoint template may be used to depict team strategy. Use this diagram to impart more clarity to data and to create more sound impact on viewers.

Analyzing Email Click Through Rate For Better Campaign Performance Slides PDF
This slide covers an overview of email click through rate KPI to identify total email recipients who clicked on one or more links attached in the email. It also includes strategies to increase the email click through rate, such as incorporating compelling calls to action, using A or B email testing, collecting recipient feedback, etc. If you are looking for a format to display your unique thoughts, then the professionally designed Analyzing Email Click Through Rate For Better Campaign Performance Slides PDF is the one for you. You can use it as a Google Slides template or a PowerPoint template. Incorporate impressive visuals, symbols, images, and other charts. Modify or reorganize the text boxes as you desire. Experiment with shade schemes and font pairings. Alter, share or cooperate with other people on your work. Download Analyzing Email Click Through Rate For Better Campaign Performance Slides PDF and find out how to give a successful presentation. Present a perfect display to your team and make your presentation unforgettable.

Four Option Diagram For Target Planning Powerpoint Templates
Develop competitive advantage with our above template which contains circular diagram for target planning. This diagram helps to display timeline, planning and management concepts. This slide is editable you can change text, color, shade and style as per you need.
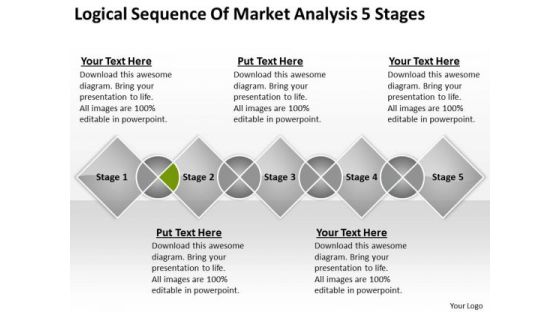
Sequence Of Market Analysis 5 Stages Ppt Business Plan PowerPoint Templates
We present our sequence of market analysis 5 stages ppt business plan PowerPoint templates.Use our Process and Flows PowerPoint Templates because Our PowerPoint Templates and Slides are topically designed to provide an attractive backdrop to any subject. Download and present our Marketing PowerPoint Templates because Our PowerPoint Templates and Slides will let you meet your Deadlines. Present our Shapes PowerPoint Templates because Our PowerPoint Templates and Slides will definately Enhance the stature of your presentation. Adorn the beauty of your thoughts with their colourful backgrounds. Download our Flow Charts PowerPoint Templates because Our PowerPoint Templates and Slides ensures Effective communication. They help you put across your views with precision and clarity. Download and present our Business PowerPoint Templates because you should Whip up a frenzy with our PowerPoint Templates and Slides. They will fuel the excitement of your team.Use these PowerPoint slides for presentations relating to Step, process, elements, square, brochure, flow, blank, process, plan, concept, workflow, diagram, rotation,presentation, glossy, bright, symbol, diagram, brochure, element, marketing, blockdiagram, development, abstract, management, manage, illustration,connection, chart, flowchart, strategy, round, section, forum, solution, processchart, direction, design, text, module, workflow diagram, flow diagram, circular flow, present. The prominent colors used in the PowerPoint template are Green, Gray, Black.

Sequence Of Market Analysis 5 Stages Business Financial Planning PowerPoint Templates
We present our sequence of market analysis 5 stages business financial planning PowerPoint templates.Download our Flow Charts PowerPoint Templates because You can Give birth to your ideas with our PowerPoint Templates and Slides. See them grow big and strong in record time. Use our Process and Flows PowerPoint Templates because Our PowerPoint Templates and Slides will let your team Walk through your plans. See their energy levels rise as you show them the way. Use our Business PowerPoint Templates because You can Rise to the occasion with our PowerPoint Templates and Slides. You will bring your audience on their feet in no time. Use our Marketing PowerPoint Templates because You can Zap them with our PowerPoint Templates and Slides. See them reel under the impact. Present our Shapes PowerPoint Templates because Our PowerPoint Templates and Slides are endowed to endure. Ideas conveyed through them will pass the test of time.Use these PowerPoint slides for presentations relating to Step, process, elements, square, brochure, flow, blank, process, plan, concept, workflow, diagram, rotation,presentation, glossy, bright, symbol, diagram, brochure, element, marketing, blockdiagram, development, abstract, management, manage, illustration,connection, chart, flowchart, strategy, round, section, forum, solution, processchart, direction, design, text, module, workflow diagram, flow diagram, circular flow, present. The prominent colors used in the PowerPoint template are Green lime, White, Gray.

Ppt Oval Arrows 7 Scientific Method Steps PowerPoint Presentation Templates
PPT oval arrows 7 scientific method steps powerpoint presentation Templates-Use this circular diagram illustrating a seven step process. Go ahead and add charm a to your presentations with our high quality PPt slide.-PPT oval arrows 7 scientific method steps powerpoint presentation Templates-Arrow, Background, Beautiful, Blue, Business, Button, Chart, Circle, Circular, Concept, Continous, Continuity, Continuous, Cycle, Diagram, Directional, Divisions, Graph, Icon, Illustration, Isolated, Modern, Multicolored, Presentation, Process, Profit, Progress, Recycle, Red, Research, Round, Segments, Sequence, Set, Sphere, Strategy, Success, Text, Trendy, Wheel

Risks Types Of Outsourcing Fraud Financial And Data Security Ppt PowerPoint Presentation File Example
Presenting this set of slides with name risks types of outsourcing fraud financial and data security ppt powerpoint presentation file example. This is a four stage process. The stages in this process are business process outsourcing, circular infographics, threats. This is a completely editable PowerPoint presentation and is available for immediate download. Download now and impress your audience.

Agile Techniques For Improving Tasks And Enhancing Team Performance Financial Download PDF
Presenting agile techniques for improving tasks and enhancing team performance financial download pdf to provide visual cues and insights. Share and navigate important information on five stages that need your due attention. This template can be used to pitch topics like circular diagram. In addtion, this PPT design contains high resolution images, graphics, etc, that are easily editable and available for immediate download.
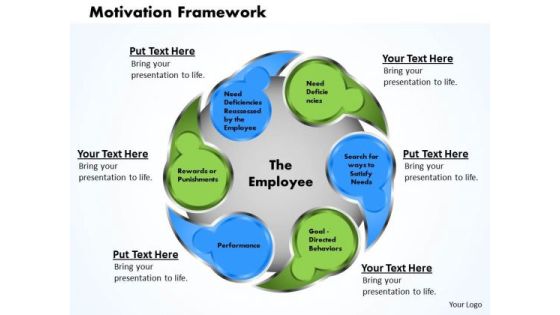
Business Framework Motivation Framework PowerPoint Presentation
Explain the motivational theories for organization and employees with this Motivational Framework. We have used graphic of colored and circular process chart which contains the concept of motivation. Use this template in your presentation and motivate your viewers.
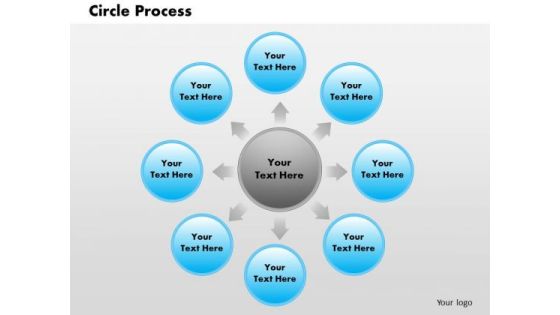
Business Framework Circle Process PowerPoint Presentation
A five staged multicolored circular process chart has been used to decorate this PPT. this business framework PPT is usable for various process flow with multiple levels. Use this PPT in your presentation and get good comments from viewers.
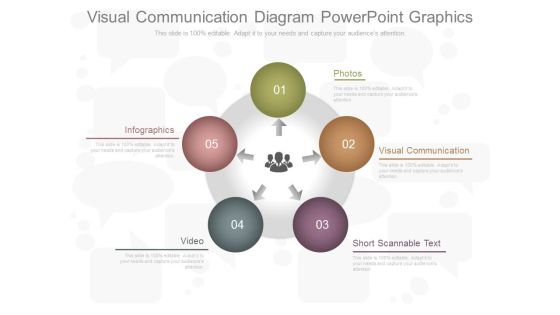
Visual Communication Diagram Powerpoint Graphics
This is a visual communication diagram powerpoint graphics. This is a five stage process. The stages in this process are photos, visual communication, short scannable text, video, infographics.
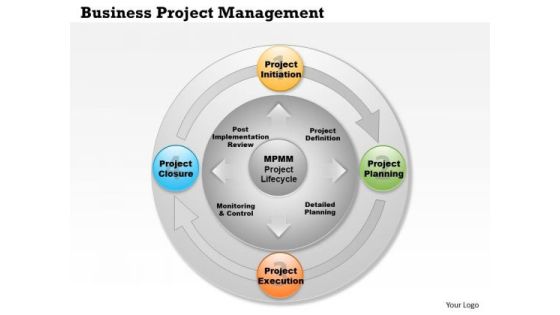
Business Framework Business Project Management PowerPoint Presentation
Display the concept of business project management with this unique business framework PPT. This PPT slide contains the graphic of circular process chart with four steps. Use this PPT slide and create a professional presentation for business project management.

Business Framework Knowledge Management PowerPoint Presentation
This business diagram depicts framework of knowledge management. This slide contains five interconnected circles with terms knowledge creation, knowledge identification and capture, knowledge storage, knowledge sharing, knowledge application and use. Download this circular diagram as a tool for business presentations.
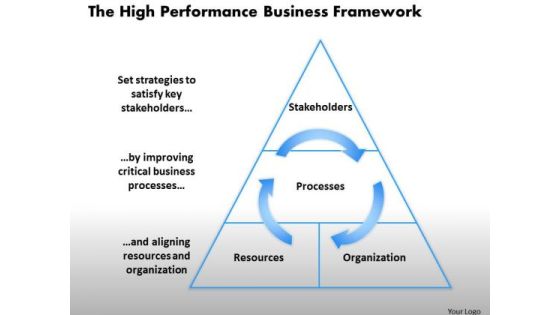
Business Framework The High Performance Business Framework 1 PowerPoint Presentation
This slide exhibits framework of high performance business. It contains pyramid diagram with circular arrows depicting strategies to satisfy key stakeholder by improving critical business processes and aligning resources and organization.
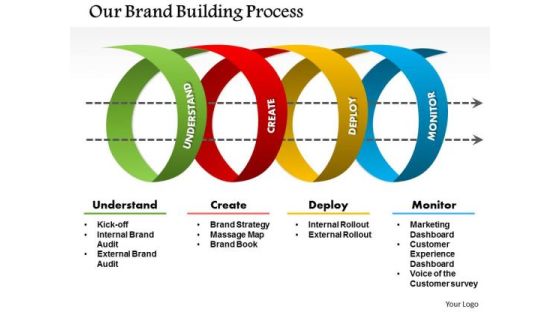
Business Framework Brand Value Management PowerPoint Presentation
Define the brand value management with this power point diagram slide. To display this management system we have used graphic multicolors circular design with continuous process techniques. Use this diagram slide in your business and production presentations.

Business Framework Phases Of The Credit Cycle PowerPoint Presentation
Four arrows with interconnection in circular design has been used to design this power Point template slide. This diagram slide contains the concept of credit phases. This PPT slide can be used for financial presentations.
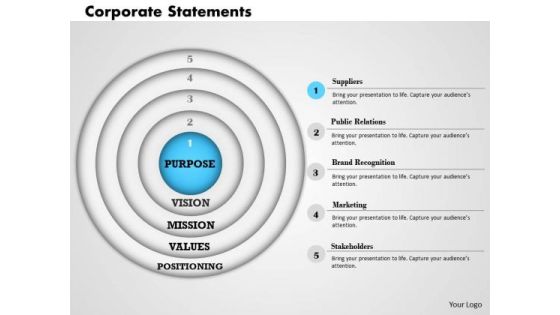
Business Framework Corporate Statement PowerPoint Presentation
This innovative image slide has been designed to display corporate statements in circular disks. This business framework template may be used to display corporate mission statement in your presentations. This image slide will enhance the quality of your presentations.
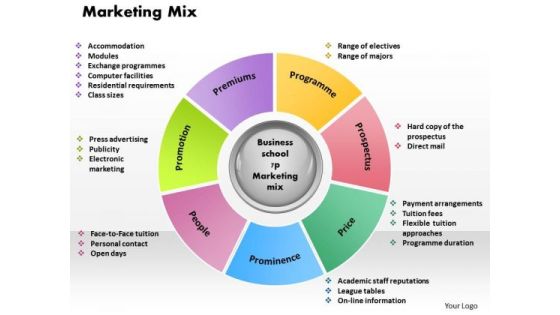
Business Framework Marketing Mix 2 PowerPoint Presentation
A multicolored and multistage circular process chart has been used to develop this business framework PPT. This template contains the concept of process flow for marketing strategy. Use this PPT and build a unique presentation for your viewers.

Business Framework Accounting Ratios PowerPoint Presentation
This professional diagram displays four segments with accounting ratios. This circular diagram shows liquidity ratio, activity ratio, leverage ratios and profitability ratios. Use this diagram to display accounting procedure in graphical way.

Business Framework Accounting Review PowerPoint Presentation
This circular diagram depicts the steps involved in the accounting process from when a transaction occurs up the end of period reports. Use this diagram to display accounting procedure in graphical way.
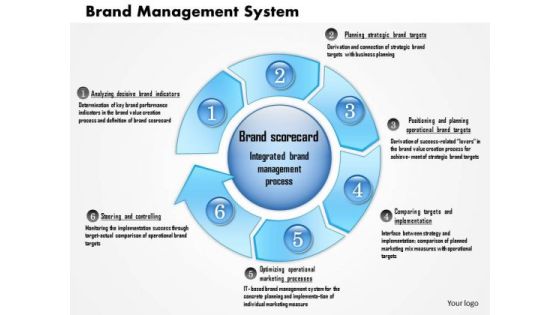
Business Framework Brand Management System PowerPoint Presentation
Explain the concept of brand management in any business presentation with this exclusive power point slide. We have used circular flow chart with multiple stages for displaying this system. This image may be used for sales and finance related presentations.

Multi Segment Circle For Data Interpretation Powerpoint Template
This PowerPoint template has been designed with circular web diagram. This diagram is useful to display outline of a business plan. Visual effect helps in maintaining the flow of the discussion and provides more clarity to the subject.

Business Framework Business Process Improvement Model PowerPoint Presentation
This Business framework diagram Pot has been designed with graphic of circular decision flow chart. This diagram PPT slide is suitable for business process improvement. Make a model for process improvement and display the sequence of decisions.

Business Framework Key Performance Indicators Customer Service PowerPoint Presentation
Our above diagram provides framework of key performance indicators for customer service. It contains circular diagram in four segments depicting concepts of delivery problems, customer care training. Download this diagram to make professional presentations on customer service.

Business Framework The Six Elements Of Corporate Strategy PowerPoint Presentation
This business framework Power Point diagram template has been designed with graphic of circular stage. These six elements are used to display corporate strategy. Use this PPT diagram for management and leadership related presentations.
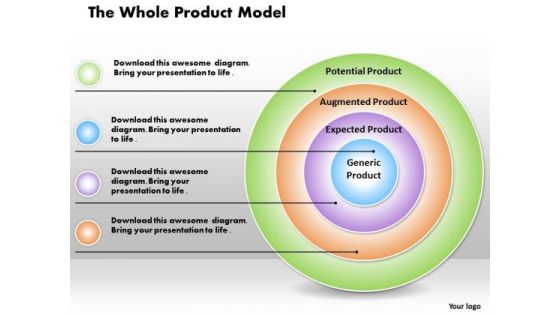
Business Framework The Whole Product Model PowerPoint Presentation
This business framework power point diagram template has been crafted with graphic of multicolored circular board. This board graphic can be used for whole product model representation. This PPT diagram can be used for production and marketing related presentations.
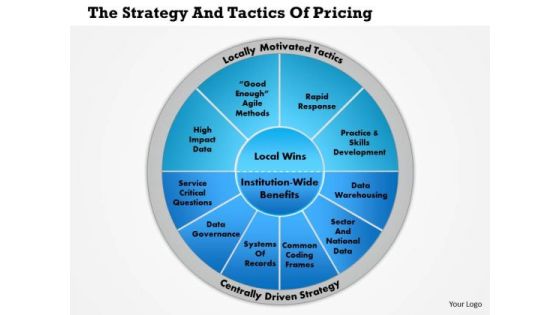
Business Framework The Strategy And Tactics Of Pricing PowerPoint Presentation
A multistage circular diagram has been used to design this Power Point template slide. This PPT slide contains the concept of strategy and tactics for building strategies. Use this PPT and get good comments from your viewers.

Infographic For Financial Statement Analysis PowerPoint Templates
This PowerPoint template contains infographic slide. This diagram has been designed with circular infographic to exhibit financial statement analysis. Use this diagram to set targets and to measure performance in your presentations.

Business Diagram Key Performance Indicators Customer Service PowerPoint Ppt Presentation
Our above diagram provides framework of key performance indicators for customer service. It contains circular diagram in four segments depicting concepts of delivery problems, customer care training. Download this diagram to make professional presentations on customer service.
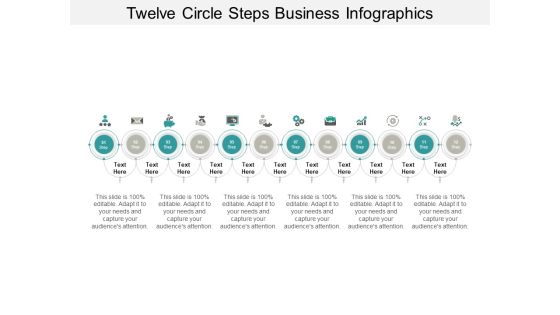
Twelve Circle Steps Business Infographics Ppt PowerPoint Presentation Gallery Information
This is a twelve circle steps business infographics ppt powerpoint presentation gallery information. This is a twelve stage process. The stages in this process are 10 circle, 10 circular diagram, 10 cycle.
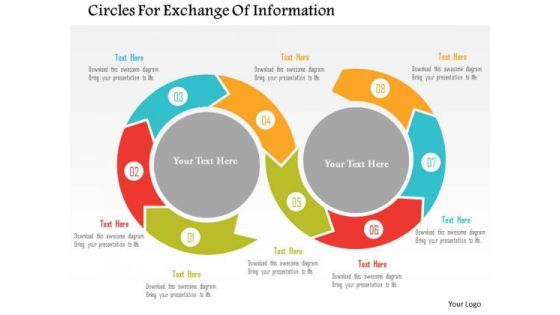
Business Diagram Circles For Exchange Of Information PowerPoint Templates
Circular graphics with icons have been used in this power point template. This diagram may be used for exchange of information. Use this diagram to illustrate your thoughts and experiences to your staff.
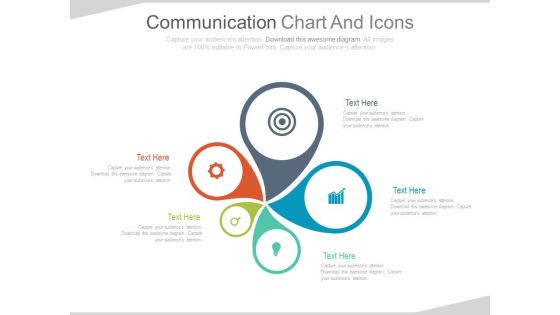
Infographic Chart For Marketing Information Powerpoint Slides
This PowerPoint template contains circular infographic chart. You may download this PPT slide to display marketing information in visual manner. You can easily customize this template to make it more unique as per your need.
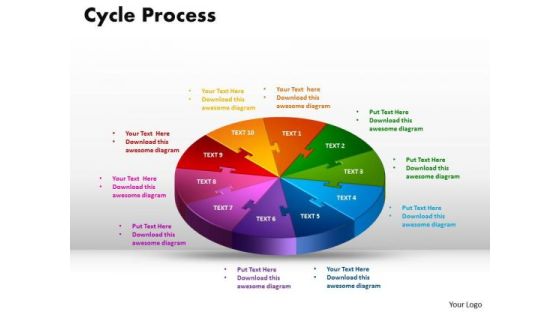
PowerPoint Backgrounds Cycle Process Chart Ppt Theme
PowerPoint Backgrounds Cycle Process Chart PPT Theme-Use this diagram to show a progression or a sequence of stages, tasks, or events in a circular flow. Emphasizes the interconnected pieces.-PowerPoint Backgrounds Cycle Process Chart PPT Theme
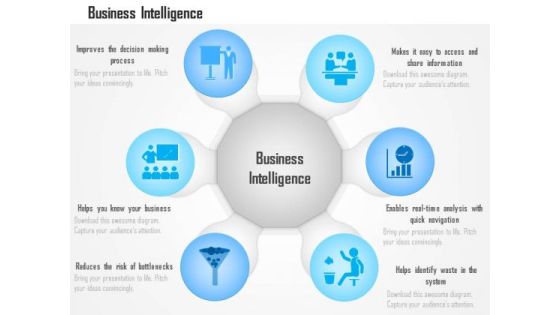
Business Diagram Benefits Advantages Of Business Intelligence Data Analytics Ppt Slide
This technology diagram has been designed with graphic of circular chart with various icons. This slide contains the concept of business intelligence data analytics. Explain advantages of business intelligence in any technical presentations with this quality diagram.
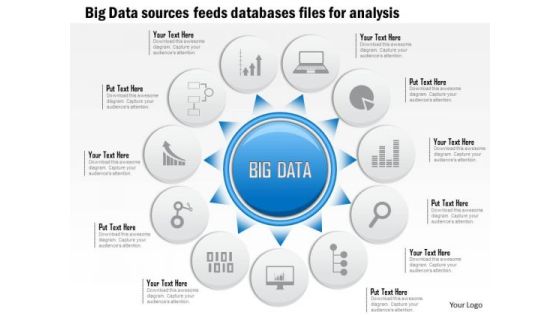
Business Diagram Big Data Sources Sensors Feeds Databases Files For Analysis Ppt Slide
This slide has been designed with graphic of circular source diagram. This diagram contains the concept of data source sensors and feeds of database files. Download this editable slide to build an exclusive presentation for your viewers.

Circle Chart With Percentage Value Analysis Powerpoint Slides
This PowerPoint template has been designed with circular process diagram. This business diagram helps to exhibit financial process control and analysis. Use this diagram to visually support your content.

Business Diagram Four Circles Of Marketing Mix Presentation Template
This diagram has been designed with circular graphics. This business slide may be used to depict marketing mix. Download our above diagram to express information in a visual way.

Business Diagram Circle Of Corporate Social Responsibility Presentation Template
This diagram has been designed with circular graphics. This business slide may be used to depict impact of corporate management on society. Download our above diagram to express information in a visual way.
Business Diagram Innovative Icons Infographic Presentation Template
Three circular innovative icons has been used to decorate this power point diagram template. This diagram is info graphic for data representation. Use this info graphics for business and management related presentations.

 Home
Home