AI PPT Maker
Templates
PPT Bundles
Design Services
Business PPTs
Business Plan
Management
Strategy
Introduction PPT
Roadmap
Self Introduction
Timelines
Process
Marketing
Agenda
Technology
Medical
Startup Business Plan
Cyber Security
Dashboards
SWOT
Proposals
Education
Pitch Deck
Digital Marketing
KPIs
Project Management
Product Management
Artificial Intelligence
Target Market
Communication
Supply Chain
Google Slides
Research Services
 One Pagers
All Categories
-
Home
- Customer Favorites
- Chart Analysis
Chart Analysis

Auto Sales Revenues Scorecard Of Multiple Countries Inspiration PDF
This graph or chart is linked to excel, and changes automatically based on data. Just left click on it and select Edit Data. Deliver an awe inspiring pitch with this creative Auto Sales Revenues Scorecard Of Multiple Countries Inspiration PDF bundle. Topics like Auto Sales Revenues, Scorecard Multiple Countries can be discussed with this completely editable template. It is available for immediate download depending on the needs and requirements of the user.

Auto Sales Weekly Performance Assessment Scorecard Background PDF
This graph or chart is linked to excel, and changes automatically based on data. Just left click on it and select Edit Data. Deliver and pitch your topic in the best possible manner with this Auto Sales Weekly Performance Assessment Scorecard Background PDF. Use them to share invaluable insights on Auto Sales Weekly, Performance Assessment Scorecard and impress your audience. This template can be altered and modified as per your expectations. So, grab it now.

Automobile Sales Scorecard Competitor Assessment Scorecard For Auto Sales Demonstration PDF
This graph or chart is linked to excel, and changes automatically based on data. Just left click on it and select Edit Data. Deliver an awe inspiring pitch with this creative Automobile Sales Scorecard Competitor Assessment Scorecard For Auto Sales Demonstration PDF bundle. Topics like Competitor Assessment Scorecard, Auto Sales Product can be discussed with this completely editable template. It is available for immediate download depending on the needs and requirements of the user.

Automobile Sales Scorecard Quarterly Scorecard For 3 Categories Auto Sales Microsoft PDF
This graph or chart is linked to excel, and changes automatically based on data. Just left click on it and select Edit Data. Deliver an awe inspiring pitch with this creative Automobile Sales Scorecard Quarterly Scorecard For 3 Categories Auto Sales Microsoft PDF bundle. Topics like Quarterly Scorecard Three, Categories Auto Sales can be discussed with this completely editable template. It is available for immediate download depending on the needs and requirements of the user.

Automobile Sales Scorecard With Unit Sold And Average Price Statistics Formats PDF
This graph or chart is linked to excel, and changes automatically based on data. Just left click on it and select Edit Data. Deliver an awe inspiring pitch with this creative Automobile Sales Scorecard With Unit Sold And Average Price Statistics Formats PDF bundle. Topics like Automobile Sales Scorecard, Unit Sold Revenue, Average Price Statistics can be discussed with this completely editable template. It is available for immediate download depending on the needs and requirements of the user.

Global Auto Sales Scorecard By Market Share Ideas PDF
This graph or chart is linked to excel, and changes automatically based on data. Just left click on it and select Edit Data. Deliver an awe inspiring pitch with this creative Global Auto Sales Scorecard By Market Share Ideas PDF bundle. Topics like 2022 Sales Statistics, Global Auto Sales, Scorecard Market Share can be discussed with this completely editable template. It is available for immediate download depending on the needs and requirements of the user.
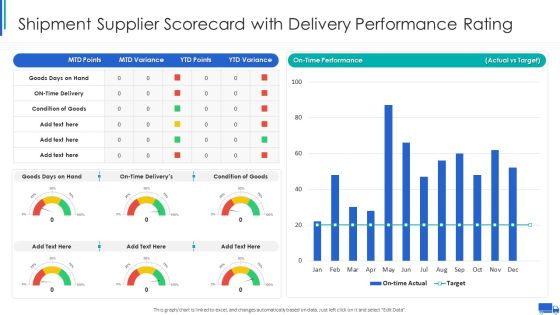
Shipment Supplier Scorecard With Delivery Performance Rating Ppt Ideas Graphic Tips PDF
This graph or chart is linked to excel, and changes automatically based on data. Just left click on it and select Edit Data. Deliver an awe inspiring pitch with this creative Shipment Supplier Scorecard With Delivery Performance Rating Ppt Ideas Graphic Tips PDF bundle. Topics like On Time Performance, Actual Vs Target, Goods Days Hand can be discussed with this completely editable template. It is available for immediate download depending on the needs and requirements of the user.
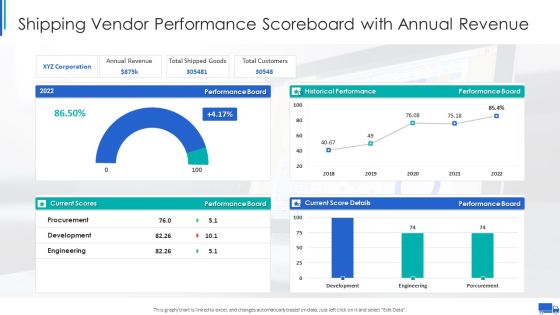
Shipping Vendor Performance Scoreboard With Annual Revenue Ppt Infographics Graphics PDF
This graph or chart is linked to excel, and changes automatically based on data. Just left click on it and select Edit Data. Deliver an awe inspiring pitch with this creative Shipping Vendor Performance Scoreboard With Annual Revenue Ppt Infographics Graphics PDF bundle. Topics like Annual Revenue Board, Total Shipped Goods, Total Customers Performance can be discussed with this completely editable template. It is available for immediate download depending on the needs and requirements of the user.
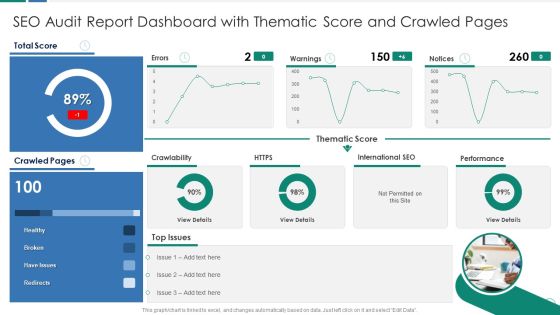
SEO Audit Report Dashboard With Thematic Score And Crawled Pages Download PDF
This graph or chart is linked to excel, and changes automatically based on data. Just left click on it and select Edit Data. Deliver and pitch your topic in the best possible manner with this SEO Audit Report Dashboard With Thematic Score And Crawled Pages Download PDF. Use them to share invaluable insights on Thematic Score Warnings, International SEO Performance, Total Score Healthy and impress your audience. This template can be altered and modified as per your expectations. So, grab it now.

Finance Metrics Dashboard Illustrating Monthly Gross Profit Formats PDF
This graph or chart is linked to excel, and changes automatically based on data. Just left click on it and select edit data. Showcasing this set of slides titled Finance Metrics Dashboard Illustrating Monthly Gross Profit Formats PDF. The topics addressed in these templates are Profit Metrics Gross, Profit Target Cum, Actual Cum Target. All the content presented in this PPT design is completely editable. Download it and make adjustments in color, background, font etc. as per your unique business setting.
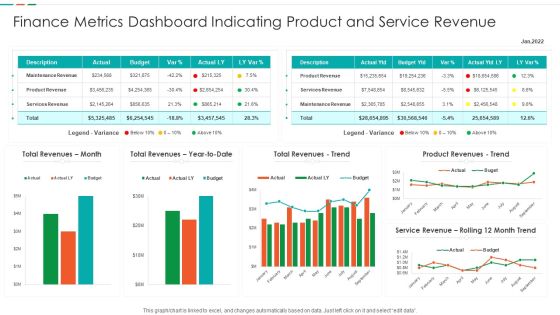
Finance Metrics Dashboard Indicating Product And Service Revenue Designs PDF
This graph or chart is linked to excel, and changes automatically based on data. Just left click on it and select edit data. Showcasing this set of slides titled Finance Metrics Dashboard Indicating Product And Service Revenue Designs PDF. The topics addressed in these templates are Maintenance Revenue Product, Revenue Product Revenues, Service Revenue Rolling. All the content presented in this PPT design is completely editable. Download it and make adjustments in color, background, font etc. as per your unique business setting.
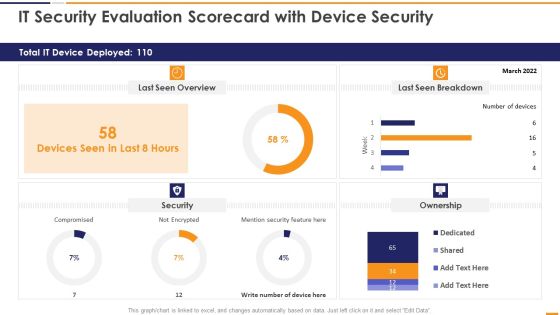
IT Security Evaluation Scorecard With Device Security Ppt Slides Good PDF
This graph or chart is linked to excel, and changes automatically based on data. Just left click on it and select Edit Data. Deliver an awe inspiring pitch with this creative IT Security Evaluation Scorecard With Device Security Ppt Slides Good PDF bundle. Topics like Total IT Device, Last Seen Overview, Last Seen Breakdown, Mention Security Feature can be discussed with this completely editable template. It is available for immediate download depending on the needs and requirements of the user.

IT Security Evaluation Scorecard With Impact Status Ppt Portfolio Guidelines PDF
This graph or chart is linked to excel, and changes automatically based on data. Just left click on it and select Edit Data. Deliver and pitch your topic in the best possible manner with this IT Security Evaluation Scorecard With Impact Status Ppt Portfolio Guidelines PDF. Use them to share invaluable insights on Device Availability Application, Performance Port Health, Devices Reference Firmware and impress your audience. This template can be altered and modified as per your expectations. So, grab it now.
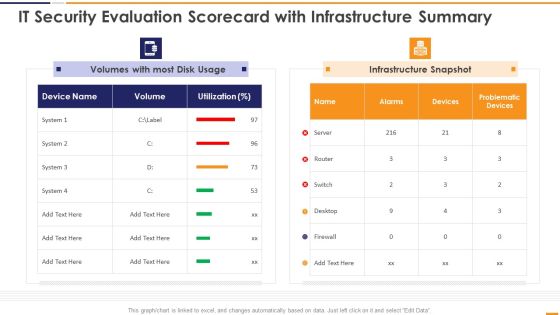
IT Security Evaluation Scorecard With Infrastructure Summary Ppt Slides Portrait PDF
This graph or chart is linked to excel, and changes automatically based on data. Just left click on it and select Edit Data. Deliver an awe inspiring pitch with this creative IT Security Evaluation Scorecard With Infrastructure Summary Ppt Slides Portrait PDF bundle. Topics like Volumes Most Disk, Usage Infrastructure Snapshot can be discussed with this completely editable template. It is available for immediate download depending on the needs and requirements of the user.

IT Security Evaluation Scorecard With Ip Availability Ppt Pictures Portrait PDF
This graph or chart is linked to excel, and changes automatically based on data. Just left click on it and select Edit Data. Deliver and pitch your topic in the best possible manner with this IT Security Evaluation Scorecard With Ip Availability Ppt Pictures Portrait PDF. Use them to share invaluable insights on Devices Memory Utilization, Interfaces Errors Discards, IP Availability Summary and impress your audience. This template can be altered and modified as per your expectations. So, grab it now.

IT Security Evaluation Scorecard With It Cost Break Down Ppt Infographics Slideshow PDF
This graph or chart is linked to excel, and changes automatically based on data. Just left click on it and select Edit Data. Deliver an awe inspiring pitch with this creative IT Security Evaluation Scorecard With It Cost Break Down Ppt Infographics Slideshow PDF bundle. Topics like Spend Vs Budget, Return On Investment, IT Department Revenue, IT Costs Vs can be discussed with this completely editable template. It is available for immediate download depending on the needs and requirements of the user.
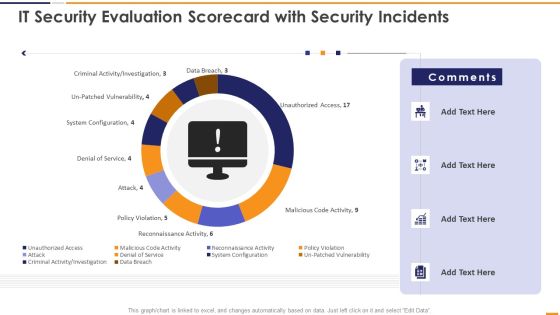
IT Security Evaluation Scorecard With Security Incidents Ppt Pictures Vector PDF
This graph or chart is linked to excel, and changes automatically based on data. Just left click on it and select Edit Data. Deliver and pitch your topic in the best possible manner with this IT Security Evaluation Scorecard With Security Incidents Ppt Pictures Vector PDF. Use them to share invaluable insights on Unauthorized Access Sales, Malicious Code Activity, Reconnaissance Activity Attack and impress your audience. This template can be altered and modified as per your expectations. So, grab it now.

IT Security Evaluation Scorecard With Server Status Ppt Professional Images PDF
This graph or chart is linked to excel, and changes automatically based on data. Just left click on it and select Edit Data. Deliver an awe inspiring pitch with this creative IT Security Evaluation Scorecard With Server Status Ppt Professional Images PDF bundle. Topics like Operations Status Tool, Management Services Managed can be discussed with this completely editable template. It is available for immediate download depending on the needs and requirements of the user.

IT Security Evaluation Scorecard With System Details Ppt Inspiration Vector PDF
This graph or chart is linked to excel, and changes automatically based on data. Just left click on it and select Edit Data. Deliver and pitch your topic in the best possible manner with this IT Security Evaluation Scorecard With System Details Ppt Inspiration Vector PDF. Use them to share invaluable insights on System Details Availability, System Metrics Memory, Pressure Memory Leak and impress your audience. This template can be altered and modified as per your expectations. So, grab it now.
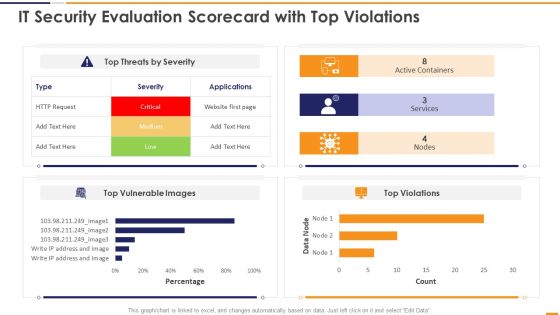
IT Security Evaluation Scorecard With Top Violations Ppt Portfolio Deck PDF
This graph or chart is linked to excel, and changes automatically based on data. Just left click on it and select Edit Data. Deliver an awe inspiring pitch with this creative IT Security Evaluation Scorecard With Top Violations Ppt Portfolio Deck PDF bundle. Topics like Top Threats Severity, Active Containers Services, Top Vulnerable Images can be discussed with this completely editable template. It is available for immediate download depending on the needs and requirements of the user.
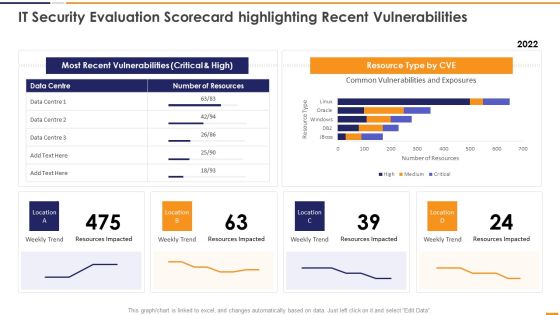
IT Security Evaluation Scorecard Highlighting Recent Vulnerabilities Introduction PDF
This graph or chart is linked to excel, and changes automatically based on data. Just left click on it and select Edit Data. Deliver an awe inspiring pitch with this creative IT Security Evaluation Scorecard Highlighting Recent Vulnerabilities Introduction PDF bundle. Topics like Most Recent Vulnerabilities, Resource Type CVE, Weekly Trend Location can be discussed with this completely editable template. It is available for immediate download depending on the needs and requirements of the user.

IT Security Evaluation Scorecard With Recent Alarms Raised By Devices Guidelines PDF
This graph or chart is linked to excel, and changes automatically based on data. Just left click on it and select Edit Data. Deliver an awe inspiring pitch with this creative IT Security Evaluation Scorecard With Recent Alarms Raised By Devices Guidelines PDF bundle. Topics like Devices CPU Utilization, Device Details Raised can be discussed with this completely editable template. It is available for immediate download depending on the needs and requirements of the user.
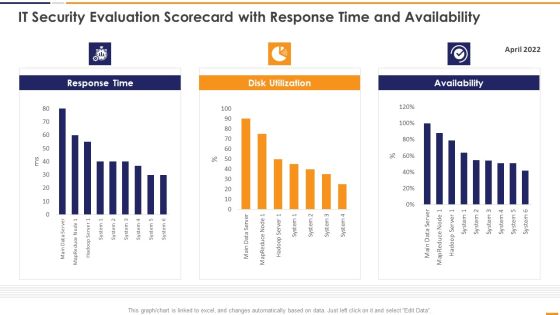
IT Security Evaluation Scorecard With Response Time And Availability Brochure PDF
This graph or chart is linked to excel, and changes automatically based on data. Just left click on it and select Edit Data. Deliver and pitch your topic in the best possible manner with this IT Security Evaluation Scorecard With Response Time And Availability Brochure PDF. Use them to share invaluable insights on Response Time 2022, Disk Utilization Availability and impress your audience. This template can be altered and modified as per your expectations. So, grab it now.

BANT Sales Lead Qualification Model Our Financial Highlights Background PDF
This graph or chart is linked to excel and change automatically based on data. Just left click on it and select Edit Data. Deliver an awe inspiring pitch with this creative BANT Sales Lead Qualification Model Our Financial Highlights Background PDF bundle. Topics like Gross Profit, Net Profit, Earnings Per can be discussed with this completely editable template. It is available for immediate download depending on the needs and requirements of the user.

BANT Sales Lead Qualification Model Our Revenue For The Future Mockup PDF
This graph or chart is linked to excel and change automatically based on data. Just left click on it and select Edit Data. Deliver an awe inspiring pitch with this creative BANT Sales Lead Qualification Model Our Revenue For The Future Mockup PDF bundle. Topics like Continues Decline, Marketing Strategy, 2017 To 2022 can be discussed with this completely editable template. It is available for immediate download depending on the needs and requirements of the user.

Openfin Capital Raising Understanding The Competitive Landscape Ppt Portfolio Layouts PDF
This graph or chart is linked to excel, and changes automatically based on data. Just left click on it and select Edit Data. Deliver and pitch your topic in the best possible manner with this Openfin Capital Raising Understanding The Competitive Landscape Ppt Portfolio Layouts PDF. Use them to share invaluable insights on Usage Application, Food Ordering, Food Blogging and impress your audience. This template can be altered and modified as per your expectations. So, grab it now.

Company Monthly Sales Performance Scorecard With Region Sample PDF
This graph or chart is linked to excel, and changes automatically based on data. Just left click on it and select Edit Data. Deliver and pitch your topic in the best possible manner with this Company Monthly Sales Performance Scorecard With Region Sample PDF. Use them to share invaluable insights on Company Monthly, Sales Performance, Scorecard Region and impress your audience. This template can be altered and modified as per your expectations. So, grab it now.

Company Yearly Sales Performance Scorecard With Cost Breakdown Elements PDF
This graph or chart is linked to excel, and changes automatically based on data. Just left click on it and select Edit Data. Deliver an awe inspiring pitch with this creative Company Yearly Sales Performance Scorecard With Cost Breakdown Elements PDF bundle. Topics like Sales Revenue, Incremental Sales, Cost Breakdown can be discussed with this completely editable template. It is available for immediate download depending on the needs and requirements of the user.

Current Year Sales Performance Scorecard With Profits Structure PDF
This graph or chart is linked to excel, and changes automatically based on data. Just left click on it and select Edit Data. Deliver and pitch your topic in the best possible manner with this Current Year Sales Performance Scorecard With Profits Structure PDF. Use them to share invaluable insights on Current Year, YTD Sales, Previous Year and impress your audience. This template can be altered and modified as per your expectations. So, grab it now.
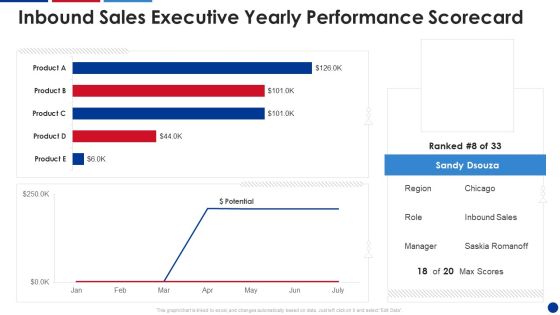
Inbound Sales Executive Yearly Performance Scorecard Information PDF
This graph or chart is linked to excel, and changes automatically based on data. Just left click on it and select Edit Data. Deliver and pitch your topic in the best possible manner with this Inbound Sales Executive Yearly Performance Scorecard Information PDF. Use them to share invaluable insights on Inbound Sales, Executive Yearly, Performance Scorecard and impress your audience. This template can be altered and modified as per your expectations. So, grab it now.
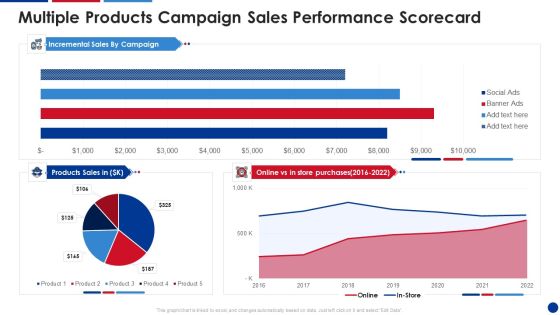
Multiple Products Campaign Sales Performance Scorecard Download PDF
This graph or chart is linked to excel, and changes automatically based on data. Just left click on it and select Edit Data. Deliver an awe inspiring pitch with this creative Multiple Products Campaign Sales Performance Scorecard Download PDF bundle. Topics like Incremental Sales, Products Sales, Store Purchases can be discussed with this completely editable template. It is available for immediate download depending on the needs and requirements of the user.

State And Product Wise Sales Performance Scorecard Summary PDF
This graph or chart is linked to excel, and changes automatically based on data. Just left click on it and select Edit Data. Deliver an awe inspiring pitch with this creative State And Product Wise Sales Performance Scorecard Summary PDF bundle. Topics like State Wise Sales, Products Sale, Region Wise Sales can be discussed with this completely editable template. It is available for immediate download depending on the needs and requirements of the user.

SEO Audit Summary To Increase SEO Audit Report Dashboard With Thematic Score Download PDF
This graph or chart is linked to excel, and changes automatically based on data. Just left click on it and select Edit Data. Deliver an awe inspiring pitch with this creative SEO Audit Summary To Increase SEO Audit Report Dashboard With Thematic Score Download PDF bundle. Topics like Total Score, Crawled Pages, Top Issues can be discussed with this completely editable template. It is available for immediate download depending on the needs and requirements of the user.
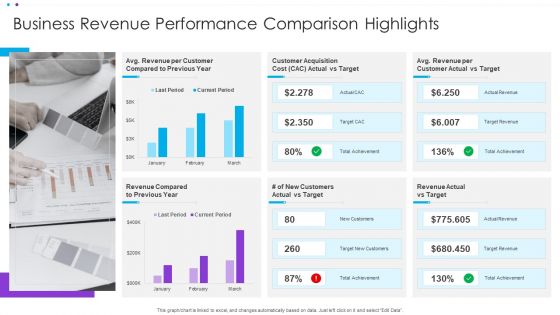
Business Revenue Performance Comparison Highlights Ppt Summary Rules PDF
This graph or chart is linked to excel, and changes automatically based on data. Just left click on it and select Edit Data. Showcasing this set of slides titled Business Revenue Performance Comparison Highlights Ppt Summary Rules PDF. The topics addressed in these templates are Customer Acquisition, Customer Actual, Revenue Compared. All the content presented in this PPT design is completely editable. Download it and make adjustments in color, background, font etc. as per your unique business setting.
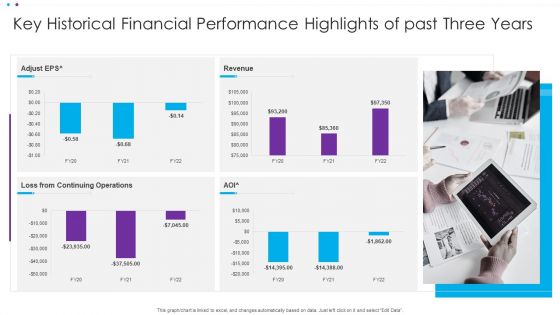
Key Historical Financial Performance Highlights Of Past Three Years Ppt Ideas Background PDF
This graph or chart is linked to excel, and changes automatically based on data. Just left click on it and select Edit Data. Showcasing this set of slides titled Key Historical Financial Performance Highlights Of Past Three Years Ppt Ideas Background PDF. The topics addressed in these templates are Continuing Operations, Adjust EP. All the content presented in this PPT design is completely editable. Download it and make adjustments in color, background, font etc. as per your unique business setting.
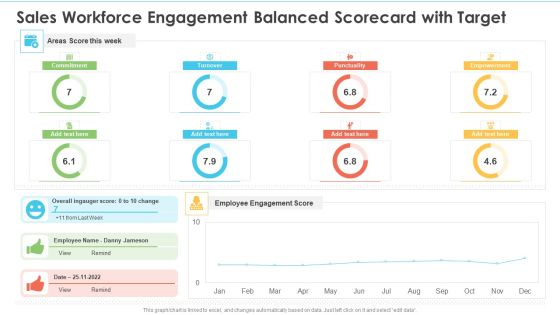
Sales Workforce Engagement Balanced Scorecard With Target Ppt Professional Designs Download PDF
This graph or chart is linked to excel, and changes automatically based on data. Just left click on it and select edit data. Deliver an awe inspiring pitch with this creative Sales Workforce Engagement Balanced Scorecard With Target Ppt Professional Designs Download PDF bundle. Topics like Areas Score Week, Employee Engagement Score, Overall Ingauger Score can be discussed with this completely editable template. It is available for immediate download depending on the needs and requirements of the user.
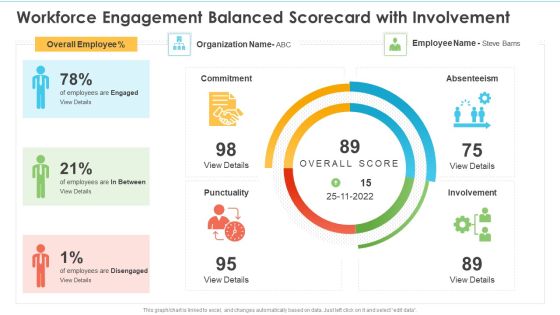
Workforce Engagement Balanced Scorecard With Involvement Ppt Portfolio Background Images PDF
This graph or chart is linked to excel, and changes automatically based on data. Just left click on it and select edit data. Deliver and pitch your topic in the best possible manner with this Workforce Engagement Balanced Scorecard With Involvement Ppt Portfolio Background Images PDF. Use them to share invaluable insights on Employee, Organization, Overall Employee and impress your audience. This template can be altered and modified as per your expectations. So, grab it now.
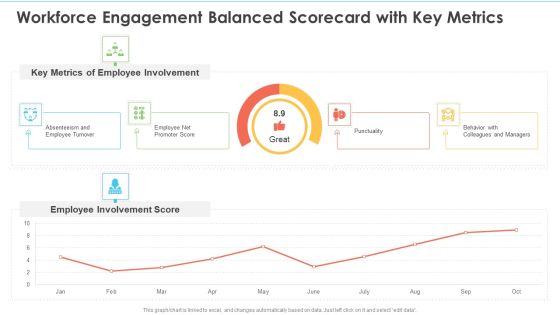
Workforce Engagement Balanced Scorecard With Key Metrics Ppt Inspiration Deck PDF
This graph or chart is linked to excel, and changes automatically based on data. Just left click on it and select edit data. Deliver an awe inspiring pitch with this creative Workforce Engagement Balanced Scorecard With Key Metrics Ppt Inspiration Deck PDF bundle. Topics like Key Metrics, Employee Involvement, Employee Involvement Score can be discussed with this completely editable template. It is available for immediate download depending on the needs and requirements of the user.
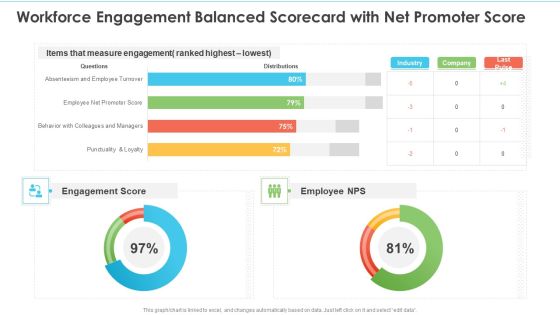
Workforce Engagement Balanced Scorecard With Net Promoter Score Ppt Slides Display PDF
This graph or chart is linked to excel, and changes automatically based on data. Just left click on it and select edit data. Deliver an awe inspiring pitch with this creative Workforce Engagement Balanced Scorecard With Net Promoter Score Ppt Slides Display PDF bundle. Topics like Measure Engagement, Engagement Score, Employee NPS can be discussed with this completely editable template. It is available for immediate download depending on the needs and requirements of the user.

Workforce Engagement Balanced Scorecard With Response Rate Ppt Deck PDF
This graph or chart is linked to excel, and changes automatically based on data. Just left click on it and select edit data. Deliver an awe inspiring pitch with this creative Workforce Engagement Balanced Scorecard With Response Rate Ppt Deck PDF bundle. Topics like Engagement Score Teams, Engagement Score Levels, Net Promoter Score can be discussed with this completely editable template. It is available for immediate download depending on the needs and requirements of the user.

Workforce Engagement Scorecard With Net Promoter Score Ppt Portfolio Images PDF
This graph or chart is linked to excel, and changes automatically based on data. Just left click on it and select edit data. Deliver and pitch your topic in the best possible manner with this Workforce Engagement Scorecard With Net Promoter Score Ppt Portfolio Images PDF. Use them to share invaluable insights on Employee Involvement, Punctuality Involvement, Absenteeism and impress your audience. This template can be altered and modified as per your expectations. So, grab it now.

Workforce Engagement Balanced Scorecard With Loyalty Ppt Styles Good PDF
This graph or chart is linked to excel, and changes automatically based on data. Just left click on it and select edit data. Deliver an awe inspiring pitch with this creative Workforce Engagement Balanced Scorecard With Loyalty Ppt Styles Good PDF bundle. Topics like Involvement Score, Key Metrics, Employee Turnover can be discussed with this completely editable template. It is available for immediate download depending on the needs and requirements of the user.

Quarterly Resource Administration Accounting Scorecard With Average Finished Goods Value Introduction PDF
This graph or chart is linked to excel, and changes automatically based on data. Just left click on it and select Edit Data. Deliver an awe inspiring pitch with this creative Quarterly Resource Administration Accounting Scorecard With Average Finished Goods Value Introduction PDF bundle. Topics like Inventory Turns, Average WIP Value, Total Cost Goods can be discussed with this completely editable template. It is available for immediate download depending on the needs and requirements of the user.

Resource Administration Accounting Scorecard With Average Purchase Cost Structure PDF
This graph or chart is linked to excel, and changes automatically based on data. Just left click on it and select Edit Data. Deliver and pitch your topic in the best possible manner with this Resource Administration Accounting Scorecard With Average Purchase Cost Structure PDF. Use them to share invaluable insights on Stock Balance, Stock Quantity, Average Cost and impress your audience. This template can be altered and modified as per your expectations. So, grab it now.

Resource Administration Accounting Scorecard With Cost Of Purchase Order Download PDF
This graph or chart is linked to excel, and changes automatically based on data. Just left click on it and select Edit Data. Deliver an awe inspiring pitch with this creative Resource Administration Accounting Scorecard With Cost Of Purchase Order Download PDF bundle. Topics like Cost Reduction, Cost Avoidance, Procurement ROI can be discussed with this completely editable template. It is available for immediate download depending on the needs and requirements of the user.
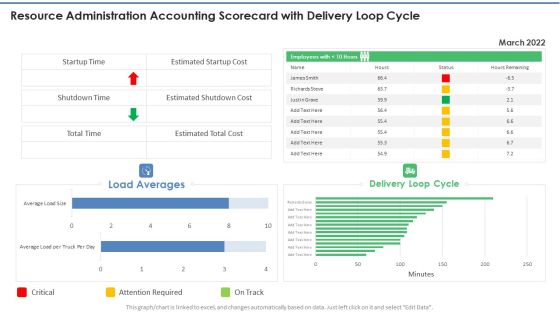
Resource Administration Accounting Scorecard With Delivery Loop Cycle Graphics PDF
This graph or chart is linked to excel, and changes automatically based on data. Just left click on it and select Edit Data. Deliver an awe inspiring pitch with this creative Resource Administration Accounting Scorecard With Delivery Loop Cycle Graphics PDF bundle. Topics like Load Averages, Delivery Loop Cycle, Attention Required can be discussed with this completely editable template. It is available for immediate download depending on the needs and requirements of the user.

Resource Administration Accounting Scorecard With Inventory Summary Designs PDF
This graph or chart is linked to excel, and changes automatically based on data. Just left click on it and select Edit Data. Deliver and pitch your topic in the best possible manner with this Resource Administration Accounting Scorecard With Inventory Summary Designs PDF. Use them to share invaluable insights on Product Details, Top Selling Item, Purchase Order and impress your audience. This template can be altered and modified as per your expectations. So, grab it now.

Resource Administration Accounting Scorecard With Inventory Turnover Microsoft PDF
This graph or chart is linked to excel, and changes automatically based on data. Just left click on it and select Edit Data. Deliver an awe inspiring pitch with this creative Resource Administration Accounting Scorecard With Inventory Turnover Microsoft PDF bundle. Topics like Inventory Turnover, Inventory Accuracy, Back Order Rate can be discussed with this completely editable template. It is available for immediate download depending on the needs and requirements of the user.
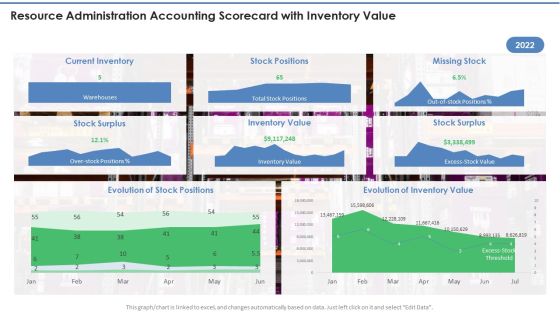
Resource Administration Accounting Scorecard With Inventory Value Infographics PDF
This graph or chart is linked to excel, and changes automatically based on data. Just left click on it and select Edit Data. Deliver and pitch your topic in the best possible manner with this Resource Administration Accounting Scorecard With Inventory Value Infographics PDF. Use them to share invaluable insights on Current Inventory, Stock Positions, Missing Stock and impress your audience. This template can be altered and modified as per your expectations. So, grab it now.
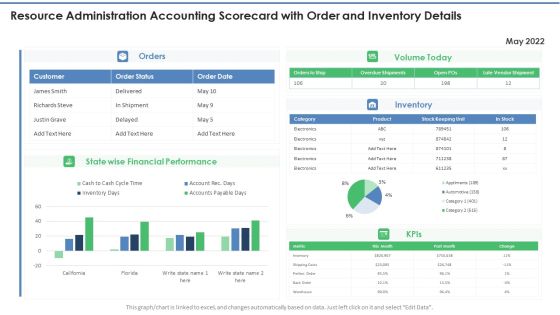
Resource Administration Accounting Scorecard With Order And Inventory Details Mockup PDF
This graph or chart is linked to excel, and changes automatically based on data. Just left click on it and select Edit Data. Deliver and pitch your topic in the best possible manner with this Resource Administration Accounting Scorecard With Order And Inventory Details Mockup PDF. Use them to share invaluable insights on Volume Today, Financial Performance, State wise and impress your audience. This template can be altered and modified as per your expectations. So, grab it now.
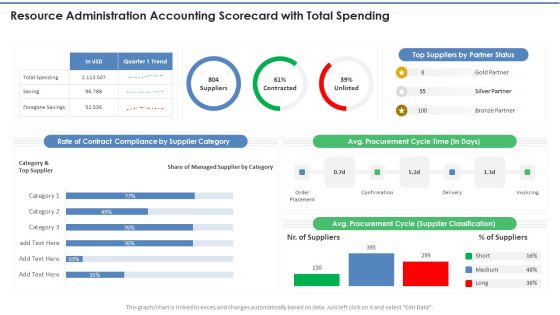
Resource Administration Accounting Scorecard With Total Spending Professional PDF
This graph or chart is linked to excel, and changes automatically based on data. Just left click on it and select Edit Data. Deliver and pitch your topic in the best possible manner with this Resource Administration Accounting Scorecard With Total Spending Professional PDF. Use them to share invaluable insights on Supplier Category, Cycle Time, Top Suppliers and impress your audience. This template can be altered and modified as per your expectations. So, grab it now.

Yearly Resource Administration Accounting Scorecard With Carrying Cost Of Inventory Slides PDF
This graph or chart is linked to excel, and changes automatically based on data. Just left click on it and select Edit Data. Deliver an awe inspiring pitch with this creative Yearly Resource Administration Accounting Scorecard With Carrying Cost Of Inventory Slides PDF bundle. Topics like Carrying Cost Inventory, Inventory Shrinkage can be discussed with this completely editable template. It is available for immediate download depending on the needs and requirements of the user.

Call Center Client Helpline Dashboard Status Ppt Show Graphics Design PDF
This graph or chart is linked to excel, and changes automatically based on data. Just left click on it and select Edit Data. Showcasing this set of slides titled Call Center Client Helpline Dashboard Status Ppt Show Graphics Design PDF. The topics addressed in these templates are Call Monitor, Active Calls, Abandoned, Agents Ready. All the content presented in this PPT design is completely editable. Download it and make adjustments in color, background, font etc. as per your unique business setting.

Client Helpline Dashboard Average Time To Solve Issue Ppt Portfolio Visuals PDF
This graph or chart is linked to excel, and changes automatically based on data. Just left click on it and select Edit Data. Showcasing this set of slides titled Client Helpline Dashboard Average Time To Solve Issue Ppt Portfolio Visuals PDF. The topics addressed in these templates are Cost Per Support, Customer Satisfaction, Costs To Revenue. All the content presented in this PPT design is completely editable. Download it and make adjustments in color, background, font etc. as per your unique business setting.

Client Helpline Dashboard With Average Talk Time Distribution Ppt Gallery Backgrounds PDF
This graph or chart is linked to excel, and changes automatically based on data. Just left click on it and select Edit Data. Showcasing this set of slides titled Client Helpline Dashboard With Average Talk Time Distribution Ppt Gallery Backgrounds PDF. The topics addressed in these templates are External Incoming Call, Occupancy, Break Time, Sales. All the content presented in this PPT design is completely editable. Download it and make adjustments in color, background, font etc. as per your unique business setting.

Client Helpline Dashboard With Resolution And Response Rate Ppt File Example Topics PDF
This graph or chart is linked to excel, and changes automatically based on data. Just left click on it and select Edit Data. Showcasing this set of slides titled Client Helpline Dashboard With Resolution And Response Rate Ppt File Example Topics PDF. The topics addressed in these templates are Resolutions, Response Time, Response Time Weekday. All the content presented in this PPT design is completely editable. Download it and make adjustments in color, background, font etc. as per your unique business setting.

Client Helpline Dashboard With Support Status Ppt Portfolio Rules PDF
This graph or chart is linked to excel, and changes automatically based on data. Just left click on it and select Edit Data. Showcasing this set of slides titled Client Helpline Dashboard With Support Status Ppt Portfolio Rules PDF. The topics addressed in these templates are Total Number, Support Requests, Total Resolved, Support Status. All the content presented in this PPT design is completely editable. Download it and make adjustments in color, background, font etc. as per your unique business setting.

Playbook For Sales Growth Strategies Digital Marketing Dashboard For Organic Growth Designs PDF
This graph or chart is linked to excel, and changes automatically based on data. Just left click on it and select Edit Data. Deliver and pitch your topic in the best possible manner with this Playbook For Sales Growth Strategies Digital Marketing Dashboard For Organic Growth Designs PDF. Use them to share invaluable insights on Unique Visitors, Sessions, Bounce Rate and impress your audience. This template can be altered and modified as per your expectations. So, grab it now.

Organization Transition Cloud Computing Service Usage Ppt PowerPoint Presentation File Outfit PDF
This graph or chart is linked to excel, and changes automatically based on data. Just left click on it and select Edit Data. Deliver an awe inspiring pitch with this creative Organization Transition Cloud Computing Service Usage Ppt PowerPoint Presentation File Outfit PDF bundle. Topics like Cloud Storage, Cloud Backup, Cloud Hosting can be discussed with this completely editable template. It is available for immediate download depending on the needs and requirements of the user.

Help Desk Call Centre Service Level Agreement KPI Dashboard Pictures PDF
This graph or chart is linked to excel, and changes automatically based on data. Just left click on it and select Edit Data. Showcasing this set of slides titled Help Desk Call Centre Service Level Agreement KPI Dashboard Pictures PDF. The topics addressed in these templates are Call Type Today, Occupancy Today, Call Summary Today. All the content presented in this PPT design is completely editable. Download it and make adjustments in color, background, font etc. as per your unique business setting.
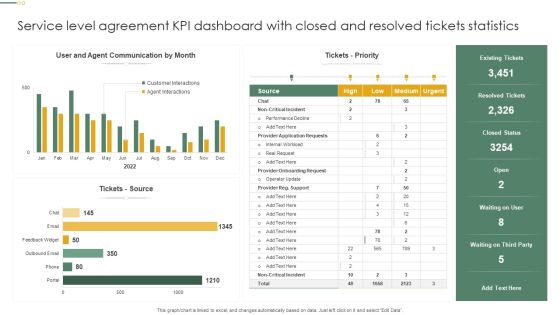
Service Level Agreement KPI Dashboard With Closed And Resolved Tickets Statistics Inspiration PDF
This graph or chart is linked to excel, and changes automatically based on data. Just left click on it and select Edit Data. Showcasing this set of slides titled Service Level Agreement KPI Dashboard With Closed And Resolved Tickets Statistics Inspiration PDF. The topics addressed in these templates are Tickets Priority, Tickets Source, Resolved Tickets. All the content presented in this PPT design is completely editable. Download it and make adjustments in color, background, font etc. as per your unique business setting.
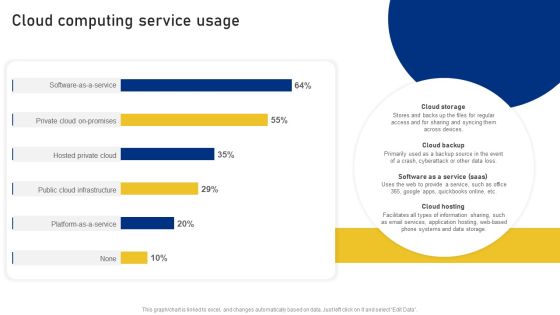
Reshaping Business In Digital Cloud Computing Service Usage Formats PDF
This graph or chart is linked to excel, and changes automatically based on data. Just left click on it and select Edit Data. Deliver an awe inspiring pitch with this creative Reshaping Business In Digital Cloud Computing Service Usage Formats PDF bundle. Topics like Private Cloud Promises, Hosted Private Cloud, Public Cloud Infrastructure can be discussed with this completely editable template. It is available for immediate download depending on the needs and requirements of the user.
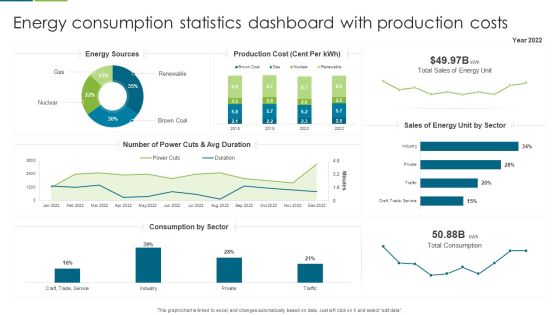
Energy Consumption Statistics Dashboard With Production Costs Slides PDF
This graph or chart is linked to excel, and changes automatically based on data. Just left click on it and select edit data. Showcasing this set of slides titled Energy Consumption Statistics Dashboard With Production Costs Slides PDF. The topics addressed in these templates are Production Cost, Sales Energy, Number Power. All the content presented in this PPT design is completely editable. Download it and make adjustments in color, background, font etc. as per your unique business setting.

Energy Consumption Statistics Dashboard With Yearly Savings Guidelines PDF
This graph or chart is linked to excel, and changes automatically based on data. Just left click on it and select edit data. Showcasing this set of slides titled Energy Consumption Statistics Dashboard With Yearly Savings Guidelines PDF. The topics addressed in these templates are Production Consumption, Energy Savings, Performance Ratio. All the content presented in this PPT design is completely editable. Download it and make adjustments in color, background, font etc. as per your unique business setting.

5 Year Gender Based Group Demographics Of Organization Background PDF
This graph or chart is linked to excel, and changes automatically based on data. Just left click on it and select Edit Data. Showcasing this set of slides titled 5 Year Gender Based Group Demographics Of Organization Background PDF. The topics addressed in these templates are Total Employees, Male, Female. All the content presented in this PPT design is completely editable. Download it and make adjustments in color, background, font etc. as per your unique business setting.

Business Hiring Group Diversity Demographics Dashboard Guidelines PDF
This graph or chart is linked to excel, and changes automatically based on data. Just left click on it and select Edit Data. Showcasing this set of slides titled Business Hiring Group Diversity Demographics Dashboard Guidelines PDF. The topics addressed in these templates are Hiring Trends, Current Period, Previous Period. All the content presented in this PPT design is completely editable. Download it and make adjustments in color, background, font etc. as per your unique business setting.

Group Diversity Demographics Based On Salary Range Portrait PDF
This graph or chart is linked to excel, and changes automatically based on data. Just left click on it and select Edit Data. Showcasing this set of slides titled Group Diversity Demographics Based On Salary Range Portrait PDF. The topics addressed in these templates are Salary Breakdown Team, Number Employees, Per Team. All the content presented in this PPT design is completely editable. Download it and make adjustments in color, background, font etc. as per your unique business setting.

Multiple Organizational Group Demographics Based On Gender Download PDF
This graph or chart is linked to excel, and changes automatically based on data. Just left click on it and select Edit Data. Showcasing this set of slides titled Multiple Organizational Group Demographics Based On Gender Download PDF. The topics addressed in these templates are Total Employees, Team, Female. All the content presented in this PPT design is completely editable. Download it and make adjustments in color, background, font etc. as per your unique business setting.

Helpdesk SLA KPL Dashboard Illustrating Calls Details Ppt Slides Show PDF
This graph or chart is linked to excel, and changes automatically based on data. Just left click on it and select Edit Data. Showcasing this set of slides titled Helpdesk SLA KPL Dashboard Illustrating Calls Details Ppt Slides Show PDF. The topics addressed in these templates are Call Type Today, Trunk Utilization Today, Call Summery Today. All the content presented in this PPT design is completely editable. Download it and make adjustments in color, background, font etc. as per your unique business setting.

SLA KPL Dashboard Indicating Top Week Performers Ppt Infographics Examples PDF
This graph or chart is linked to excel, and changes automatically based on data. Just left click on it and select Edit Data. Showcasing this set of slides titled SLA KPL Dashboard Indicating Top Week Performers Ppt Infographics Examples PDF. The topics addressed in these templates are Active Slas Risk, Active Slas Breached, Active Slas. All the content presented in this PPT design is completely editable. Download it and make adjustments in color, background, font etc. as per your unique business setting.

Kanban Structure For Monitor Weekly Issues Resolving Progress Ppt Professional Outline PDF
This graph or chart is linked to excel, and changes automatically based on data. Just left click on it and select Edit Data. Showcasing this set of slides titled Kanban Structure For Monitor Weekly Issues Resolving Progress Ppt Professional Outline PDF. The topics addressed in these templates are Issues Resolved, Progress To Resolved, Issues To Resolved. All the content presented in this PPT design is completely editable. Download it and make adjustments in color, background, font etc. as per your unique business setting.

Kanban Structure For Task Management Ppt Summary Information PDF
This graph or chart is linked to excel, and changes automatically based on data. Just left click on it and select Edit Data. Showcasing this set of slides titled Kanban Structure For Task Management Ppt Summary Information PDF. The topics addressed in these templates are Backlog, In Progress, New Epic Added. All the content presented in this PPT design is completely editable. Download it and make adjustments in color, background, font etc. as per your unique business setting.
Kanban Structure For Yearly Project Progress Tracking Ppt File Example Introduction PDF
This graph or chart is linked to excel, and changes automatically based on data. Just left click on it and select Edit Data. Showcasing this set of slides titled Kanban Structure For Yearly Project Progress Tracking Ppt File Example Introduction PDF. The topics addressed in these templates are Number Projects, Backlog Approved, Final Review. All the content presented in this PPT design is completely editable. Download it and make adjustments in color, background, font etc. as per your unique business setting.

Human Capital Metrics For Proper Management Ppt Show Inspiration PDF
This graph or chart is linked to excel, and changes automatically based on data. Just left click on it and select Edit Data. Showcasing this set of slides titled Human Capital Metrics For Proper Management Ppt Show Inspiration PDF. The topics addressed in these templates are Candidates Per Position, Hired Per Source, Location. All the content presented in this PPT design is completely editable. Download it and make adjustments in color, background, font etc. as per your unique business setting.
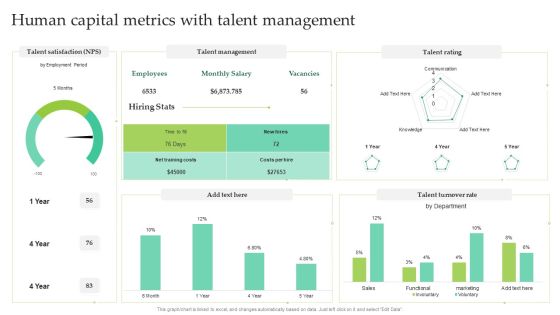
Human Capital Metrics With Talent Management Ppt Layouts Mockup PDF
This graph or chart is linked to excel, and changes automatically based on data. Just left click on it and select Edit Data. Showcasing this set of slides titled Human Capital Metrics With Talent Management Ppt Layouts Mockup PDF. The topics addressed in these templates are Talent Management, Talent Rating, Talent Turnover Rate. All the content presented in this PPT design is completely editable. Download it and make adjustments in color, background, font etc. as per your unique business setting.

Dashboard Depicting Security Problem Management Metrics Ppt Gallery Designs PDF
This graph or chart is linked to excel, and changes automatically based on data. Just left click on it and select Edit Data. Showcasing this set of slides titled Dashboard Depicting Security Problem Management Metrics Ppt Gallery Designs PDF. The topics addressed in these templates are Percentage, New Critical, Security Incidents. All the content presented in this PPT design is completely editable. Download it and make adjustments in color, background, font etc. as per your unique business setting.
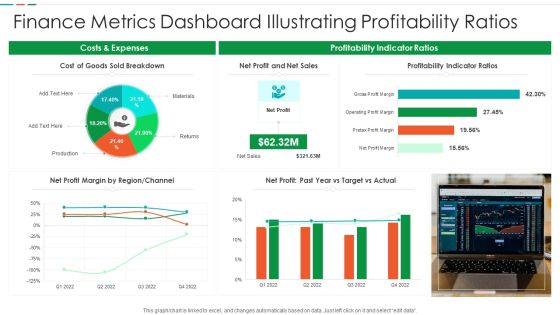
Finance Metrics Dashboard Illustrating Profitability Ratios Diagrams PDF
This graph or chart is linked to excel, and changes automatically based on data. Just left click on it and select edit data. Pitch your topic with ease and precision using this Finance Metrics Dashboard Illustrating Profitability Ratios Diagrams PDF. This layout presents information on Cost Goods Sold, Net Profit Net, Sales Profitability Indicator. It is also available for immediate download and adjustment. So, changes can be made in the color, design, graphics or any other component to create a unique layout.
Cash Performance Highlights With Turnover Rate Ppt Ideas Icon PDF
This graph or chart is linked to excel, and changes automatically based on data. Just left click on it and select Edit Data. Pitch your topic with ease and precision using this Cash Performance Highlights With Turnover Rate Ppt Ideas Icon PDF. This layout presents information on Working Capital, Cash Balance, Current Ratio. It is also available for immediate download and adjustment. So, changes can be made in the color, design, graphics or any other component to create a unique layout.
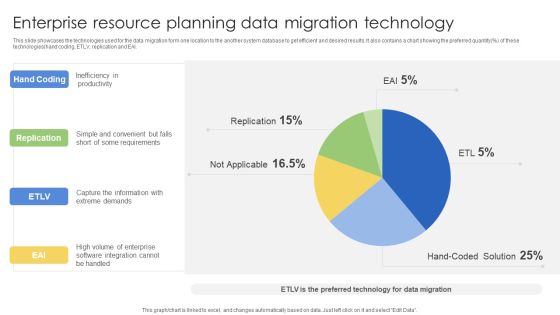
Enterprise Resource Planning Data Migration Technology Ppt Pictures Layout PDF
This slide showcases the technologies used for the data migration form one location to the another system database to get efficient and desired results. It also contains a chart showing the preferred quantity percent of these technologies hand coding, ETLV, replication and EAI. Showcasing this set of slides titled Enterprise Resource Planning Data Migration Technology Ppt Pictures Layout PDF. The topics addressed in these templates are Hand Coding, Replication, ETLV, EAI. All the content presented in this PPT design is completely editable. Download it and make adjustments in color, background, font etc. as per your unique business setting.
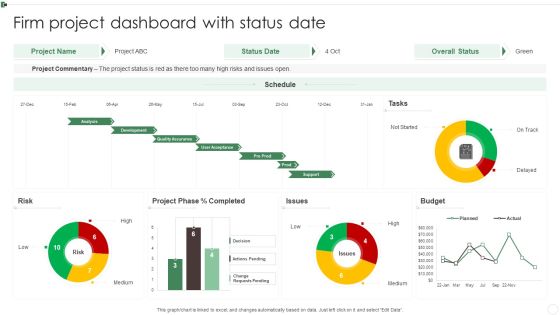
Firm Project Dashboard With Status Date Ppt Infographics Slides PDF
This graph or chart is linked to excel, and changes automatically based on data. Just left click on it and select Edit Data. Pitch your topic with ease and precision using this Firm Project Dashboard With Status Date Ppt Infographics Slides PDF. This layout presents information on Project Commentary, Budget, Project Phase, Risk. It is also available for immediate download and adjustment. So, changes can be made in the color, design, graphics or any other component to create a unique layout.
Impact Of Artificial Intelligence In Business Deploying Artificial Intelligence In Business Icons PDF
This pie chart focuses on the impact of AI after being implemented in the business such as rising revenues, better customer experience, improved decision making, etc.Deliver and pitch your topic in the best possible manner with this Impact Of Artificial Intelligence In Business Deploying Artificial Intelligence In Business Icons PDF. Use them to share invaluable insights on Improves Customer, Experience Support, Technologies Makes and impress your audience. This template can be altered and modified as per your expectations. So, grab it now.

Finance Metrics Dashboard Indicating Portfolio Performance Microsoft PDF
This graph or chart is linked to excel, and changes automatically based on data. Just left click on it and select edit data. Pitch your topic with ease and precision using this Finance Metrics Dashboard Indicating Portfolio Performance Microsoft PDF. This layout presents information on Portfolio Performance Portfolio, Asset Management Manager, Top 10 Assets. It is also available for immediate download and adjustment. So, changes can be made in the color, design, graphics or any other component to create a unique layout.

Finance Metrics Dashboard Indicating Short Term Assets Download PDF
This graph or chart is linked to excel, and changes automatically based on data. Just left click on it and select edit data. Pitch your topic with ease and precision using this Finance Metrics Dashboard Indicating Short Term Assets Download PDF. This layout presents information on Short Term Assets, Global Financial Performance, Revenue YTD 2022. It is also available for immediate download and adjustment. So, changes can be made in the color, design, graphics or any other component to create a unique layout.

Financial Performance Highlights With Net Profit Margin Ppt Model Ideas PDF
This graph or chart is linked to excel, and changes automatically based on data. Just left click on it and select Edit Data. Pitch your topic with ease and precision using this Financial Performance Highlights With Net Profit Margin Ppt Model Ideas PDF. This layout presents information on Net Profit, Accounts Receivable, Accounts Payable. It is also available for immediate download and adjustment. So, changes can be made in the color, design, graphics or any other component to create a unique layout.

Weekly Sales Performance Highlights With Product Share Ppt File Information PDF
This graph or chart is linked to excel, and changes automatically based on data. Just left click on it and select Edit Data. Pitch your topic with ease and precision using this Weekly Sales Performance Highlights With Product Share Ppt File Information PDF. This layout presents information on Dashboard Summary, Weekly Sale, Product Share. It is also available for immediate download and adjustment. So, changes can be made in the color, design, graphics or any other component to create a unique layout.

Client Helpline Dashboard Performance Key Metrics Ppt Outline Deck PDF
This graph or chart is linked to excel, and changes automatically based on data. Just left click on it and select Edit Data. Pitch your topic with ease and precision using this Client Helpline Dashboard Performance Key Metrics Ppt Outline Deck PDF. This layout presents information on Key Metrics, Trend, Compare. It is also available for immediate download and adjustment. So, changes can be made in the color, design, graphics or any other component to create a unique layout.

Client Helpline Dashboard With Ticket Resolution Ppt Model Graphics Design PDF
This graph or chart is linked to excel, and changes automatically based on data. Just left click on it and select Edit Data. Pitch your topic with ease and precision using this Client Helpline Dashboard With Ticket Resolution Ppt Model Graphics Design PDF. This layout presents information on Ticket Due Times, Sourcewise Tickets, Open Tickets. It is also available for immediate download and adjustment. So, changes can be made in the color, design, graphics or any other component to create a unique layout.
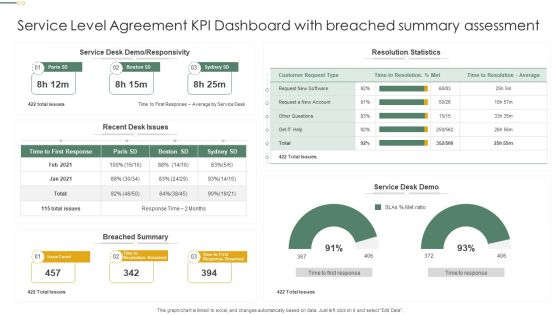
Service Level Agreement KPI Dashboard With Breached Summary Assessment Professional PDF
This graph or chart is linked to excel, and changes automatically based on data. Just left click on it and select Edit Data. Pitch your topic with ease and precision using this Service Level Agreement KPI Dashboard With Breached Summary Assessment Professional PDF. This layout presents information on Resolution Statistics, Service Desk Demo, Breached Summary. It is also available for immediate download and adjustment. So, changes can be made in the color, design, graphics or any other component to create a unique layout.
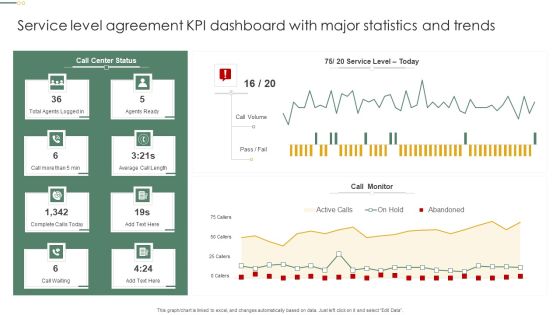
Service Level Agreement KPI Dashboard With Major Statistics And Trends Pictures PDF
This graph or chart is linked to excel, and changes automatically based on data. Just left click on it and select Edit Data. Pitch your topic with ease and precision using this Service Level Agreement KPI Dashboard With Major Statistics And Trends Pictures PDF. This layout presents information on Call Monitor, Call Volume, Agents Ready. It is also available for immediate download and adjustment. So, changes can be made in the color, design, graphics or any other component to create a unique layout.
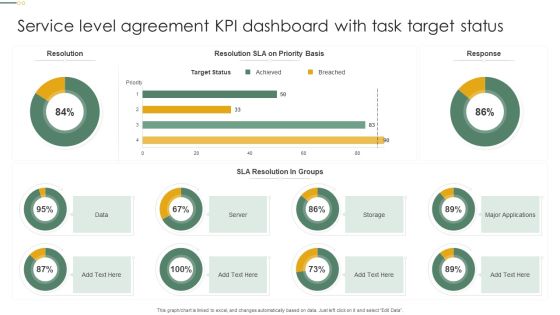
Service Level Agreement KPI Dashboard With Task Target Status Microsoft PDF
This graph or chart is linked to excel, and changes automatically based on data. Just left click on it and select Edit Data. Pitch your topic with ease and precision using this Service Level Agreement KPI Dashboard With Task Target Status Microsoft PDF. This layout presents information on Target Status, Sla Resolution, Groups, Server. It is also available for immediate download and adjustment. So, changes can be made in the color, design, graphics or any other component to create a unique layout.

Company Group Members Demographics Dashboard Overview Clipart PDF
This graph or chart is linked to excel, and changes automatically based on data. Just left click on it and select Edit Data. Pitch your topic with ease and precision using this Company Group Members Demographics Dashboard Overview Clipart PDF. This layout presents information on Headcount Office, Headcount Tenure Range, Headcount Age Range. It is also available for immediate download and adjustment. So, changes can be made in the color, design, graphics or any other component to create a unique layout.

Service SLA KPL Changes And Incidents Dashboard Ppt Inspiration Infographics PDF
This graph or chart is linked to excel, and changes automatically based on data. Just left click on it and select Edit Data. Pitch your topic with ease and precision using this Service SLA KPL Changes And Incidents Dashboard Ppt Inspiration Infographics PDF. This layout presents information on Time Spent Department, Incidents Closed, Operator Group. It is also available for immediate download and adjustment. So, changes can be made in the color, design, graphics or any other component to create a unique layout.

SLA KPL Overview Dashboard Depicting Service Targets Ppt Slides Maker PDF
This graph or chart is linked to excel, and changes automatically based on data. Just left click on it and select Edit Data. Pitch your topic with ease and precision using this SLA KPL Overview Dashboard Depicting Service Targets Ppt Slides Maker PDF. This layout presents information on Monthly Trend, Service Target, Quarterly Trend. It is also available for immediate download and adjustment. So, changes can be made in the color, design, graphics or any other component to create a unique layout.

Doughnut Graph Depicting ROI From Multiple Marketing Activities Rules PDF
This graph or chart is linked to excel, and changes automatically based on data. Just left click on it and select Edit Data. Pitch your topic with ease and precision using this Doughnut Graph Depicting ROI From Multiple Marketing Activities Rules PDF. This layout presents information on Total ROI, Field Campaigns, Print Media, Display Ads. It is also available for immediate download and adjustment. So, changes can be made in the color, design, graphics or any other component to create a unique layout.

Doughnut Graph With Online Employee Recruitment Via Multiple Portals Mockup PDF
This graph or chart is linked to excel, and changes automatically based on data. Just left click on it and select Edit Data. Pitch your topic with ease and precision using this Doughnut Graph With Online Employee Recruitment Via Multiple Portals Mockup PDF. This layout presents information on ABC Employment, Multiple Portals, 2020 To 2022. It is also available for immediate download and adjustment. So, changes can be made in the color, design, graphics or any other component to create a unique layout.
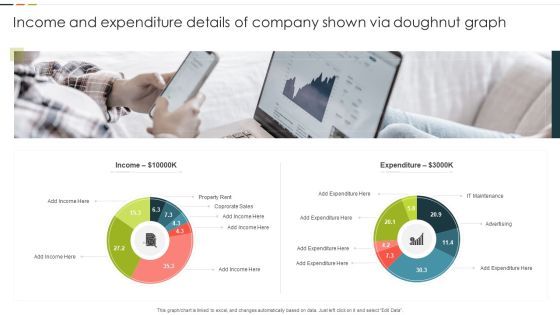
Income And Expenditure Details Of Company Shown Via Doughnut Graph Graphics PDF
This graph or chart is linked to excel, and changes automatically based on data. Just left click on it and select Edit Data. Pitch your topic with ease and precision using this Income And Expenditure Details Of Company Shown Via Doughnut Graph Graphics PDF. This layout presents information on Property Rent, Corporate Sales, Expenditure. It is also available for immediate download and adjustment. So, changes can be made in the color, design, graphics or any other component to create a unique layout.

Kanban Structure For Product Quality Assurance Ppt Portfolio Deck PDF
This graph or chart is linked to excel, and changes automatically based on data. Just left click on it and select Edit Data. Pitch your topic with ease and precision using this Kanban Structure For Product Quality Assurance Ppt Portfolio Deck PDF. This layout presents information on Product Deployment, Quality Assurance, Product, Designing And Development. It is also available for immediate download and adjustment. So, changes can be made in the color, design, graphics or any other component to create a unique layout.

Kanban Structure To Manage Weekly Work Activities Ppt Professional Aids PDF
This graph or chart is linked to excel, and changes automatically based on data. Just left click on it and select Edit Data. Pitch your topic with ease and precision using this Kanban Structure To Manage Weekly Work Activities Ppt Professional Aids PDF. This layout presents information on Legend, Ready To Start, In Progress. It is also available for immediate download and adjustment. So, changes can be made in the color, design, graphics or any other component to create a unique layout.

Human Capital Metrics For New Hire Ppt Pictures Brochure PDF
This graph or chart is linked to excel, and changes automatically based on data. Just left click on it and select Edit Data. Pitch your topic with ease and precision using this Human Capital Metrics For New Hire Ppt Pictures Brochure PDF. This layout presents information on Active Employee Count, New Hire Count, New Hire. It is also available for immediate download and adjustment. So, changes can be made in the color, design, graphics or any other component to create a unique layout.
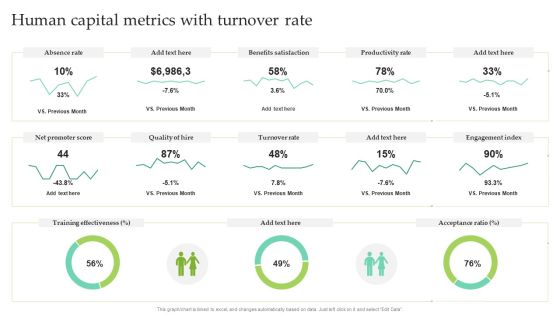
Human Capital Metrics With Turnover Rate Ppt Pictures Outline PDF
This graph or chart is linked to excel, and changes automatically based on data. Just left click on it and select Edit Data. Pitch your topic with ease and precision using this Human Capital Metrics With Turnover Rate Ppt Pictures Outline PDF. This layout presents information on Absence Rate, Benefits Satisfaction, Productivity Rate. It is also available for immediate download and adjustment. So, changes can be made in the color, design, graphics or any other component to create a unique layout.

Average Reduction In Injuries After Health And Safety Performance Measurements Check Template PDF
This slide covers the 7 year chart that is showing the number of injuries reduced during the timeframe by taking some measures or training employees on the usage of equipment they are using. Showcasing this set of slides titled Average Reduction In Injuries After Health And Safety Performance Measurements Check Template PDF The topics addressed in these templates are Employees Safety Measures, Workstation Ergonomics, Workplace Paying Attention All the content presented in this PPT design is completely editable. Download it and make adjustments in color, background, font etc. as per your unique business setting.
Expenses And Income Comparison Graph With Budget Summary Ppt PowerPoint Presentation Icon Inspiration PDF
This slide illustrates budget summary of expenditure of a company. it includes income and expenditure comparative data and expenditure chart etc.Pitch your topic with ease and precision using this Expenses And Income Comparison Graph With Budget Summary Ppt PowerPoint Presentation Icon Inspiration PDF. This layout presents information on Budget Summary, Expenditure Comparative, Actual Income. It is also available for immediate download and adjustment. So, changes can be made in the color, design, graphics or any other component to create a unique layout.

Implementation Of Digital Advancement Techniques Efficiency Gains Using Drones Pictures PDF
The following slide showcases graphical chart representing efficiency of using drone technology in insurance sector as compared to traditional methods for on site inspections. It highlights comparison of time taken in manual process and with drone. Want to ace your presentation in front of a live audience Our Implementation Of Digital Advancement Techniques Efficiency Gains Using Drones Pictures PDF can help you do that by engaging all the users towards you. Slidegeeks experts have put their efforts and expertise into creating these impeccable powerpoint presentations so that you can communicate your ideas clearly. Moreover, all the templates are customizable, and easy to edit and downloadable. Use these for both personal and commercial use.

Circular Bar Graph Business Success PowerPoint Templates And PowerPoint Themes 1012
Circular Bar Graph Business Success PowerPoint Templates And PowerPoint Themes 1012-The above template displays a diagram of blue circular progress bars. This image represent the concept of business growth and success. This template imitates economy, finance, global, goal, growth, ideas, information, management, profit and statistics. This image has been conceived to enable you to emphatically communicate your ideas in your Business and Marketing PPT presentations. Use this template for financial analysis, business reviews and statistics. Go ahead and add charm to your presentations with our high quality template.-Circular Bar Graph Business Success PowerPoint Templates And PowerPoint Themes 1012-This PowerPoint template can be used for presentations relating to-Circular success graph, marketing, business, finance, success, circle charts
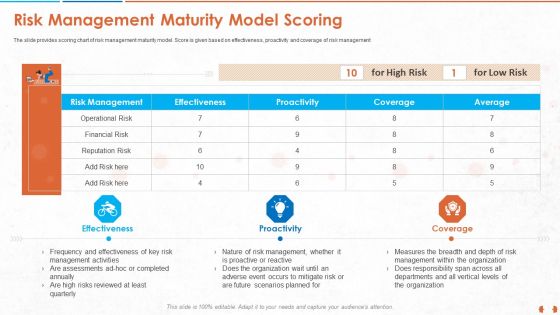
Risk Management Maturity Model Scoring Ideas PDF
The slide provides scoring chart of risk management maturity model. Score is given based on effectiveness, proactivity and coverage of risk management.Deliver an awe-inspiring pitch with this creative risk management maturity model scoring ideas pdf. bundle. Topics like effectiveness, proactivity, coverage can be discussed with this completely editable template. It is available for immediate download depending on the needs and requirements of the user.

Business Framework Marketing Mix Example PowerPoint Presentation
Four staged process flow chart with target selection techniques has been used to design this business framework PPT. This PPT contains the concept of marketing target selection and achievement process. Add this PPT in your presentation and good comments from viewers.

Data Mining Report With Age And Occupation Details Background PDF
The following slide highlights the data profiling report with age and occupation illustrating data table and pie chart for age band, occupational type, and marital status Showcasing this set of slides titled data mining report with age and occupation details background pdf . The topics addressed in these templates are data mining report with age and occupation details . All the content presented in this PPT design is completely editable. Download it and make adjustments in color, background, font etc. as per your unique business setting.

Product And Services Promotion Marketing Performance Dashboard With Advertisement Graphics PDF
This graph or chart is linked to excel, and changes automatically based on data. Just left click on it and select Edit Data. Slidegeeks is here to make your presentations a breeze with Product And Services Promotion Marketing Performance Dashboard With Advertisement Graphics PDF With our easy-to-use and customizable templates, you can focus on delivering your ideas rather than worrying about formatting. With a variety of designs to choose from, youre sure to find one that suits your needs. And with animations and unique photos, illustrations, and fonts, you can make your presentation pop. So whether youre giving a sales pitch or presenting to the board, make sure to check out Slidegeeks first.
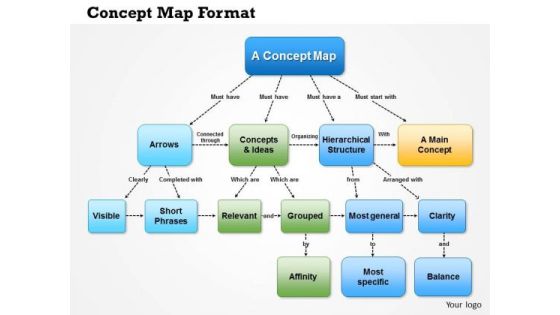
Business Framework Concept Map Format PowerPoint Presentation
This business framework displays concept map. This image slide has been crafted to depict concept mapping in flow chart with boxes. Use this image slide, in your presentations to express views on marketing, technology and business. This image slide will help you make outstanding presentations.

Business Framework Concept Map PowerPoint Presentation
This business framework displays concept map. This image slide has been crafted to depict concept mapping in flow chart with cloud boxes. Use this image slide, in your presentations to express views on marketing, technology and business. This image slide will help you make outstanding presentations.

Business Framework Concept Mapping Template PowerPoint Presentation
This business framework displays concept map. This image slide has been crafted to depict concept mapping in flow chart with editable boxes. Use this image slide, in your presentations to express views on marketing, technology and business. This image slide will help you make outstanding presentations.
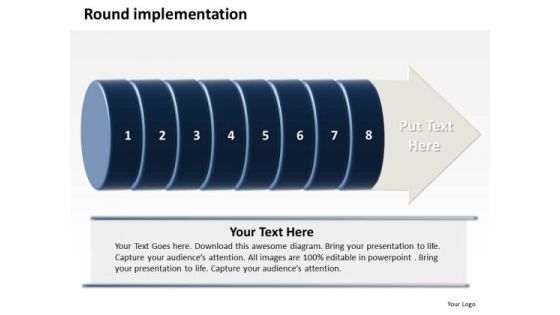
Ppt Round Images 2007 Implementation Of 8 Steps Involved Procedure PowerPoint Templates
PPT round images 2007 implementation of 8 steps involved procedure PowerPoint Templates-This PowerPoint Diagram shows the Round Implementation of steps which are involved in manufacturing Process. It includes eight Steps. You can change color, size and orientation of any icon to your liking.-PPT round images 2007 implementation of 8 steps involved procedure PowerPoint Templates-Analysis, Art, Blank, Blue, Business, Categories, Chart, Chief, Circle, Clip, Clipart, Corporate, Design, Diagram, Directors, Element, Executive, Financial, Graph, Graphic, Green, Heading, Icon, Illustration, Implementation, Isolated, Managers, Media, Network, Officer, Perspective, Pie, President, Red, Relations, Role, Round, Sales, Segments, Set, Six, Staff, Strategic, Title, Vector, Vice, Wheel
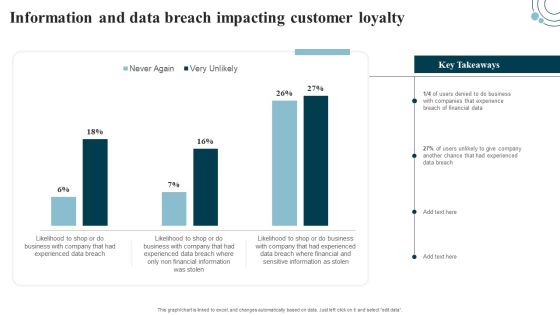
Developing IT Security Strategy Information And Data Breach Impacting Customer Loyalty Template PDF
This graph or chart is linked to excel, and changes automatically based on data. Just left click on it and select edit data. Get a simple yet stunning designed Developing IT Security Strategy Information And Data Breach Impacting Customer Loyalty Template PDF. It is the best one to establish the tone in your meetings. It is an excellent way to make your presentations highly effective. So, download this PPT today from Slidegeeks and see the positive impacts. Our easy-to-edit Developing IT Security Strategy Information And Data Breach Impacting Customer Loyalty Template PDF can be your go-to option for all upcoming conferences and meetings. So, what are you waiting for Grab this template today.
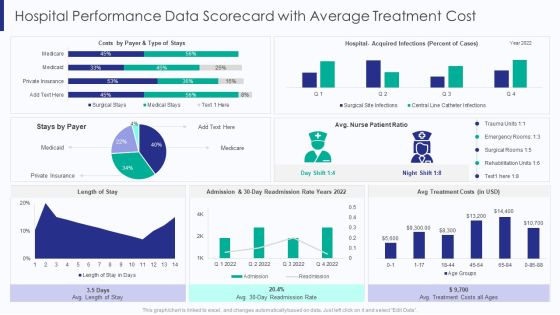
Healthcare Hospital Performance Data Scorecard With Average Treatment Cost Ppt Ideas Guide PDF
This graph or chart is linked to excel, and changes automatically based on data. Just left click on it and select Edit Data. Deliver and pitch your topic in the best possible manner with this Healthcare Hospital Performance Data Scorecard With Average Treatment Cost Ppt Ideas Guide PDF. Use them to share invaluable insights on Type Of Stays, Stays By Payer, Avg Treatment Costs, 30 Day Readmission and impress your audience. This template can be altered and modified as per your expectations. So, grab it now.
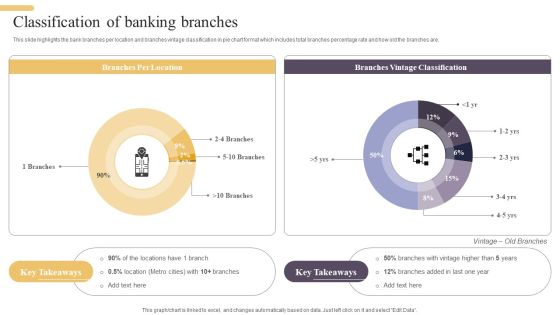
Improving Digital Banking Operations And Services Framework Classification Of Banking Branches Brochure PDF
This slide highlights the bank branches per location and branches vintage classification in pie chart format which includes total branches percentage rate and how old the branches are. Take your projects to the next level with our ultimate collection of Improving Digital Banking Operations And Services Framework Classification Of Banking Branches Brochure PDF. Slidegeeks has designed a range of layouts that are perfect for representing task or activity duration, keeping track of all your deadlines at a glance. Tailor these designs to your exact needs and give them a truly corporate look with your own brand colors they will make your projects stand out from the rest.

Business Framework Strategy Planning Model PowerPoint Presentation
This business framework power point diagram template has been designed for strategy planning process flow representations. This diagram has been designed with text boxes and flow chart graphic in a vertical sequence. Display sequential process flow for any business and management related presentations.

Engaging Employees Strategic Selecting Best Method To Collect Employee Feedback Formats PDF
This slide showcases why surveys are the best method to collect employee feedback. It includes elements such as pie chart showing best method used by companies to collect employee feedback and why surveys are best.Boost your pitch with our creative Engaging Employees Strategic Selecting Best Method To Collect Employee Feedback Formats PDF. Deliver an awe-inspiring pitch that will mesmerize everyone. Using these presentation templates you will surely catch everyones attention. You can browse the ppts collection on our website. We have researchers who are experts at creating the right content for the templates. So you dont have to invest time in any additional work. Just grab the template now and use them.
Comprehensive Guide For Launch Survey Results To Identify Most Effective Marketing Tool Icons PDF
This graph or chart is linked to excel, and changes automatically based on data. Just left click on it and select Edit Data. Slidegeeks is here to make your presentations a breeze with Comprehensive Guide For Launch Survey Results To Identify Most Effective Marketing Tool Icons PDF With our easy-to-use and customizable templates, you can focus on delivering your ideas rather than worrying about formatting. With a variety of designs to choose from, youre sure to find one that suits your needs. And with animations and unique photos, illustrations, and fonts, you can make your presentation pop. So whether youre giving a sales pitch or presenting to the board, make sure to check out Slidegeeks first.

Product Marketing And Awareness Programs Major Goals Of Social Media Marketing Mockup PDF
This graph or chart is linked to excel, and changes automatically based on data. Just left click on it and select Edit Data. Find a pre-designed and impeccable Product Marketing And Awareness Programs Major Goals Of Social Media Marketing Mockup PDF. The templates can ace your presentation without additional effort. You can download these easy-to-edit presentation templates to make your presentation stand out from others. So, what are you waiting for Download the template from Slidegeeks today and give a unique touch to your presentation.
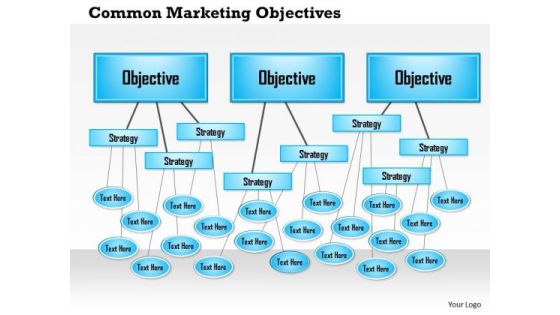
Business Framework Common Marketing Objectives PowerPoint Presentation
This image slide displays common marketing objectives business framework. This image slide has been beautifully designed with graphic of flow chart with objectives Use this image slide, in your presentations to express views on marketing strategic planning objectives. This image slide will help you create professional presentations.
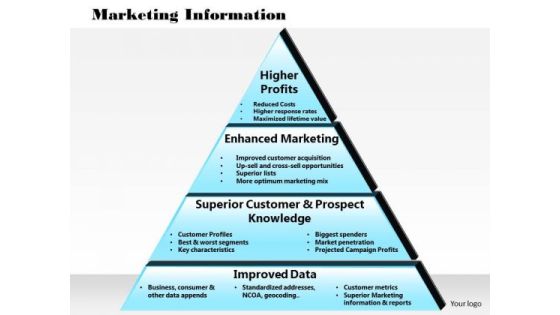
Business Framework Marketing Information PowerPoint Presentation 1
Graphic of two level flow chart has been used in this business framework power point template. This PPT contains the concept of marketing information with step by step process. This PPT is suitable for marketing related presentations. Give detailed information about the topic in graphical manner with our professional PPT.
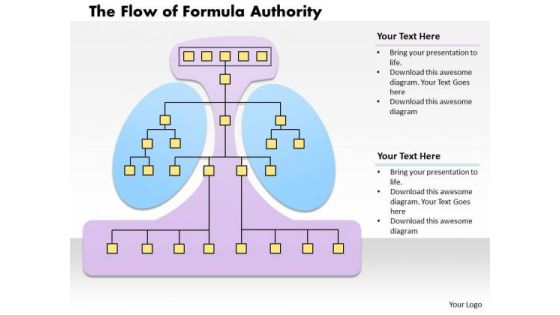
Business Framework Formula Authority PowerPoint Presentation
This image slide has been designed to display the follow of formula authority diagram. This image has been designed with graphic of text boxes in flow chart with innovative background. Use this image slide, in your presentation to depict management levels in business. This image slide will help you express your views to target audience.
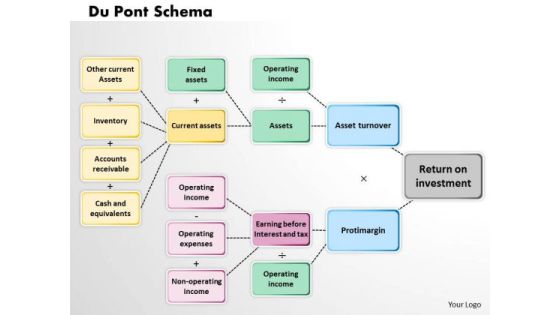
Business Framework Du Pont Schema PowerPoint Presentation
This beautiful image slide has been designed to display DuPont schema flow chart process in your presentations. This image slide may be used in business and marketing presentations. You may change color, size and orientation of any icon to your liking. Create professional presentations using this image slide.
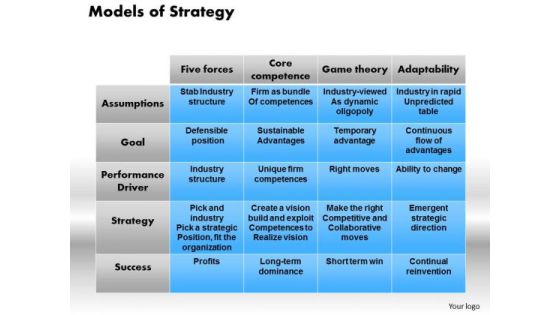
Business Framework Models Of Strategy PowerPoint Presentation
This power point template has been crafted with model of strategy. This PPT contains two variable text box organization chart which can be used for various business strategies. Add this PPT in your business presentations and create an impact on viewers.

Business Framework Motivation Theories PowerPoint Presentation
Define the importance of motivation in organization and business with this exclusive Motivational Theories PPT. This template contains the two way flow chart to explain process of motivation. Add this template in you presentation and get excellent way to motivate your viewers.
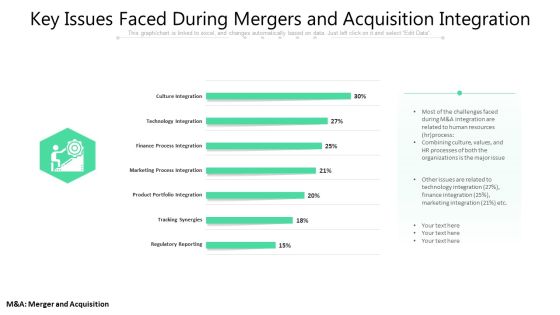
Key Issues Faced During Mergers And Acquisition Integration Ppt PowerPoint Presentation Summary Graphics PDF
This graph or chart is linked to excel, and changes automatically based on data. Just left click on it and select Edit Data. Showcasing this set of slides titled key issues faced during mergers and acquisition integration ppt powerpoint presentation summary graphics pdf. The topics addressed in these templates are culture integration, technology integration, finance process integration, marketing process integration, product portfolio integration, tracking synergies, regulatory reporting. All the content presented in this PPT design is completely editable. Download it and make adjustments in color, background, font etc. as per your unique business setting.

Construction Management Dashboard With Project Phases And Performance Inspiration PDF
This graph for chart is linked to excel, and changes automatically based on data. Just left click on it and select Edit Data. Deliver and pitch your topic in the best possible manner with this Construction Management Dashboard With Project Phases And Performance Inspiration PDF. Use them to share invaluable insights on Project Cost Performance, Actual Cost, Project Performance, Timeline VS Resource Capacity, Time vs Project Phase and impress your audience. This template can be altered and modified as per your expectations. So, grab it now.
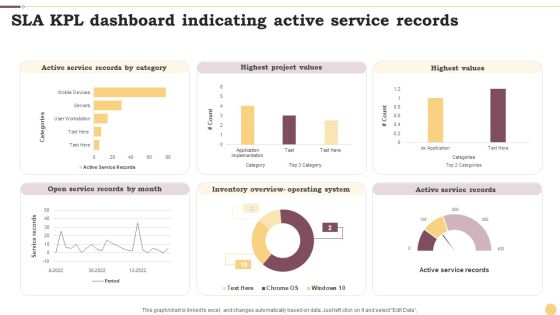
SLA KPL Dashboard Indicating Active Service Records Ppt Professional Graphics Example PDF
This graph or chart is linked to excel, and changes automatically based on data. Just left click on it and select Edit Data. Pitch your topic with ease and precision using this SLA KPL Dashboard Indicating Active Service Records Ppt Professional Graphics Example PDF. This layout presents information on Active Service Records, Highest Project Values, Highest Values. It is also available for immediate download and adjustment. So, changes can be made in the color, design, graphics or any other component to create a unique layout.
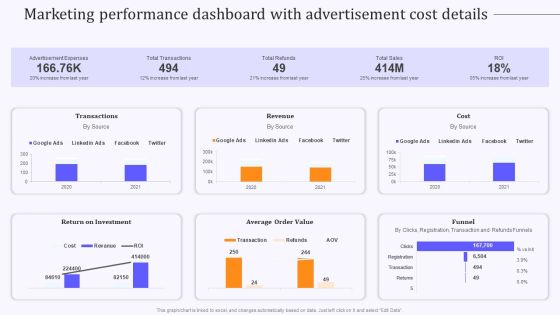
Product Marketing And Awareness Programs Marketing Performance Dashboard Information PDF
This graph or chart is linked to excel, and changes automatically based on data. Just left click on it and select Edit Data. Slidegeeks is one of the best resources for PowerPoint templates. You can download easily and regulate Product Marketing And Awareness Programs Marketing Performance Dashboard Information PDF for your personal presentations from our wonderful collection. A few clicks is all it takes to discover and get the most relevant and appropriate templates. Use our Templates to add a unique zing and appeal to your presentation and meetings. All the slides are easy to edit and you can use them even for advertisement purposes.
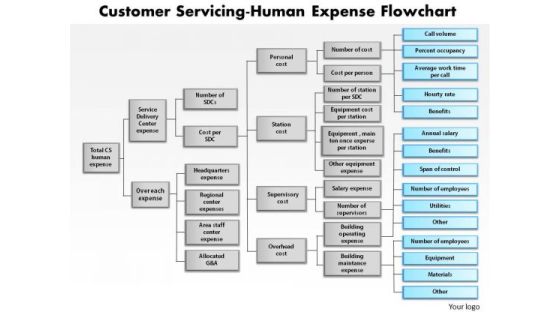
Business Framework Customer Servicing Human Expense Flowchart PowerPoint Presentation
This image slide has been designed with flow chart to depict customer servicing-human expense. This image slide may be used in your presentations to display business marketing. You may change color size and orientation of any icon to your liking. This image slide will impart professional appearance to your presentations.

Firm KPI Dashboard With Schedule Performance Index Ppt Visual Aids PDF
This graph or chart is linked to excel, and changes automatically based on data. Just left click on it and select Edit Data. Pitch your topic with ease and precision using this Firm KPI Dashboard With Schedule Performance Index Ppt Visual Aids PDF. This layout presents information on Project Cost Performance, Project Planning Stage, Monitor And Control. It is also available for immediate download and adjustment. So, changes can be made in the color, design, graphics or any other component to create a unique layout.

Brand Awareness Plan Product Marketing Dashboard For Pay Per Click Campaign Template PDF
This graph or chart is linked to excel, and changes automatically based on data. Just left click on it and select Edit Data. Get a simple yet stunning designed Brand Awareness Plan Product Marketing Dashboard For Pay Per Click Campaign Template PDF. It is the best one to establish the tone in your meetings. It is an excellent way to make your presentations highly effective. So, download this PPT today from Slidegeeks and see the positive impacts. Our easy-to-edit Brand Awareness Plan Product Marketing Dashboard For Pay Per Click Campaign Template PDF can be your go-to option for all upcoming conferences and meetings. So, what are you waiting for Grab this template today.
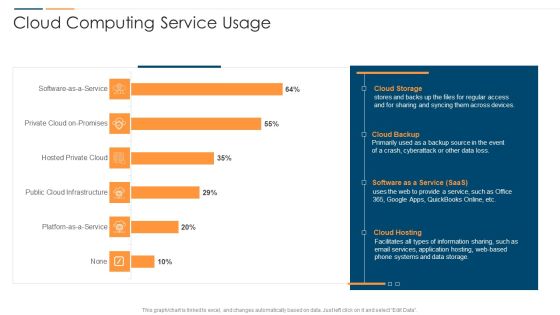
Revolution In Online Business Cloud Computing Service Usage Ppt PowerPoint Presentation File Themes PDF
This graph or chart is linked to excel, and changes automatically based on data. Just left click on it and select Edit Data. Deliver and pitch your topic in the best possible manner with this Revolution In Online Business Cloud Computing Service Usage Ppt PowerPoint Presentation File Themes PDF. Use them to share invaluable insights on Cloud Storage System, Cloud Backup Saas, Cloud Hosting Storage and impress your audience. This template can be altered and modified as per your expectations. So, grab it now.

Comprehensive Guide For Launch Sales By Lead Source Performance Indicator Inspiration PDF
This graph or chart is linked to excel, and changes automatically based on data. Just left click on it and select Edit Data. The Comprehensive Guide For Launch Sales By Lead Source Performance Indicator Inspiration PDF is a compilation of the most recent design trends as a series of slides. It is suitable for any subject or industry presentation, containing attractive visuals and photo spots for businesses to clearly express their messages. This template contains a variety of slides for the user to input data, such as structures to contrast two elements, bullet points, and slides for written information. Slidegeeks is prepared to create an impression.

Brand Awareness Plan Dashboard Showing Digital Marketing Performance Sample PDF
This graph or chart is linked to excel, and changes automatically based on data. Just left click on it and select Edit Data. The best PPT templates are a great way to save time, energy, and resources. Slidegeeks have 100 percent editable powerpoint slides making them incredibly versatile. With these quality presentation templates, you can create a captivating and memorable presentation by combining visually appealing slides and effectively communicating your message. Download Brand Awareness Plan Dashboard Showing Digital Marketing Performance Sample PDF from Slidegeeks and deliver a wonderful presentation.

Service Level Agreement KPI Dashboard Indicating Violation Count And Overdue Requests Diagrams PDF
This graph or chart is linked to excel, and changes automatically based on data. Just left click on it and select Edit Data. Showcasing this set of slides titled Service Level Agreement KPI Dashboard Indicating Violation Count And Overdue Requests Diagrams PDF. The topics addressed in these templates are Total Requests Category, Total Requests Status, Urgent Requests. All the content presented in this PPT design is completely editable. Download it and make adjustments in color, background, font etc. as per your unique business setting.

Customer Relationship Management Dashboard CRM Application Dashboard Quarter Icons PDF
This graph or chart is linked to excel, and changes automatically based on data. Just left click on it and select Edit Data.Deliver and pitch your topic in the best possible manner with this customer relationship management dashboard crm application dashboard quarter icons pdf. Use them to share invaluable insights on marketing funnel all time, opportunity generation by quarter, active prospects, new prospects, new opportunities and impress your audience. This template can be altered and modified as per your expectations. So, grab it now.
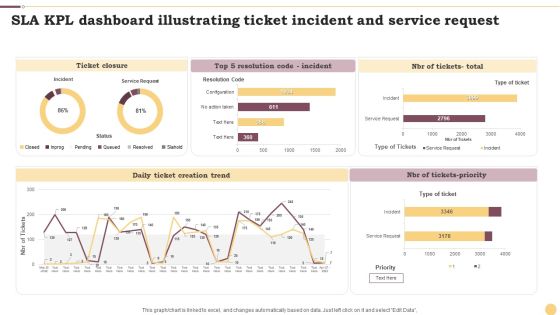
SLA KPL Dashboard Illustrating Ticket Incident And Service Request Ppt File Portrait PDF
This graph or chart is linked to excel, and changes automatically based on data. Just left click on it and select Edit Data. Showcasing this set of slides titled SLA KPL Dashboard Illustrating Ticket Incident And Service Request Ppt File Portrait PDF. The topics addressed in these templates are Ticket Closure, Daily Ticket, Creation Trend, NBR Tickets Priority. All the content presented in this PPT design is completely editable. Download it and make adjustments in color, background, font etc. as per your unique business setting.
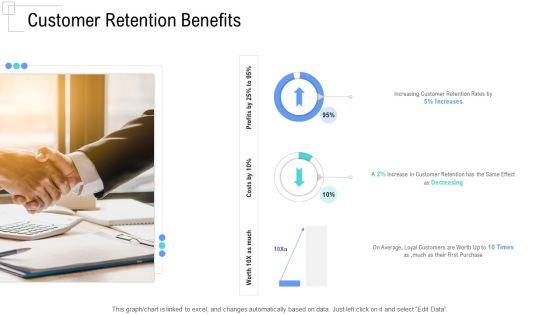
Managing Customer Experience Customer Retention Benefits Template PDF
This graph or chart is linked to excel, and changes automatically based on data. Just left click on it and select Edit Data.Deliver and pitch your topic in the best possible manner with this managing customer experience customer retention benefits template pdf. Use them to share invaluable insights on increasing customer retention rates by, average, loyal customers are worth up to 10 times as much as their first purchase, worth 10x as much and impress your audience. This template can be altered and modified as per your expectations. So, grab it now.
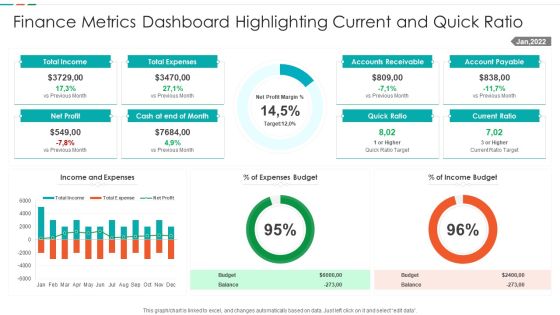
Finance Metrics Dashboard Highlighting Current And Quick Ratio Template PDF
This graph or chart is linked to excel, and changes automatically based on data. Just left click on it and select edit data. Showcasing this set of slides titled Finance Metrics Dashboard Highlighting Current And Quick Ratio Template PDF. The topics addressed in these templates are Total Income Budget, Total Expenses Balance, Net Profit Quick, Ratio Current Ratio. All the content presented in this PPT design is completely editable. Download it and make adjustments in color, background, font etc. as per your unique business setting.

Finance Metrics Dashboard Illustrating Income And Cash Flow Template PDF
This graph or chart is linked to excel, and changes automatically based on data. Just left click on it and select edit data. Pitch your topic with ease and precision using this Finance Metrics Dashboard Illustrating Income And Cash Flow Template PDF. This layout presents information on Current Accounts Receivable, Current Account Payable, Cash End Period, Account Receivable Account. It is also available for immediate download and adjustment. So, changes can be made in the color, design, graphics or any other component to create a unique layout.

Talent Acquisition And Recruitment Methods Used By Hiring Department Ppt PowerPoint Presentation Layouts Templates PDF
This graph or chart is linked to excel, and changes automatically based on data. Just left click on it and select Edit Data. Showcasing this set of slides titled talent acquisition and recruitment methods used by hiring department ppt powerpoint presentation layouts templates pdf. The topics addressed in these templates are other methods, paid software, job fairs, employee referrals, jobs boards, social networks. All the content presented in this PPT design is completely editable. Download it and make adjustments in color, background, font etc. as per your unique business setting.

Shipment Supplier Scorecard With Total Spend And Ontime Delivery Ppt Slides Templates PDF
This graph or chart is linked to excel, and changes automatically based on data. Just left click on it and select Edit Data. Deliver and pitch your topic in the best possible manner with this Shipment Supplier Scorecard With Total Spend And Ontime Delivery Ppt Slides Templates PDF. Use them to share invaluable insights on Shipping Vendor Avg, Time Delivery Goal, Spend Over Time, OTD Delivery Percent and impress your audience. This template can be altered and modified as per your expectations. So, grab it now.
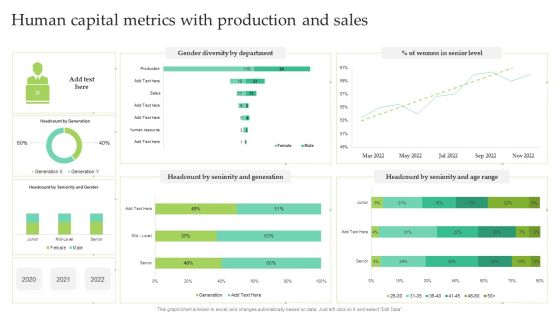
Human Capital Metrics With Production And Sales Ppt Infographic Template Summary PDF
This graph or chart is linked to excel, and changes automatically based on data. Just left click on it and select Edit Data. Showcasing this set of slides titled Human Capital Metrics With Production And Sales Ppt Infographic Template Summary PDF. The topics addressed in these templates are Women Senior Level, Gender Diversity Department, Seniority And Generation. All the content presented in this PPT design is completely editable. Download it and make adjustments in color, background, font etc. as per your unique business setting.

Quarterly Declining Graph Of A Manufacturing Plant Ppt PowerPoint Presentation File Example Topics PDF
This chart shows how the production of the manufacturing plan is declining in every quarter because of some critical reasons and how it is effecting the companys growth and goodwill. Showcasing this set of slides titled Quarterly Declining Graph Of A Manufacturing Plant Ppt PowerPoint Presentation File Example Topics PDF. The topics addressed in these templates are Production Declined, Lack Of Technology, Unskilled Laborers. All the content presented in this PPT design is completely editable. Download it and make adjustments in color, background, font etc. as per your unique business setting.

Utilisation Of Funds Organic Food Startup Business Pitch Deck Download PDF
Purpose of this slide is to provide information to the investors on how much money you have raised and spent. Here the pie chart indicates that company invested in marketing, technology and operations. Deliver an awe inspiring pitch with this creative Utilisation Of Funds Organic Food Startup Business Pitch Deck Download PDF bundle. Topics like Marketing And Promotion, Funds Towards Marketing, Towards Technological Expansion can be discussed with this completely editable template. It is available for immediate download depending on the needs and requirements of the user.
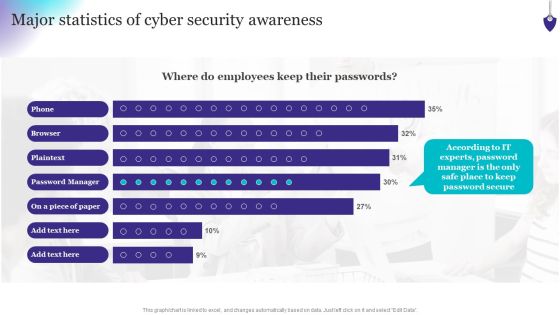
Organizing Security Awareness Major Statistics Of Cyber Security Awareness Formats PDF
This graph or chart is linked to excel, and changes automatically based on data. Just left click on it and select Edit Data. Welcome to our selection of the Organizing Security Awareness Major Statistics Of Cyber Security Awareness Formats PDF. These are designed to help you showcase your creativity and bring your sphere to life. Planning and Innovation are essential for any business that is just starting out. This collection contains the designs that you need for your everyday presentations. All of our PowerPoints are 100 percent editable, so you can customize them to suit your needs. This multi-purpose template can be used in various situations. Grab these presentation templates today.

Improving Corporate Performance Sales Opportunity Monitoring Dashboard Portrait PDF
This graph or chart is linked to excel, and changes automatically based on data. Just left click on it and select Edit Data. Welcome to our selection of the Improving Corporate Performance Sales Opportunity Monitoring Dashboard Portrait PDF. These are designed to help you showcase your creativity and bring your sphere to life. Planning and Innovation are essential for any business that is just starting out. This collection contains the designs that you need for your everyday presentations. All of our PowerPoints are 100 percent editable, so you can customize them to suit your needs. This multi-purpose template can be used in various situations. Grab these presentation templates today.
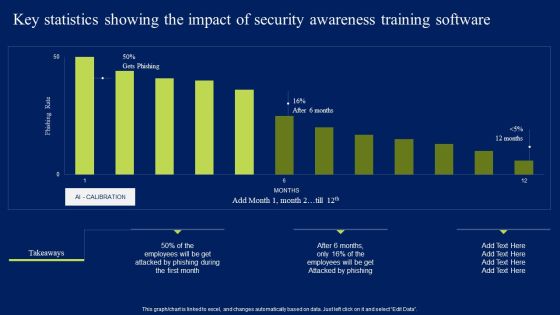
Key Statistics Showing The Impact Of Security Awareness Training Software Elements PDF
This graph or chart is linked to excel, and changes automatically based on data. Just left click on it and select Edit Data. Slidegeeks is one of the best resources for PowerPoint templates. You can download easily and regulate Key Statistics Showing The Impact Of Security Awareness Training Software Elements PDF for your personal presentations from our wonderful collection. A few clicks is all it takes to discover and get the most relevant and appropriate templates. Use our Templates to add a unique zing and appeal to your presentation and meetings. All the slides are easy to edit and you can use them even for advertisement purposes.

Product And Services Promotion Major Goals Of Social Media Marketing Slides PDF
This graph or chart is linked to excel, and changes automatically based on data. Just left click on it and select Edit Data. From laying roadmaps to briefing everything in detail, our templates are perfect for you. You can set the stage with your presentation slides. All you have to do is download these easy-to-edit and customizable templates. Product And Services Promotion Major Goals Of Social Media Marketing Slides PDF will help you deliver an outstanding performance that everyone would remember and praise you for. Do download this presentation today.

Product Marketing For Generating Product Marketing Dashboard With Sales Trend Designs PDF
This graph or chart is linked to excel, and changes automatically based on data. Just left click on it and select Edit Data. From laying roadmaps to briefing everything in detail, our templates are perfect for you. You can set the stage with your presentation slides. All you have to do is download these easy-to-edit and customizable templates. Product Marketing For Generating Product Marketing Dashboard With Sales Trend Designs PDF will help you deliver an outstanding performance that everyone would remember and praise you for. Do download this presentation today.

Implementing Digital Marketing Leading Social Media Platforms Used By Retailers In 2022 Structure PDF
This graph or chart is linked to excel, and changes automatically based on data. Just left click on it and select Edit Data. From laying roadmaps to briefing everything in detail, our templates are perfect for you. You can set the stage with your presentation slides. All you have to do is download these easy-to-edit and customizable templates. Implementing Digital Marketing Leading Social Media Platforms Used By Retailers In 2022 Structure PDF will help you deliver an outstanding performance that everyone would remember and praise you for. Do download this presentation today.

Customer Relationship Management Dashboard Customer Retention Benefits Inspiration PDF
This graph or chart is linked to excel, and changes automatically based on data. Just left click on it and select Edit Data.Deliver an awe inspiring pitch with this creative customer relationship management dashboard customer retention benefits inspiration pdf bundle. Topics like increasing customer retention rates, on average, loyal customers are worth up to 10 times as ,much as their first purchase, profits by 25percent to 95percent can be discussed with this completely editable template. It is available for immediate download depending on the needs and requirements of the user.

Managing Customer Experience CRM Application Dashboard Month Mockup PDF
This graph or chart is linked to excel, and changes automatically based on data. Just left click on it and select Edit Data.Deliver an awe-inspiring pitch with this creative managing customer experience crm application dashboard month mockup pdf bundle. Topics like show me the deals by each stage, what is the revenue this month, get me the number of leads created this month by source can be discussed with this completely editable template. It is available for immediate download depending on the needs and requirements of the user.
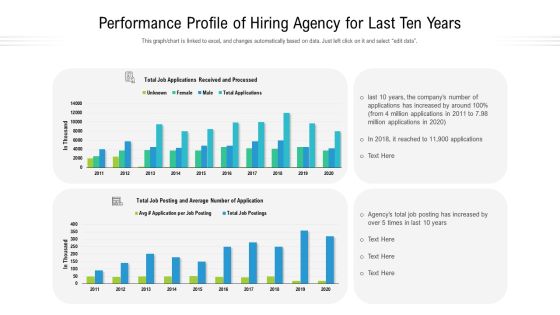
Performance Profile Of Hiring Agency For Last Ten Years Ppt Show Styles PDF
This graph to chart is linked to excel, and changes automatically based on data. Just left click on it and select edit data. Showcasing this set of slides titled performance profile of hiring agency for last ten years ppt show styles pdf. The topics addressed in these templates are performance profile of hiring agency for last ten years. All the content presented in this PPT design is completely editable. Download it and make adjustments in color, background, font etc. as per your unique business setting.
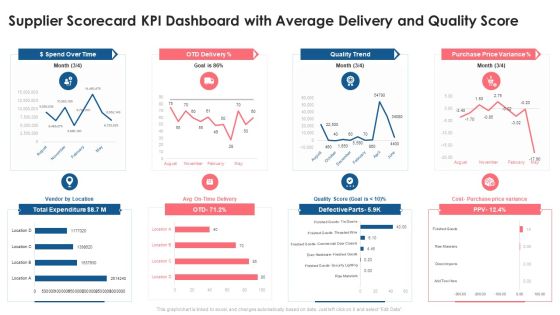
Supplier Scorecard Supplier Scorecard KPI Dashboard With Average Delivery And Quality Score Introduction PDF
This graph or chart is linked to excel, and changes automatically based on data. Just left click on it and select Edit Data. Deliver an awe inspiring pitch with this creative supplier scorecard supplier scorecard kpi dashboard with average delivery and quality score introduction pdf bundle. Topics like dollar spend over time, otd delivery, quality trend, purchase price variance, total expenditure can be discussed with this completely editable template. It is available for immediate download depending on the needs and requirements of the user.

Automobile Sales Scorecard Percentage Scorecard For Auto Sales Based On Fuel Usage Graphics PDF
This graph or chart is linked to excel, and changes automatically based on data. Just left click on it and select Edit Data. Deliver and pitch your topic in the best possible manner with this Automobile Sales Scorecard Percentage Scorecard For Auto Sales Based On Fuel Usage Graphics PDF. Use them to share invaluable insights on Petrol Engine Vehicles, Diesel Engine Vehicles, Electric Vehicles Sales and impress your audience. This template can be altered and modified as per your expectations. So, grab it now.

Finance Metrics Dashboard Indicating Account Receivable And Account Payable Demonstration PDF
This graph or chart is linked to excel, and changes automatically based on data. Just left click on it and select edit data. Showcasing this set of slides titled Finance Metrics Dashboard Indicating Account Receivable And Account Payable Demonstration PDF. The topics addressed in these templates are Total Accounts Receivable, Total Accounts Payable, Recommended Payment Timeline, Monthly Cash Flow. All the content presented in this PPT design is completely editable. Download it and make adjustments in color, background, font etc. as per your unique business setting.

Firm Marketing Dashboard Report With Closed Sales Ppt Slides Graphics Example PDF
This graph or chart is linked to excel, and changes automatically based on data. Just left click on it and select Edit Data. Showcasing this set of slides titled Firm Marketing Dashboard Report With Closed Sales Ppt Slides Graphics Example PDF. The topics addressed in these templates are Days On Market, Homes For Sale, Median Sales Price, Closed Sales. All the content presented in this PPT design is completely editable. Download it and make adjustments in color, background, font etc. as per your unique business setting.
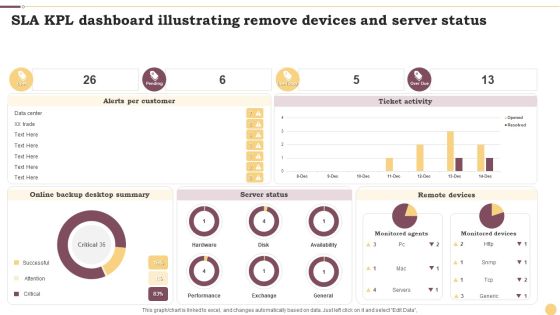
SLA KPL Dashboard Illustrating Remove Devices And Server Status Ppt Inspiration Layout Ideas PDF
This graph or chart is linked to excel, and changes automatically based on data. Just left click on it and select Edit Data. Showcasing this set of slides titled SLA KPL Dashboard Illustrating Remove Devices And Server Status Ppt Inspiration Layout Ideas PDF. The topics addressed in these templates are Alerts Per Customer, Ticket Activity, Server Status. All the content presented in this PPT design is completely editable. Download it and make adjustments in color, background, font etc. as per your unique business setting.

Human Capital Metrics With Employee Turnover Rate Ppt File Mockup PDF
This graph or chart is linked to excel, and changes automatically based on data. Just left click on it and select Edit Data. Showcasing this set of slides titled Human Capital Metrics With Employee Turnover Rate Ppt File Mockup PDF. The topics addressed in these templates are Employee Turnover Rate, Turnover Rate Division, Turnover Rate Year, Over Year. All the content presented in this PPT design is completely editable. Download it and make adjustments in color, background, font etc. as per your unique business setting.

Prevention Of Information Key Statistics Showing The Impact Of Security Awareness Infographics PDF
This graph or chart is linked to excel, and changes automatically based on data. Just left click on it and select Edit Data. This modern and well-arranged Prevention Of Information Key Statistics Showing The Impact Of Security Awareness Infographics PDF provides lots of creative possibilities. It is very simple to customize and edit with the Powerpoint Software. Just drag and drop your pictures into the shapes. All facets of this template can be edited with Powerpoint, no extra software is necessary. Add your own material, put your images in the places assigned for them, adjust the colors, and then you can show your slides to the world, with an animated slide included.
Finance Metrics Dashboard Illustrating Account Payables Icons PDF
This graph or chart is linked to excel, and changes automatically based on data. Just left click on it and select edit data. Pitch your topic with ease and precision using this Total Income Budget, Total Expenses Balance, Net Profit Quick, Ratio Current Ratio. This layout presents information on Account Payable Age, Average Creditor Days, Cash On Hand. It is also available for immediate download and adjustment. So, changes can be made in the color, design, graphics or any other component to create a unique layout.
Utilisation Of Funds Investor Pitch Deck For Food Startup Ppt Icon Graphics Tutorials PDF
Purpose of this slide is to provide information to the investors on how much money you have raised and spent. Here the pie chart indicates that company invested in marketing, technology. Deliver and pitch your topic in the best possible manner with this Utilisation Of Funds Investor Pitch Deck For Food Startup Ppt Icon Graphics Tutorials PDF. Use them to share invaluable insights on Utilisation Funds, Marketing and Promotion, Tech Expansion and impress your audience. This template can be altered and modified as per your expectations. So, grab it now.

CSR Report On Employees Statistics During Pandemic Icons PDF
This slide illustrates data related to CSR human resources of a corporation. It includes global employees, dough-nut chart of North American employees, global employees by age etc. Showcasing this set of slides titled CSR Report On Employees Statistics During Pandemic Icons PDF. The topics addressed in these templates are Global Employees, Supporting Workforce Transformation, Employees Statistics During Pandemic. All the content presented in this PPT design is completely editable. Download it and make adjustments in color, background, font etc. as per your unique business setting.
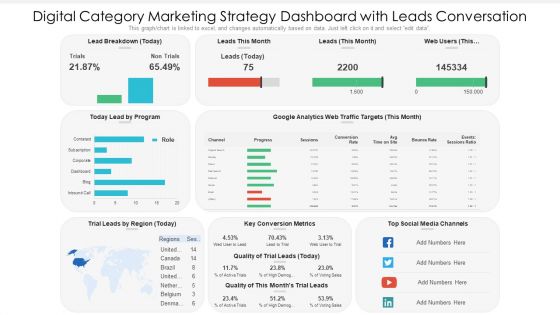
Digital Category Marketing Strategy Dashboard With Leads Conversation Ppt PowerPoint Presentation Slides Information PDF
This graph chart is linked to excel, and changes automatically based on data. Just left click on it and select edit data. Pitch your topic with ease and precision using this digital category marketing strategy dashboard with leads conversation ppt powerpoint presentation slides information pdf. This layout presents information on key conversion metrics, social media channels, lead by program. It is also available for immediate download and adjustment. So, changes can be made in the color, design, graphics or any other component to create a unique layout.

Power Plant Energy Production Dashboard For Consumption Statistics Download PDF
This graph or chart is linked to excel, and changes automatically based on data. Just left click on it and select edit data. Pitch your topic with ease and precision using this Multiple Country Energy Consumption Statistics Comparison Dashboard Formats PDF. This layout presents information on August Year 2022, Return on Investments, Power Plan Detail . It is also available for immediate download and adjustment. So, changes can be made in the color, design, graphics or any other component to create a unique layout.

Modal Transportation Share In United States Ppt Inspiration Master Slide PDF
The slide shows the pie chart presentation of percentage share of all modes of transportations Trains, Passenger cars, Other motor, buses etc., that travelers used to commute. Additionally, it provides key details related to companys strategic plan to attract new customers. Deliver and pitch your topic in the best possible manner with this modal transportation share in united states ppt inspiration master slide pdf. Use them to share invaluable insights on marketing strategy, investment in technology, strategies and impress your audience. This template can be altered and modified as per your expectations. So, grab it now.
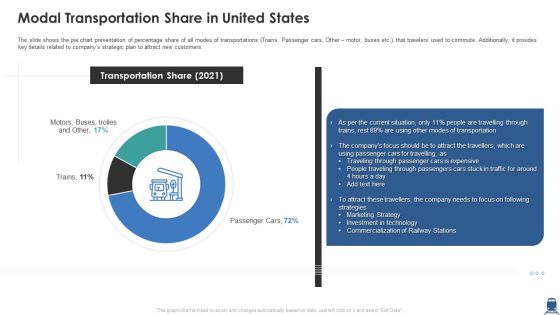
Modal Transportation Share In United States Sample PDF
The slide shows the pie chart presentation of percentage share of all modes of transportations Trains, Passenger cars, Other motor, buses etc. that travelers used to commute. Additionally, it provides key details related to companys strategic plan to attract new customers. Deliver and pitch your topic in the best possible manner with this modal transportation share in united states sample pdf. Use them to share invaluable insights on marketing strategy, investment technology, commercialization and impress your audience. This template can be altered and modified as per your expectations. So, grab it now.

Client Helpline Dashboard At Valet Information Dsk Ppt Gallery Slide Portrait PDF
This graph or chart is linked to excel, and changes automatically based on data. Just left click on it and select Edit Data. Pitch your topic with ease and precision using this Client Helpline Dashboard At Valet Information Dsk Ppt Gallery Slide Portrait PDF. This layout presents information on Valet Damage Claims, Valet Wait Times, Information Desk. It is also available for immediate download and adjustment. So, changes can be made in the color, design, graphics or any other component to create a unique layout.

Client Helpline Dashboard With Retention Rate Ppt Gallery Ideas PDF
This graph or chart is linked to excel, and changes automatically based on data. Just left click on it and select Edit Data. Pitch your topic with ease and precision using this Client Helpline Dashboard With Retention Rate Ppt Gallery Ideas PDF. This layout presents information on Cost per Support 2022, Total Requests, Total Revenue 2022, Avg Requests Answered. It is also available for immediate download and adjustment. So, changes can be made in the color, design, graphics or any other component to create a unique layout.

Firm KPI Dashboard With Average Click Through Rate Ppt Inspiration Sample PDF
This graph or chart is linked to excel, and changes automatically based on data. Just left click on it and select Edit Data. Pitch your topic with ease and precision using this Firm KPI Dashboard With Average Click Through Rate Ppt Inspiration Sample PDF. This layout presents information on Total Clicks, Total Impressive, Average CTR, Average Position. It is also available for immediate download and adjustment. So, changes can be made in the color, design, graphics or any other component to create a unique layout.

Service Level Agreement KPI Dashboard With Current Risk Statistics Topics PDF
This graph or chart is linked to excel, and changes automatically based on data. Just left click on it and select Edit Data. Pitch your topic with ease and precision using this Service Level Agreement KPI Dashboard With Current Risk Statistics Topics PDF. This layout presents information on Current Risk SLAS, Current Breached Slas, Personal Active SLA It is also available for immediate download and adjustment. So, changes can be made in the color, design, graphics or any other component to create a unique layout.

Company Financial Performance Indicators Dashboard With Liquidity And Turnover Ratios Formats PDF
This graph or chart is linked to excel, and changes automatically based on data. Just left click on it and select Edit Data. Pitch your topic with ease and precision using this Company Financial Performance Indicators Dashboard With Liquidity And Turnover Ratios Formats PDF. This layout presents information on Cash Balance, Days Inventory Outstanding, Days Payable Outstanding. It is also available for immediate download and adjustment. So, changes can be made in the color, design, graphics or any other component to create a unique layout.
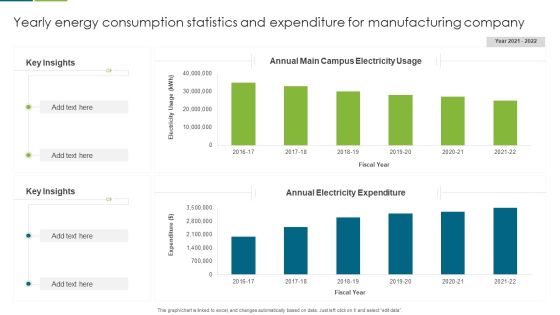
Yearly Energy Consumption Statistics And Expenditure For Manufacturing Company Guidelines PDF
This graph or chart is linked to excel, and changes automatically based on data. Just left click on it and select edit data. Pitch your topic with ease and precision using this Yearly Energy Consumption Statistics And Expenditure For Manufacturing Company Guidelines PDF. This layout presents information on Key Insights, Annual Electricity Expenditure, Annual Main Campus, Electricity Usage. It is also available for immediate download and adjustment. So, changes can be made in the color, design, graphics or any other component to create a unique layout.

SLA KPL Dashboard Illustrating Risk And Active Services Ppt Portfolio Design Inspiration PDF
This graph or chart is linked to excel, and changes automatically based on data. Just left click on it and select Edit Data. Pitch your topic with ease and precision using this SLA KPL Dashboard Illustrating Risk And Active Services Ppt Portfolio Design Inspiration PDF. This layout presents information on My Active SLAs, Database Group, Priority. It is also available for immediate download and adjustment. So, changes can be made in the color, design, graphics or any other component to create a unique layout.

Kanban Structure To Track Proposed Active And Completed Activities Ppt Outline Slide Portrait PDF
This graph or chart is linked to excel, and changes automatically based on data. Just left click on it and select Edit Data. Pitch your topic with ease and precision using this Kanban Structure To Track Proposed Active And Completed Activities Ppt Outline Slide Portrait PDF. This layout presents information on Project Lead Time, Cycle Time, Completed. It is also available for immediate download and adjustment. So, changes can be made in the color, design, graphics or any other component to create a unique layout.

Kanban Structure With Task Count And Cycle Time Ppt Layouts Background Designs PDF
This graph or chart is linked to excel, and changes automatically based on data. Just left click on it and select Edit Data. Pitch your topic with ease and precision using this Kanban Structure With Task Count And Cycle Time Ppt Layouts Background Designs PDF. This layout presents information on Required Project Design, Project Design Approval, Construct. It is also available for immediate download and adjustment. So, changes can be made in the color, design, graphics or any other component to create a unique layout.
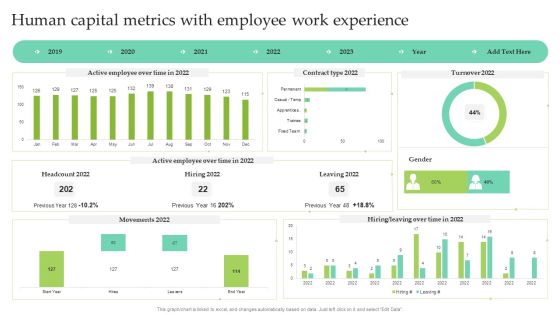
Human Capital Metrics With Employee Work Experience Ppt Show Images PDF
This graph or chart is linked to excel, and changes automatically based on data. Just left click on it and select Edit Data. Pitch your topic with ease and precision using this Human Capital Metrics With Employee Work Experience Ppt Show Images PDF. This layout presents information on Active Employee, Over Time, Contract Type 2022, Leaving 2022. It is also available for immediate download and adjustment. So, changes can be made in the color, design, graphics or any other component to create a unique layout.
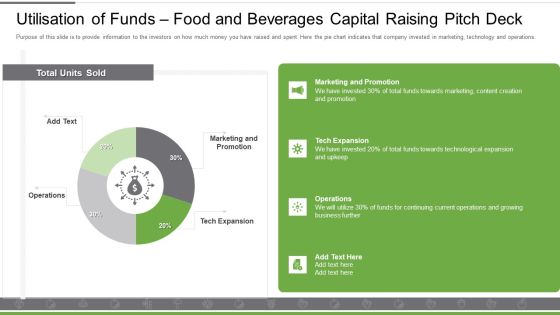
Utilisation Of Funds Food And Beverages Capital Raising Pitch Deck Portrait PDF
Purpose of this slide is to provide information to the investors on how much money you have raised and spent. Here the pie chart indicates that company invested in marketing, technology and operations. Deliver an awe inspiring pitch with this creative utilisation of funds food and beverages capital raising pitch deck portrait pdf bundle. Topics like marketing and promotion, tech expansion, operations can be discussed with this completely editable template. It is available for immediate download depending on the needs and requirements of the user.
