Chart Analysis
Pie Chart Investment Ppt PowerPoint Presentation Gallery Icon
This is a pie chart investment ppt powerpoint presentation gallery icon. This is a three stage process. The stages in this process are pie chart, finance, marketing, analysis, investment.

Area Chart Finance Marketing Ppt PowerPoint Presentation Summary Icons
This is a area chart finance marketing ppt powerpoint presentation summary icons. This is a three stage process. The stages in this process are area chart, finance, marketing, analysis, investment.

Stock Chart Ppt PowerPoint Presentation Summary Format Ideas
This is a stock chart ppt powerpoint presentation summary format ideas. This is a one stage process. The stages in this process are stock chart, finance, business, analysis, marketing.

Column Chart Ppt PowerPoint Presentation Gallery Graphics Pictures
This is a column chart ppt powerpoint presentation gallery graphics pictures. This is a two stage process. The stages in this process are column chart, finance, planning, analysis, management, growth.

Area Chart Ppt PowerPoint Presentation Visual Aids Gallery
This is a area chart ppt powerpoint presentation visual aids gallery. This is a two stage process. The stages in this process are area chart, finance, marketing, analysis, business.

Column Chart Finance Ppt PowerPoint Presentation Model Examples
This is a column chart finance ppt powerpoint presentation model examples. This is a two stage process. The stages in this process are column chart, finance, marketing, analysis, investment.

Area Chart Investment Ppt PowerPoint Presentation Styles Topics
This is a area chart investment ppt powerpoint presentation styles topics. This is a three stage process. The stages in this process are area chart, finance, marketing, analysis, investment.

Area Chart Finance Ppt PowerPoint Presentation Outline Brochure
This is a area chart finance ppt powerpoint presentation outline brochure. This is a four stage process. The stages in this process are area chart, finance, marketing, analysis, investment.

Area Chart Finance Ppt PowerPoint Presentation Infographics Slide
This is a area chart finance ppt powerpoint presentation infographics slide. This is a three stage process. The stages in this process are area chart, finance, marketing, analysis, investment.

Area Chart Finance Marketing Ppt PowerPoint Presentation Gallery Styles
This is a area chart finance marketing ppt powerpoint presentation gallery styles. This is a three stage process. The stages in this process are area chart, finance, marketing, analysis, investment.

Area Chart Finance Ppt PowerPoint Presentation Pictures Clipart
This is a area chart finance ppt powerpoint presentation pictures clipart. This is a two stage process. The stages in this process are area chart, finance, marketing, analysis, investment.

Donut Pie Chart Ppt PowerPoint Presentation Professional Format Ideas
This is a donut pie chart ppt powerpoint presentation professional format ideas. This is a three stage process. The stages in this process are donut pie chart, marketing, strategy, analysis, business.

Pie Chart Ppt PowerPoint Presentation Portfolio Maker
This is a pie chart ppt powerpoint presentation portfolio maker. This is a five stage process. The stages in this process are business, pie chart, finance, process, planning.

Bar Chart Ppt PowerPoint Presentation Deck
This is a bar chart ppt powerpoint presentation deck. This is a four stage process. The stages in this process are business, marketing, management, bar chart, finance.
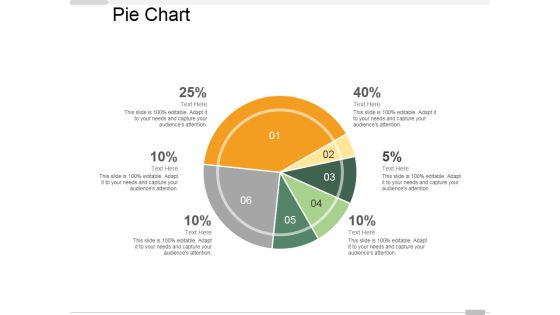
Pie Chart Ppt PowerPoint Presentation Infographic Template Master Slide
This is a pie chart ppt powerpoint presentation infographic template master slide. This is a six stage process. The stages in this process are pie chart, marketing, finance, analysis, business.
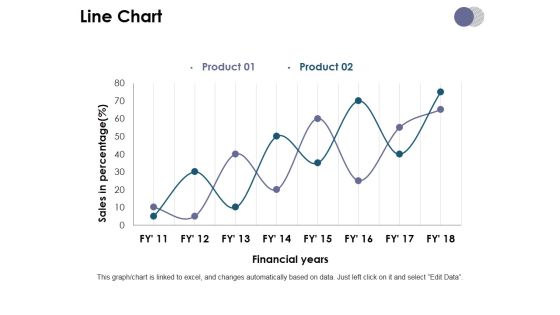
Line Chart Ppt PowerPoint Presentation Model Slide Download
This is a line chart ppt powerpoint presentation model slide download. This is a two stage process. The stages in this process are line chart, growth, finance, analysis, business.
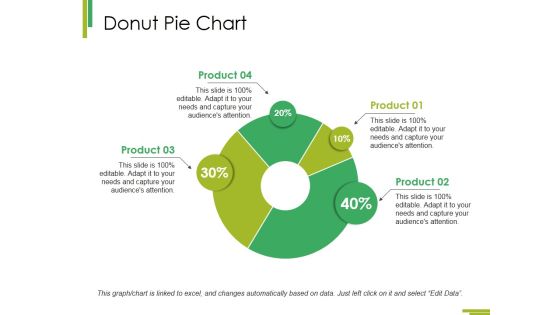
Donut Pie Chart Ppt PowerPoint Presentation Show Visual Aids
This is a donut pie chart ppt powerpoint presentation show visual aids. This is a four stage process. The stages in this process are donut pie chart, business, marketing, analysis, finance.
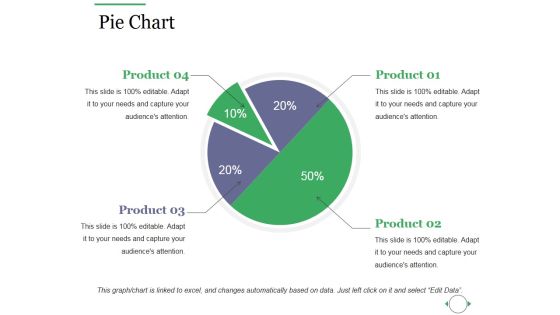
Pie Chart Ppt PowerPoint Presentation Infographic Template Summary
This is a pie chart ppt powerpoint presentation infographic template summary. This is a four stage process. The stages in this process are pie chart, marketing, strategy, analysis, business.

Line Chart Ppt PowerPoint Presentation Infographics File Formats
This is a line chart ppt powerpoint presentation infographics file formats. This is a two stage process. The stages in this process are line chart, growth, strategy, analysis, business.

Line Chart Ppt PowerPoint Presentation Inspiration Graphics Tutorials
This is a line chart ppt powerpoint presentation inspiration graphics tutorials. This is a two stage process. The stages in this process are line chart, growth, strategy, analysis, business.

Clustered Bar Chart Finance Ppt PowerPoint Presentation Styles Design Inspiration
This is a clustered bar chart finance ppt powerpoint presentation styles design inspiration. This is a two stage process. The stages in this process are clustered bar chart, finance, business, analysis, investment.

Bubble Chart Finance Ppt PowerPoint Presentation File Graphics
This is a bubble chart finance ppt powerpoint presentation file graphics. This is a two stage process. The stages in this process are bubble chart, finance, marketing, analysis, investment.

Combo Chart Finance Ppt PowerPoint Presentation Slides Backgrounds
This is a combo chart finance ppt powerpoint presentation slides backgrounds. This is a three stage process. The stages in this process are combo chart, finance, marketing, analysis, business.

Area Chart Ppt PowerPoint Presentation Slides Deck
This is a area chart ppt powerpoint presentation slides deck. This is a two stage process. The stages in this process are financial, sales in percentage, business, marketing, management.

Area Chart Ppt PowerPoint Presentation Inspiration Display
This is a area chart ppt powerpoint presentation inspiration display. This is a two stage process. The stages in this process are area chart, finance, growth, success, strategy, business.

Pareto Chart Ppt PowerPoint Presentation Ideas
This is a pareto chart ppt powerpoint presentation ideas. This is a four stage process. The stages in this process are bar graph, finance, marketing, strategy, analysis, business.

Line Chart Ppt PowerPoint Presentation Summary Portfolio
This is a line chart ppt powerpoint presentation summary portfolio. This is a eight stage process. The stages in this process are finance, planning, management, business, process, strategy.

Pareto Chart Ppt PowerPoint Presentation Shapes
This is a pareto chart ppt powerpoint presentation shapes. This is a eight stage process. The stages in this process are business, strategy, marketing, success, growth strategy.

Area Chart Ppt PowerPoint Presentation Graphics
This is a area chart ppt powerpoint presentation graphics. This is a two stage process. The stages in this process are business, marketing, management, product, finance.

Column Chart Ppt PowerPoint Presentation Introduction
This is a column chart ppt powerpoint presentation introduction. This is a nine stage process. The stages in this process are business, marketing, management, growth, timeline.

Combo Chart Ppt PowerPoint Presentation Inspiration
This is a combo chart ppt powerpoint presentation inspiration. This is a eight stage process. The stages in this process are business, marketing, management, growth, timeline.

Combo Chart Ppt PowerPoint Presentation Files
This is a combo chart ppt powerpoint presentation files. This is a eight stage process. The stages in this process are business, marketing, growth, timeline, graph.

Scatter Bubble Chart Ppt PowerPoint Presentation Slides
This is a scatter bubble chart ppt powerpoint presentation slides. This is a eight stage process. The stages in this process are in price, highest sale, business, management.

Pie Chart Investment Finance Ppt PowerPoint Presentation Outline Objects
Presenting this set of slides with name pie chart investment finance ppt powerpoint presentation outline objects. The topics discussed in these slides are pie chart, finance, analysis, business, investment, marketing. This is a completely editable PowerPoint presentation and is available for immediate download. Download now and impress your audience.

Business Framework Bar Chart In PowerPoint Presentation
This power point diagram slide has been designed with graphic of bar chart. In this diagram slide we have used green and blue colored vertical bar graph. Display result analysis with this bar graph diagram and use it in your result verification and analysis related presentations.

Area Chart Ppt PowerPoint Presentation Pictures Rules
This is a area chart ppt powerpoint presentation pictures rules. This is a two stage process. The stages in this process are area chart, business, marketing, strategy, success.

Combo Chart Ppt PowerPoint Presentation Portfolio Infographics
This is a combo chart ppt powerpoint presentation portfolio infographics. This is a eight stage process. The stages in this process are market size, growth, years, finance, business.

Lead Scoring Chart Powerpoint Slide Background
This is a lead scoring chart powerpoint slide background. This is a six stage process. The stages in this process are measurable roi on lead generation program, increased conversion rates from qualified lead to opportunity, increased sales productivity and effectiveness, shortened sales cycle, better forecast and pipeline visibility, better alignment of marketing and sales efforts.

Architecture Development Method Chart Powerpoint Presentation
This is a architecture development method chart powerpoint presentation. This is a ten stage process. The stages in this process are strategic roadmap, current state, requirements, initial planning, deployment, analysis and design, evaluation, future state, architecture vision, business case.
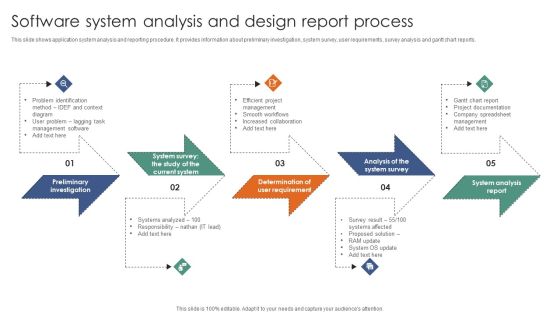
Software System Analysis And Design Report Process Ppt Inspiration Background Designs PDF
This slide shows application system analysis and reporting procedure. It provides information about preliminary investigation, system survey, user requirements, survey analysis and gantt chart reports. Presenting Software System Analysis And Design Report Process Ppt Inspiration Background Designs PDF to dispense important information. This template comprises five stages. It also presents valuable insights into the topics including Problem Identification, Preliminary Investigation, System Analysis. This is a completely customizable PowerPoint theme that can be put to use immediately. So, download it and address the topic impactfully.

Chart Of Four Business Steps Powerpoint Templates
This business diagram displays flow of four business steps. This editable slide is suitable to present growth management. Use this diagram for business and finance related topics and display complete data analysis in your presentation.

Business Diagram Pie Chart Showing Percentages Presentation Slide Template
This power point diagram template has been designed with graphic of pie chart with percentage values. Use this pie chart for result analysis display in any business presentation. Build an exclusive presentation for your viewers by using this professional diagram template.

Business Market Research Services Chart Slides
This is a business market research services chart slides. This is a five stage process. The stages in this process are detailed demographic and expenditure reports, competitive analysis trends and benchmarks, industry and economic profile by region, sme performance reports by sector, information on businesses in canada and north america.
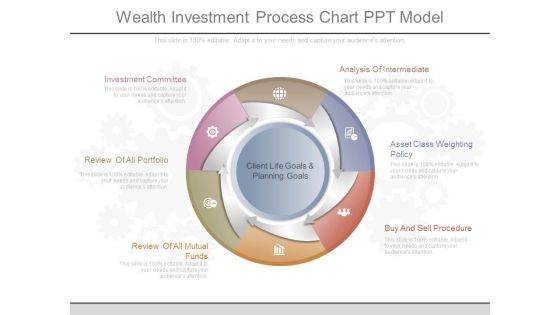
Wealth Investment Process Chart Ppt Model
This is a wealth investment process chart ppt model. This is a six stage process. The stages in this process are investment committee, review of all portfolio, review of all mutual funds, client life goals and planning goals, analysis of intermediate, asset class weighting policy, buy and sell procedure.
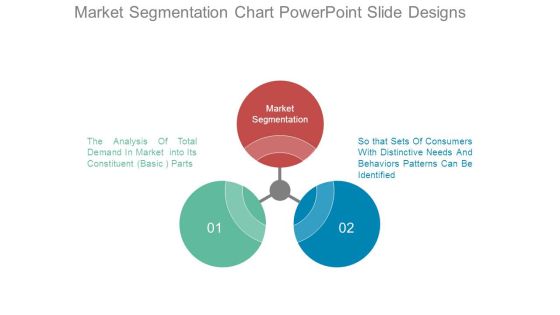
Market Segmentation Chart Powerpoint Slide Designs
This is a market segmentation chart powerpoint slide designs. This is a three stage process. The stages in this process are market segmentation, so that sets of consumers with distinctive needs and behaviors patterns can be identified, the analysis of total demand in market into its constituent basic parts.
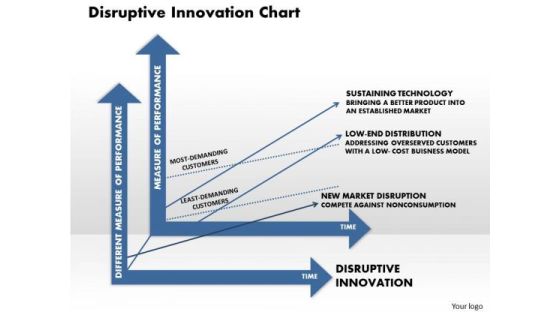
Business Framework Disruptive Innovation Chart PowerPoint Presentation
This image slide displays business framework for diminishing marginal returns. This image slide may be used in your presentations to depict analysis in marketing and business. You may change color, size and orientation of any icon to your liking. Create wonderful presentations using this image slide.
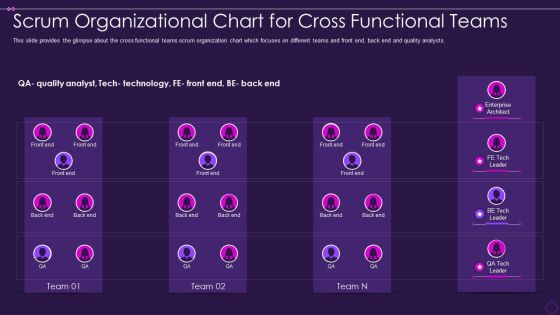
Scrum Organizational Chart Scrum Organizational Chart For Cross Functional Teams Pictures PDF
This slide provides the glimpse about the cross functional teams scrum organization chart which focuses on different teams and front end, back end and quality analysts. Deliver and pitch your topic in the best possible manner with this scrum organizational chart scrum organizational chart for cross functional teams pictures pdf. Use them to share invaluable insights on scrum organizational chart for cross functional teams and impress your audience. This template can be altered and modified as per your expectations. So, grab it now.
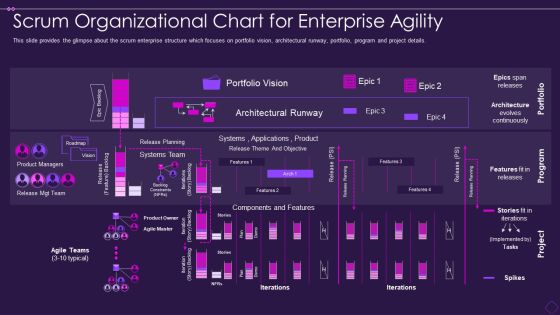
Scrum Organizational Chart Scrum Organizational Chart For Enterprise Agility Designs PDF
This slide provides the glimpse about the scrum enterprise structure which focuses on portfolio vision, architectural runway, portfolio, program and project details. Deliver an awe inspiring pitch with this creative scrum organizational chart scrum organizational chart for enterprise agility designs pdf bundle. Topics like product, applications, systems, planning can be discussed with this completely editable template. It is available for immediate download depending on the needs and requirements of the user.
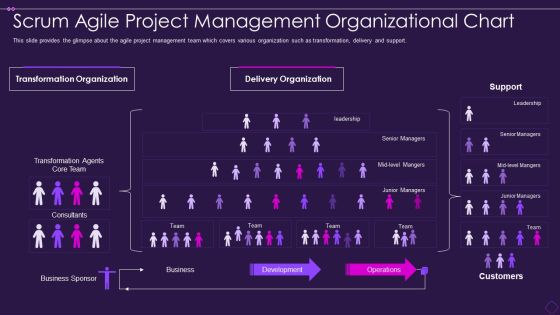
Scrum Organizational Chart Scrum Agile Project Management Organizational Chart Slides PDF
This slide provides the glimpse about the agile project management team which covers various organization such as transformation, delivery and support. Deliver an awe inspiring pitch with this creative scrum organizational chart scrum agile project management organizational chart slides pdf bundle. Topics like business, development, operations, customers can be discussed with this completely editable template. It is available for immediate download depending on the needs and requirements of the user.

Scrum Organizational Chart Scrum Organizational Chart Of Large Scrum Team Summary PDF
This slide provides the glimpse about the large agile scrum team organization structure which focuses on leadership team, DAD sub team and supporting casts with consumable solution. Deliver and pitch your topic in the best possible manner with this scrum organizational chart scrum organizational chart of large scrum team summary pdf. Use them to share invaluable insights on produces, architecture ownership, product ownership, product coordination and impress your audience. This template can be altered and modified as per your expectations. So, grab it now.

Bar Chart Ppt PowerPoint Presentation Model Clipart Images
This is a bar chart ppt powerpoint presentation model clipart images. This is a two stage process. The stages in this process are bar chart, finance, marketing, strategy, analysis.

Combo Chart Ppt PowerPoint Presentation Infographic Template Visuals
This is a combo chart ppt powerpoint presentation infographic template visuals. This is a three stage process. The stages in this process are business, finance, strategy, analysis, combo chart.

Combo Chart Ppt PowerPoint Presentation Layouts Design Templates
This is a combo chart ppt powerpoint presentation layouts design templates. This is a two stage process. The stages in this process are combo chart, finance, marketing, strategy, analysis, business.
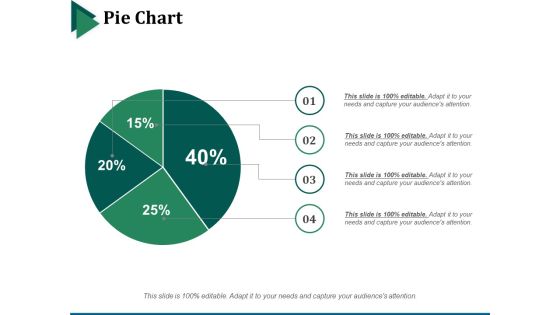
Pie Chart Ppt PowerPoint Presentation Infographic Template Backgrounds
This is a pie chart ppt powerpoint presentation infographic template backgrounds. This is a four stage process. The stages in this process are pie chart, marketing, strategy, finance, analysis.
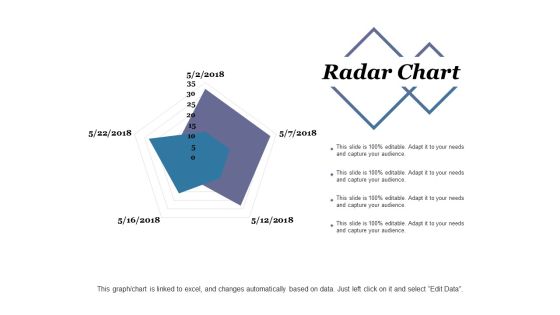
Radar Chart Ppt PowerPoint Presentation Infographic Template Sample
This is a radar chart ppt powerpoint presentation infographic template sample. This is a two stage process. The stages in this process are radar chart, finance, marketing, strategy, analysis.

Pareto Chart Template 2 Ppt PowerPoint Presentation Outline Model
This is a pareto chart template 2 ppt powerpoint presentation outline model. This is a eight stage process. The stages in this process are pareto chart, finance, marketing, strategy, analysis.
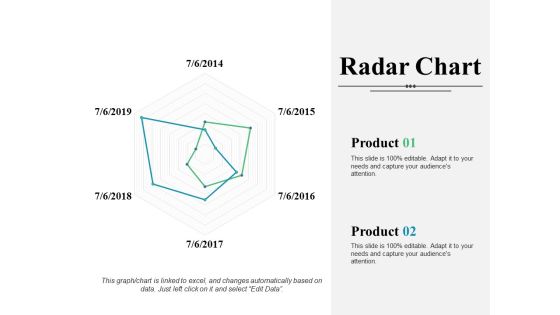
Radar Chart Ppt PowerPoint Presentation Infographic Template Introduction
This is a radar chart ppt powerpoint presentation infographic template introduction. This is a two stage process. The stages in this process are radar chart, finance, marketing, strategy, analysis, business.
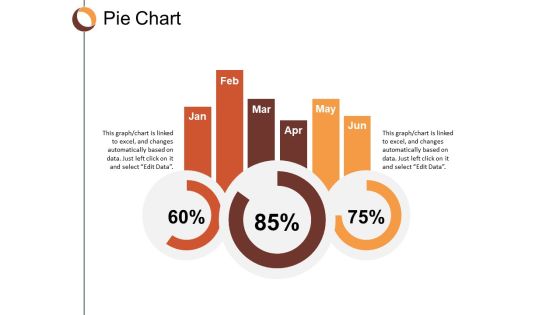
Pie Chart Finance Ppt Powerpoint Presentation Infographic Template Clipart
This is a pie chart finance ppt powerpoint presentation infographic template clipart. This is a three stage process. The stages in this process are pie chart, finance, marketing, business, analysis.

Combo Chart Ppt PowerPoint Presentation File Example Introduction
This is a combo chart ppt powerpoint presentation file example introduction. This is a ten stage process. The stages in this process are business, strategy, analysis, pretention, chart and graph.
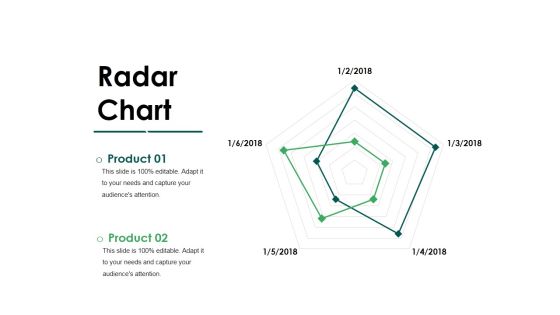
Radar Chart Ppt PowerPoint Presentation Inspiration File Formats
This is a radar chart ppt powerpoint presentation inspiration file formats. This is a two stage process. The stages in this process are radar chart, business, finance, management, analysis.
 Home
Home