Chart Analysis

5 Years Profit And Loss Comparative Analysis Chart Of Enterprise Ppt Icon Graphics PDF
This slide represents the comparison of profit and loss of an organization for the five years. It includes details related to profit and loss from various accounts such as order fees, concession income, facility rental etc. Pitch your topic with ease and precision using this 5 Years Profit And Loss Comparative Analysis Chart Of Enterprise Ppt Icon Graphics PDF. This layout presents information on Account, 2018 To 2022, Exchange Fees. It is also available for immediate download and adjustment. So, changes can be made in the color, design, graphics or any other component to create a unique layout.
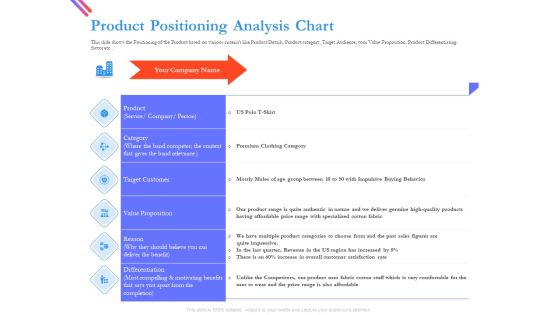
Pitch Deck For Fund Raising From Series C Funding Product Positioning Analysis Chart Demonstration PDF
This slide shows the Positioning of the Product based on various criterias like Product Details, Product category, Target Audience, your Value Proposition, Product Differentiating factor etc. Deliver and pitch your topic in the best possible manner with this pitch deck for fund raising from series c funding product positioning analysis chart demonstration pdf. Use them to share invaluable insights on service, target customer, revenue, value proposition and impress your audience. This template can be altered and modified as per your expectations. So, grab it now.

Pitch Deck For Raising Capital For Inorganic Growth Product Positioning Analysis Chart Guidelines PDF
This slide shows the Positioning of the Product based on various criterias like Product Details, Product category, Target Audience, your Value Proposition, Product Differentiating factor etc. Deliver and pitch your topic in the best possible manner with this pitch deck for raising capital for inorganic growth product positioning analysis chart guidelines pdf. Use them to share invaluable insights on service, target customer, revenue, value proposition and impress your audience. This template can be altered and modified as per your expectations. So, grab it now.
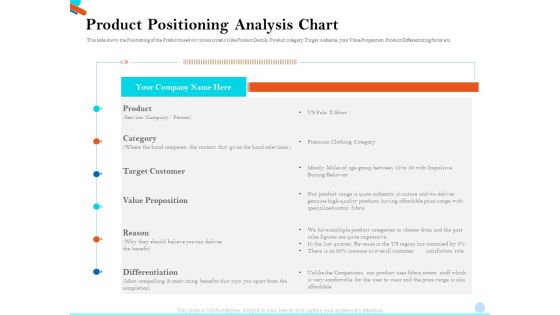
Pitch Presentation Raising Series C Funds Investment Company Product Positioning Analysis Chart Topics PDF
This slide shows the Positioning of the Product based on various criterias like Product Details, Product category, Target Audience, your Value Proposition, Product Differentiating factor etc. Deliver and pitch your topic in the best possible manner with this pitch presentation raising series c funds investment company product positioning analysis chart topics pdf. Use them to share invaluable insights on target customer, value proposition, product, service and impress your audience. This template can be altered and modified as per your expectations. So, grab it now.
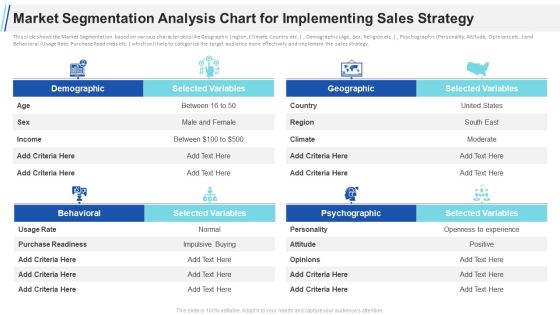
Maximizing Profitability Earning Through Sales Initiatives Market Segmentation Analysis Chart For Implementing Sales Strategy Slides PDF
This slide shows the Market Segmentation based on various characteristics like Geographic region, Climate, Country etc.. , Demographic Age, Sex, Religion etc.., Psychographic Personality, Attitude, Opinions etc.. and Behavioral Usage Rate, Purchase Readiness etc.. which will help to categorize the target audience more effectively and implement the sales strategy. Deliver an awe inspiring pitch with this creative maximizing profitability earning through sales initiatives market segmentation analysis chart for implementing sales strategy slides pdf bundle. Topics like united states, purchase readiness, male and female, selected variables, demographic can be discussed with this completely editable template. It is available for immediate download depending on the needs and requirements of the user.

Pitch Deck For Fundraising From Angel Investors Market Segmentation Analysis Chart Ppt Styles File Formats PDF
This slide shows the Market Segmentation based on various characteristics like Geographic region, Climate, Country etc., Demographic Age, Sex, Religion etc., Psychographic Personality, Attitude, Opinions etc. and Behavioral Usage rate, Purchase Readiness etc. which will help to categorize the target audience more effectively. Deliver an awe inspiring pitch with this creative pitch deck for fundraising from angel investors market segmentation analysis chart ppt styles file formats pdf bundle. Topics like united states, criteria, purchase readiness can be discussed with this completely editable template. It is available for immediate download depending on the needs and requirements of the user.
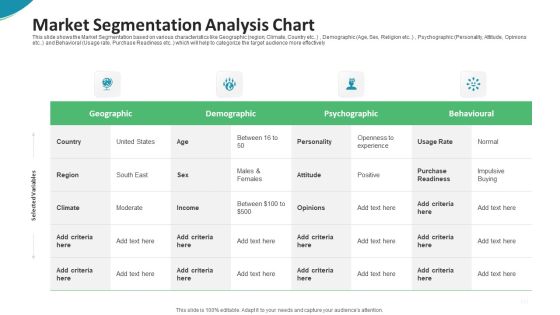
Investor Pitch Deck For Seed Funding From Private Investor Market Segmentation Analysis Chart Formats PDF
This slide shows the Market Segmentation based on various characteristics like Geographic region, Climate, Country etc., Demographic Age, Sex, Religion etc. , Psychographic Personality, Attitude, Opinions etc. and Behavioral Usage rate, Purchase Readiness etc. which will help to categorize the target audience more effectively.Deliver and pitch your topic in the best possible manner with this investor pitch deck for seed funding from private investor market segmentation analysis chart formats pdf. Use them to share invaluable insights on geographic, demographic, psychographic and impress your audience. This template can be altered and modified as per your expectations. So, grab it now.
Investor Pitch Deck Generate Start Up Finance Venture Capitalist Market Segmentation Analysis Chart Demonstration PDF
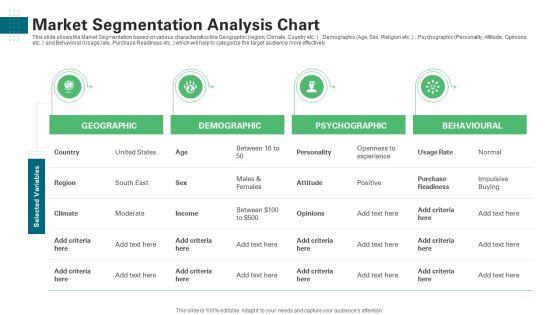
This slide shows the Market Segmentation based on various characteristics like Geographic region, Climate, Country etc., Demographic Age, Sex, Religion etc., Psychographic Personality, Attitude, Opinions etc. and Behavioral Usage rate, Purchase Readiness etc. which will help to categorize the target audience more effectively. Deliver an awe-inspiring pitch with this creative investor pitch deck generate start up finance venture capitalist market segmentation analysis chart demonstration pdf bundle. Topics like geographic, demographic, psychographic, behavioural can be discussed with this completely editable template. It is available for immediate download depending on the needs and requirements of the user.

Pitch Deck To Raise New Venture Financing From Seed Investors Market Segmentation Analysis Chart Template PDF
This slide shows the Market Segmentation based on various characteristics like Geographic region, Climate, Country etc, Demographic Age, Sex, Religion etc, Psychographic Personality, Attitude, Opinions etc. and Behavioral Usage rate, Purchase Readiness etc. which will help to categorize the target audience more effectively Deliver an awe inspiring pitch with this creative pitch deck to raise new venture financing from seed investors market segmentation analysis chart template pdf bundle. Topics like demographic, psychographic, behavioural can be discussed with this completely editable template. It is available for immediate download depending on the needs and requirements of the user.

5 Years Attrition Rate Comparative Analysis Chart Of IT Company Ppt Layouts Examples PDF
This slide represents the table showing the comparison between attrition rates and no. of employees of an IT company over the five years. It includes details related to attrition rates and no. of employees during different years. Showcasing this set of slides titled 5 Years Attrition Rate Comparative Analysis Chart Of IT Company Ppt Layouts Examples PDF. The topics addressed in these templates are Attrition Rate, No Employees, 2018 To 2022. All the content presented in this PPT design is completely editable. Download it and make adjustments in color, background, font etc. as per your unique business setting.

5 Years Comparative Analysis Chart Of Balance Sheet Of Organization Ppt Inspiration Slide PDF
This slider represents the five years comparison of organizations balance sheet. It includes details related to total assets and liabilities along with total equity over different years. Pitch your topic with ease and precision using this 5 Years Comparative Analysis Chart Of Balance Sheet Of Organization Ppt Inspiration Slide PDF. This layout presents information on Account Assets, Total Assets Liabilities, Total Liabilities Equity. It is also available for immediate download and adjustment. So, changes can be made in the color, design, graphics or any other component to create a unique layout.

5 Years Comparative Analysis Chart Of Companys Financial Position Ppt Layouts Structure PDF
This slide represents the table showing the five comparison of financial position of a company. It includes details related to income and profitability, cash flow and investments and financial position of the company. Showcasing this set of slides titled 5 Years Comparative Analysis Chart Of Companys Financial Position Ppt Layouts Structure PDF. The topics addressed in these templates are Income And Profitability, Financial Position, Balance Sheet Total. All the content presented in this PPT design is completely editable. Download it and make adjustments in color, background, font etc. as per your unique business setting.

5 Years Comparative Analysis Chart Of Liquidity Ratios Of IT Companies Ppt Portfolio Visual Aids PDF
This slide represents the table showing comparison between current and quick ratios of two IT companies over five years. It includes details related to current and quick ratios for both companies for different years along with the average of their five years ratios. Pitch your topic with ease and precision using this 5 Years Comparative Analysis Chart Of Liquidity Ratios Of IT Companies Ppt Portfolio Visual Aids PDF. This layout presents information on Current Ratio, Average, 2018 To 2022. It is also available for immediate download and adjustment. So, changes can be made in the color, design, graphics or any other component to create a unique layout.

5 Years Expenses Comparative Analysis Chart For Core Banking Solutions Ppt Portfolio Clipart Images PDF
This slide shows the table representing the five years comparison between various costs incurred in installation of core banking solutions. It includes details related to various expenses such as entry level server, increase in electricity costs etc. Pitch your topic with ease and precision using this 5 Years Expenses Comparative Analysis Chart For Core Banking Solutions Ppt Portfolio Clipart Images PDF. This layout presents information on Entry Level Server, Antivirus Server, Increase Electricity Cost. It is also available for immediate download and adjustment. So, changes can be made in the color, design, graphics or any other component to create a unique layout.

5 Years General Ledger Comparative Analysis Chart Report Ppt Model Slide PDF
This slide represents the report showing the comparison of the general ledger of five years of a company. It includes various assets such as cash, restricted bank, other payments, furnitures and fixtures etc. Showcasing this set of slides titled 5 Years General Ledger Comparative Analysis Chart Report Ppt Model Slide PDF. The topics addressed in these templates are Other Payment, Investments, Fixed Assets. All the content presented in this PPT design is completely editable. Download it and make adjustments in color, background, font etc. as per your unique business setting.

5 Years Net Income Comparative Analysis Chart Of Financial Institute Ppt Show Designs PDF
This slide represents the comparison of net income of financial institute for different years. It includes details related to total revenue, gross profit, operating income and net income and ratios of the institute for different years. Showcasing this set of slides titled 5 Years Net Income Comparative Analysis Chart Of Financial Institute Ppt Show Designs PDF. The topics addressed in these templates are Income Statement, 2018 To 2022, Ratios. All the content presented in this PPT design is completely editable. Download it and make adjustments in color, background, font etc. as per your unique business setting.

5 Years Returns Comparative Analysis Chart Of Various Mutual Funds Ppt Slides Microsoft PDF
This slide covers the table representing the comparison of various mutual funds on the basis of five years return. It includes details related to names of funds, category, 1st, 3rd and 5 years returns. Showcasing this set of slides titled 5 Years Returns Comparative Analysis Chart Of Various Mutual Funds Ppt Slides Microsoft PDF. The topics addressed in these templates are Diversified Equity, Small And Midcap, Diversified Equity. All the content presented in this PPT design is completely editable. Download it and make adjustments in color, background, font etc. as per your unique business setting.
Profit And Sales Comparative Analysis Chart Of Last 5 Years Ppt Visual Aids Example 2015 PDF
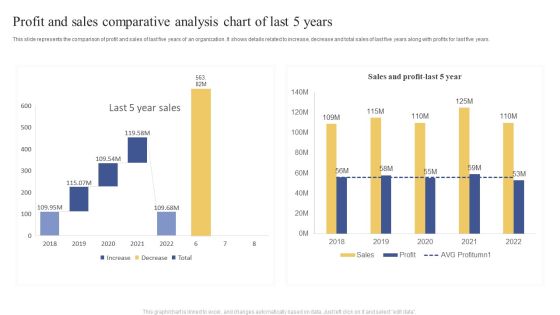
This slide represents the comparison of profit and sales of last five years of an organization. It shows details related to increase, decrease and total sales of last five years along with profits for last five years. Showcasing this set of slides titled Profit And Sales Comparative Analysis Chart Of Last 5 Years Ppt Visual Aids Example 2015 PDF. The topics addressed in these templates are Last 5 Year, Sales, 2018 To 2022. All the content presented in this PPT design is completely editable. Download it and make adjustments in color, background, font etc. as per your unique business setting.

5 Years Sales And Profit Growth Comparative Analysis Chart Of Private Banks Infographics PDF
This slide shows the table representing the comparison between sales and profit growth of five years of various private banks. It includes details related to names of private banks and their five years sales growth and profit growth. Pitch your topic with ease and precision using this 5 Years Sales And Profit Growth Comparative Analysis Chart Of Private Banks Infographics PDF. This layout presents information on Private Banks, Sales Growth, Profit Growth. It is also available for immediate download and adjustment. So, changes can be made in the color, design, graphics or any other component to create a unique layout.

Five Years Comparative Analysis Chart Of Organizations Expenses And Savings Topics PDF
This slide represents the five years comparison of savings and expenses incurred by an organization during installation of software solutions. It includes details related to expenses with and without solutions, yearly and total savings. Showcasing this set of slides titled Five Years Comparative Analysis Chart Of Organizations Expenses And Savings Topics PDF. The topics addressed in these templates are Expenses Without Solution, Yearly Savings, Total Savings. All the content presented in this PPT design is completely editable. Download it and make adjustments in color, background, font etc. as per your unique business setting.

5 Years Price Comparative Analysis Chart Of Cloud Service Solutions Brochure PDF
This slide represents the table showing the five years comparison of prices incurred in installing cloud service solution in the organization. It includes details related to on-premises prices, cloud services price and savings for different years. Showcasing this set of slides titled 5 Years Price Comparative Analysis Chart Of Cloud Service Solutions Brochure PDF. The topics addressed in these templates are Cloud, Savings, 2018 To 2022. All the content presented in this PPT design is completely editable. Download it and make adjustments in color, background, font etc. as per your unique business setting.

5 Years Comparative Analysis Chart Ppt PowerPoint Presentation Complete Deck With Slides
Improve your presentation delivery using this 5 Years Comparative Analysis Chart Ppt PowerPoint Presentation Complete Deck With Slides. Support your business vision and objectives using this well-structured PPT deck. This template offers a great starting point for delivering beautifully designed presentations on the topic of your choice. Comprising twenty slides this professionally designed template is all you need to host discussion and meetings with collaborators. Each slide is self-explanatory and equipped with high-quality graphics that can be adjusted to your needs. Therefore, you will face no difficulty in portraying your desired content using this PPT slideshow. This PowerPoint slideshow contains every important element that you need for a great pitch. It is not only editable but also available for immediate download and utilization. The color, font size, background, shapes everything can be modified to create your unique presentation layout. Therefore, download it now.

Market Analysis Chart Digital Content Ppt PowerPoint Presentation Complete Deck With Slides
Improve your presentation delivery using this market analysis chart digital content ppt powerpoint presentation complete deck with slides. Support your business vision and objectives using this well-structured PPT deck. This template offers a great starting point for delivering beautifully designed presentations on the topic of your choice. Comprising twelve this professionally designed template is all you need to host discussion and meetings with collaborators. Each slide is self-explanatory and equipped with high-quality graphics that can be adjusted to your needs. Therefore, you will face no difficulty in portraying your desired content using this PPT slideshow. This PowerPoint slideshow contains every important element that you need for a great pitch. It is not only editable but also available for immediate download and utilization. The color, font size, background, shapes everything can be modified to create your unique presentation layout. Therefore, download it now.

Business Diagram Alarm Clock With Pie Chart For Result Analysis PowerPoint Slide
This business slide displays alarm clock with pie chart. This diagram is a data visualization tool that gives you a simple way to present statistical information. This slide helps your audience examine and interpret the data you present.
Stock Photo Green 3d Pie Chart For Result Analysis PowerPoint Slide
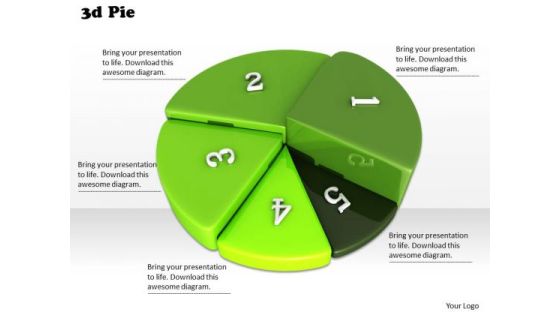
Develop competitive advantage with this image which contains 3d pie chart with five steps. Use this image to define steps of business process with this image of pie chart. This image is an excellent tool to give an ideal presentation.
Bar And Pie Chart For Result Analysis PowerPoint Templates Ppt Backgrounds For Slides 0513
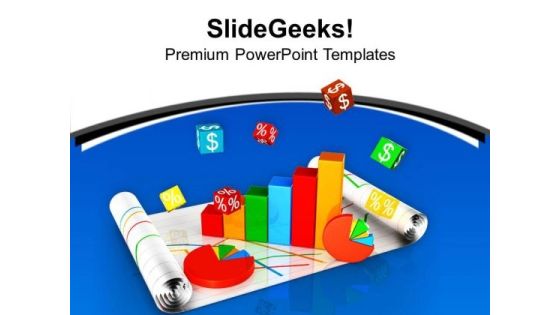
Our Great Team Has Conjured Up A Web Of business Power Point Templates. Use Them To String Together Your Glistening Ideas. Think Of It And Be Sure We Have It. Our pie charts Power Point Templates Offer You The Widest Possible Range Of Options.
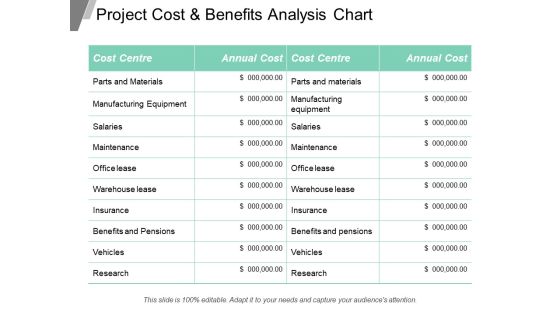
Project Cost And Benefits Analysis Chart Ppt Powerpoint Presentation Inspiration Slideshow
This is a balance scale with cost and benefits ppt powerpoint presentation show. This is a two stage process. The stages in this process are business, finance, marketing, strategy, compare, management.
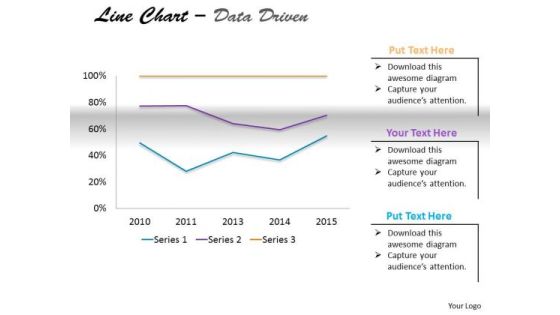
Multivariate Data Analysis Driven Market Line Chart PowerPoint Slides Templates
Delight Them With Our multivariate data analysis driven market line chart powerpoint slides Templates .
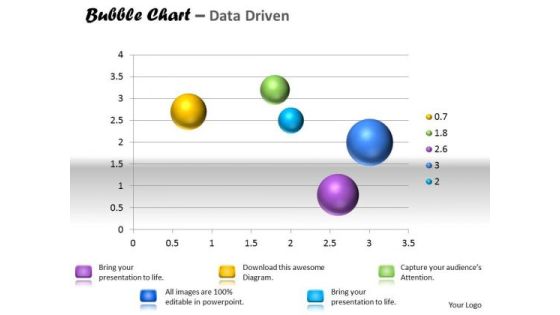
Data Analysis Template Interactive Bubble Chart PowerPoint Templates
Our data analysis template interactive bubble chart Powerpoint Templates Are A Wonder Drug. They Help Cure Almost Any Malaise.
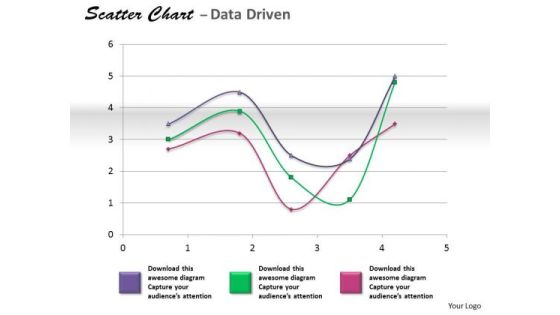
Financial Data Analysis Coordinate With Scatter Chart PowerPoint Templates
Get The Doers Into Action. Activate Them With Our financial data analysis coordinate with scatter chart Powerpoint Templates .

Data Analysis Programs 3d Bar Chart To Dispaly PowerPoint Templates
Lower The Drawbridge With Our data analysis programs 3d bar chart to dispaly Powerpoint Templates . Capture The Minds Of Your Audience.
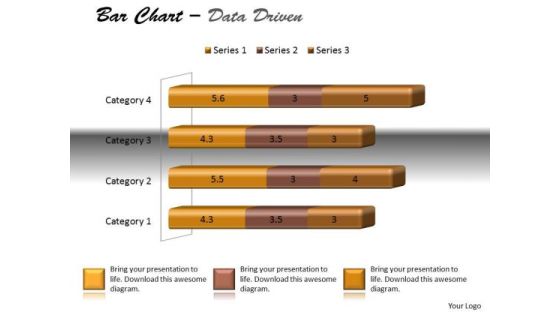
Data Analysis Techniques 3d Bar Chart For Modification PowerPoint Templates
Dreams Generate Thoughts, Thoughts Generate Ideas. Give Them Life With Our data analysis techniques 3d bar chart for modification Powerpoint Templates .
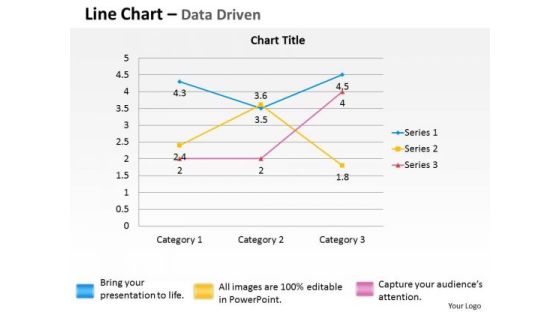
Quantitative Data Analysis Driven Economic Line Chart PowerPoint Slides Templates
Break The Deadlock With Our quantitative data analysis driven economic line chart powerpoint slides Templates . Let The Words Start To Flow.

Financial Data Analysis Currency Trading Bar Chart PowerPoint Templates
Put In A Dollop Of Our financial data analysis currency trading bar chart Powerpoint Templates . Give Your Thoughts A Distinctive Flavor.
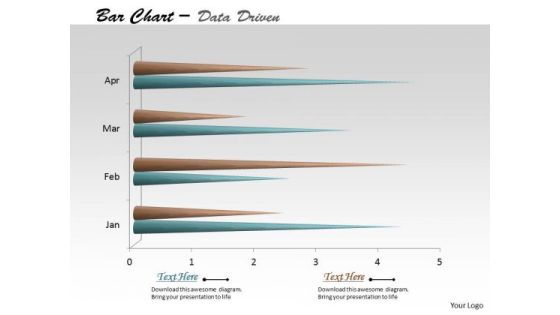
Multivariate Data Analysis Time Based Bar Chart PowerPoint Templates
Edit Your Work With Our multivariate data analysis time based bar chart Powerpoint Templates . They Will Help You Give The Final Form.

Multivariate Data Analysis Numeric Values Surface Chart PowerPoint Templates
Your Grasp Of Economics Is Well Known. Help Your Audience Comprehend Issues With Our multivariate data analysis numeric values surface chart Powerpoint Templates .

Competitive Analysis Template 6 Scatter Chart Ppt PowerPoint Presentation Slides
This is a competitive analysis template 6 scatter chart ppt powerpoint presentation slides. This is a eight stage process. The stages in this process are users interface, data import, example, pricing, support, update, tutorials, easy to use, table.

Competitive Analysis Template 7 Bubble Chart Ppt PowerPoint Presentation Deck
This is a competitive analysis template 7 bubble chart ppt powerpoint presentation deck. This is a six stage process. The stages in this process are users interface, data import, example, pricing, support, update, tutorials, easy to use, table.

Competitive Analysis Template 6 Scatter Chart Ppt PowerPoint Presentation Shapes
This is a competitive analysis template 6 scatter chart ppt powerpoint presentation shapes. This is a one stage process. The stages in this process are users interface, data import, example, pricing, support update, tutorials, easy to use.

Competitive Analysis Template 8 Matrix Chart Ppt PowerPoint Presentation Templates
This is a competitive analysis template 8 matrix chart ppt powerpoint presentation templates. This is a six stage process. The stages in this process are our business, product quality, product fidelity, after sales service, customer service, price, shipping speed, competitor.
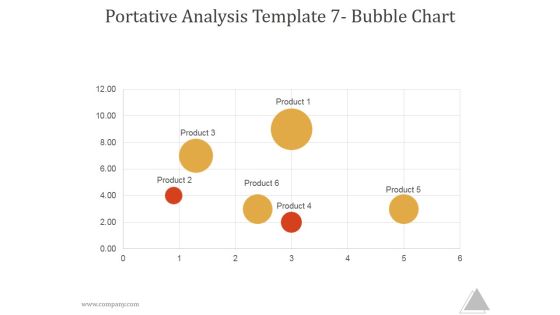
Portative Analysis Template 7 Bubble Chart Ppt PowerPoint Presentation Picture
This is a portative analysis template 7 bubble chart ppt powerpoint presentation picture. This is a six stage process. The stages in this process are product, business, marketing, management.
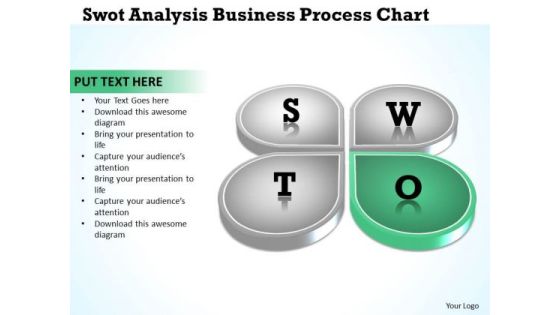
Business Logic Diagram Analysis PowerPoint Theme Process Chart Ppt Templates
We present our business logic diagram analysis powerpoint theme process chart ppt templates.Download and present our Business PowerPoint Templates because Our PowerPoint Templates and Slides are conceived by a dedicated team. Use them and give form to your wondrous ideas. Download and present our Shapes PowerPoint Templates because These PowerPoint Templates and Slides will give the updraft to your ideas. See them soar to great heights with ease. Use our Success PowerPoint Templates because You can Create a matrix with our PowerPoint Templates and Slides. Feel the strength of your ideas click into place. Download and present our Flow Charts PowerPoint Templates because You canTake a leap off the starting blocks with our PowerPoint Templates and Slides. They will put you ahead of the competition in quick time. Download and present our Process and Flows PowerPoint Templates because Our PowerPoint Templates and Slides will bullet point your ideas. See them fall into place one by one.Use these PowerPoint slides for presentations relating to Business, center, circle, circular, circulation, concept, control, cycle, development, diagram, direction, flow, graphic, green, idea, illustration, indicator, iterative, life, lifecycle, loop, management, method, mix, motion, movement, nature, pointer, process, propeller, quality, range, recycling, research, ring, rotation, round, schema, spectrum, spiral, step, strategy, success. The prominent colors used in the PowerPoint template are Green, Gray, White. People tell us our business logic diagram analysis powerpoint theme process chart ppt templates are designed by a team of presentation professionals. PowerPoint presentation experts tell us our circular PowerPoint templates and PPT Slides are designed by professionals Presenters tell us our business logic diagram analysis powerpoint theme process chart ppt templates are aesthetically designed to attract attention. We guarantee that they will grab all the eyeballs you need. Use our control PowerPoint templates and PPT Slides will impress their bosses and teams. Customers tell us our business logic diagram analysis powerpoint theme process chart ppt templates are designed by a team of presentation professionals. People tell us our circular PowerPoint templates and PPT Slides are aesthetically designed to attract attention. We guarantee that they will grab all the eyeballs you need.

Strategic Performance Analysis And Management Meeting Chart Portrait PDF
This slide demonstrates strategic review meetings chart for organisations to achieve higher level of performance management. This slide includes three types of performance review meetings such as enterprise and department strategy and enterprise strategy refresh. Pitch your topic with ease and precision using this Strategic Performance Analysis And Management Meeting Chart Portrait PDF. This layout presents information on Enterprise Strategy, Review Meeting, Department Strategy. It is also available for immediate download and adjustment. So, changes can be made in the color, design, graphics or any other component to create a unique layout.

Pie Chart On Magnifying Glass For Business Analysis PowerPoint Template
Visually support your presentation with our above template showing pie chart on magnifying glass. This slide has been professionally designed to emphasize the concept of market research and analysis. Deliver amazing presentations to mesmerize your audience.

Competitive Analysis Scatter Chart Radar Chart Ppt PowerPoint Presentation Portfolio Templates
This is a competitive analysis scatter chart radar chart ppt powerpoint presentation portfolio templates. This is a eight stage process. The stages in this process are users interface, data import, example, pricing, support.

Dashboard Showing Data Charts For Statistics Analysis Ppt PowerPoint Presentation Infographic Template Grid PDF
Pitch your topic with ease and precision using this dashboard showing data charts for statistics analysis ppt powerpoint presentation infographic template grid pdf. This layout presents information on dashboard showing data charts for statistics analysis. It is also available for immediate download and adjustment. So, changes can be made in the color, design, graphics or any other component to create a unique layout.

Business Sales Analysis Charts And Graphs Ppt PowerPoint Presentation File Deck PDF
Presenting business sales analysis charts and graphs ppt powerpoint presentation file deck pdf to dispense important information. This template comprises three stages. It also presents valuable insights into the topics including business sales analysis charts and graphs. This is a completely customizable PowerPoint theme that can be put to use immediately. So, download it and address the topic impactfully.

Competitors Analysis Charts Graphs To Display Data Company Profiles Ppt PowerPoint Presentation Outline Visual Aids
This is a competitors analysis charts graphs to display data company profiles ppt powerpoint presentation outline visual aids. This is a five stage process. The stages in this process are finance, analysis, business, investment, marketing.
Social Media Icons With Pie Charts For Marketing Analysis Ppt PowerPoint Presentation Ideas Example
This is a social media icons with pie charts for marketing analysis ppt powerpoint presentation ideas example. This is a six stage process. The stages in this process are kpi proposal, kpi plan, kpi scheme.
Pdca Slide For Best Charts For Technical Analysis Ppt PowerPoint Presentation Icon Backgrounds PDF
This is a pdca slide for best charts for technical analysis ppt powerpoint presentation icon backgrounds pdf template with various stages. Focus and dispense information on four stages using this creative set, that comes with editable features. It contains large content boxes to add your information on topics like pdca slide for best charts for technical analysis. You can also showcase facts, figures, and other relevant content using this PPT layout. Grab it now.

Business Diagram Four Colored Pie Charts For Result Analysis Data Driven PowerPoint Slide
This business diagram displays graphic of pie charts. This business slide is suitable to present and compare business data. Use this diagram to build professional presentations for your viewers.

Business Diagram Three Different Pie Charts For Result Analysis Presentation Template
Three different pie charts are used to designed this power point template slide. This PPT slide contains the concept of result analysis. Use this PPT slide for your data and process related presentations.
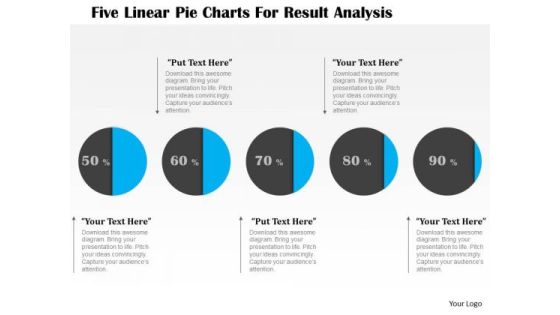
Business Diagram Five Linear Pie Charts For Result Analysis Presentation Template
This business diagram displays graphic of five staged process flow diagram. This PPT slide contains the concept of business data representation. Use this diagram to build professional presentation for your viewers.

Data Analysis Techniques 3d Grouped Bar Chart PowerPoint Templates
Place The Orders With Your Thoughts. Our data analysis techniques 3d grouped bar chart Powerpoint Templates Know The Drill.

Data Analysis Techniques 3d Effective Display Chart PowerPoint Templates
Dribble Away With Our data analysis techniques 3d effective display chart Powerpoint Templates . Score A Goal With Your Ideas.

Data Analysis Excel Business Tool Scatter Chart PowerPoint Templates
Dominate Proceedings With Your Ideas. Our data analysis excel business tool scatter chart Powerpoint Templates Will Empower Your Thoughts.
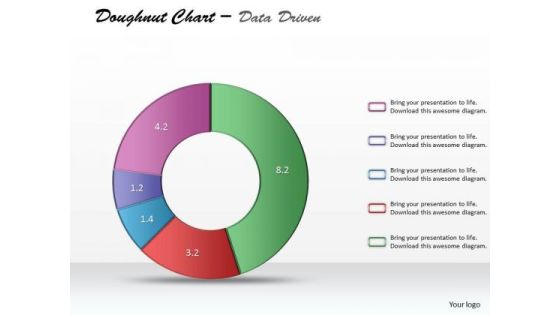
Data Analysis Excel Categorical Statistics Doughnut Chart PowerPoint Templates
Establish Your Dominion With Our data analysis excel categorical statistics doughnut chart Powerpoint Templates. Rule The Stage With Your Thoughts.
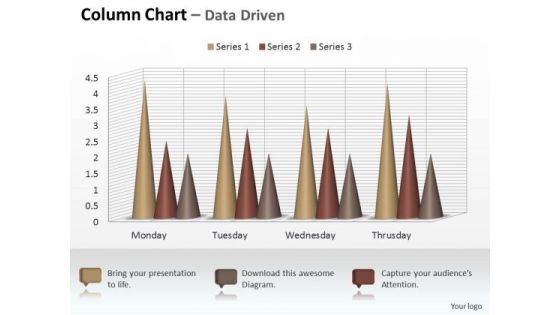
Marketing Data Analysis 3d Sets Of Column Chart PowerPoint Templates
Your Listeners Will Never Doodle. Our marketing data analysis 3d sets of column chart Powerpoint Templates Will Hold Their Concentration.
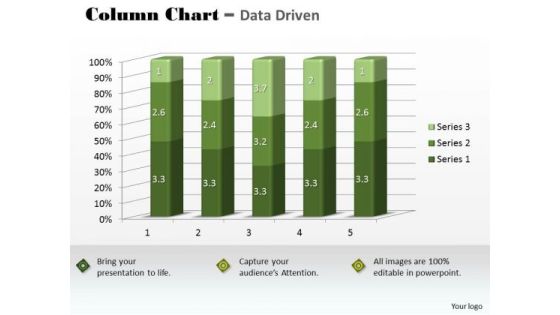
Marketing Data Analysis 3d Statistical Quality Control Chart PowerPoint Templates
Our marketing data analysis 3d statistical quality control chart Powerpoint Templates Abhor Doodling. They Never Let The Interest Flag.
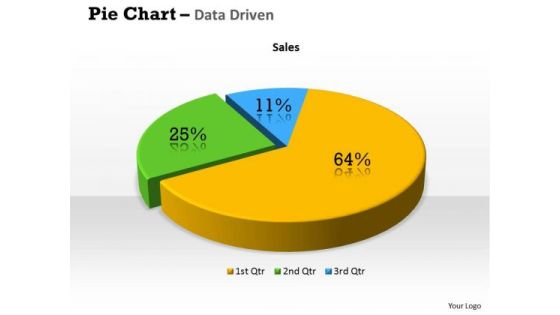
Quantitative Data Analysis 3d Percentage Ratio Pie Chart PowerPoint Templates
Plan Your Storyboard With Our quantitative data analysis 3d percentage ratio pie chart Powerpoint Templates . Give An Outline To The Solutions You Have.

 Home
Home