Chart Analysis
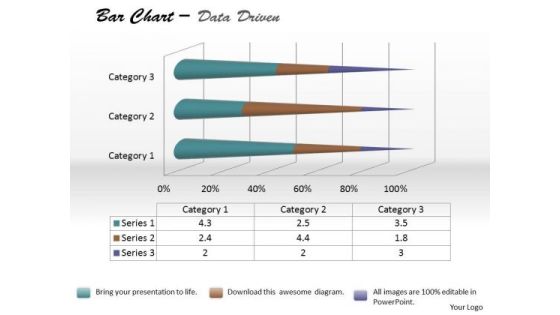
Data Analysis Bar Chart For Foreign Trade PowerPoint Templates
Be The Doer With Our data analysis bar chart for foreign trade Powerpoint Templates. Put Your Thoughts Into Practice.
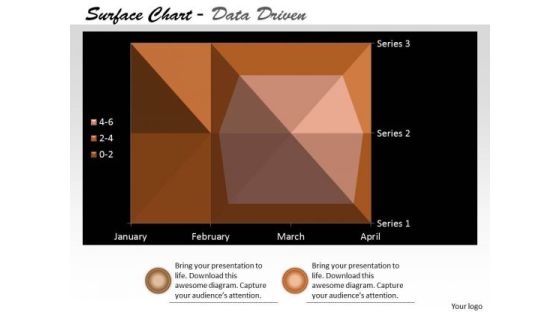
Multivariate Data Analysis Surface Chart Plots Trends PowerPoint Templates
Our multivariate data analysis surface chart plots trends Powerpoint Templates Heighten Concentration. Your Audience Will Be On The Edge.

Portative Analysis Bubble Chart Ppt PowerPoint Presentation Slide
This is a portative analysis bubble chart ppt powerpoint presentation slide. This is a six stage process. The stages in this process are portative, analysis, business, graph, bubble chart.

Quantitative Data Analysis Bar Chart For Different Categories PowerPoint Templates
Make Some Dough With Our quantitative data analysis bar chart for different categories Powerpoint Templates . Your Assets Will Rise Significantly.

Quantitative Data Analysis Bar Chart For Financial Markets PowerPoint Templates
Draft It Out On Our quantitative data analysis bar chart for financial markets Powerpoint Templates . Give The Final Touches With Your Ideas.
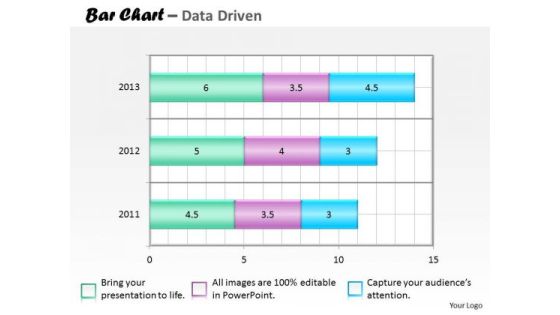
Financial Data Analysis Bar Chart For Collection Of PowerPoint Templates
Our financial data analysis bar chart for collection of Powerpoint Templates Team Are A Dogged Lot. They Keep At It Till They Get It Right.
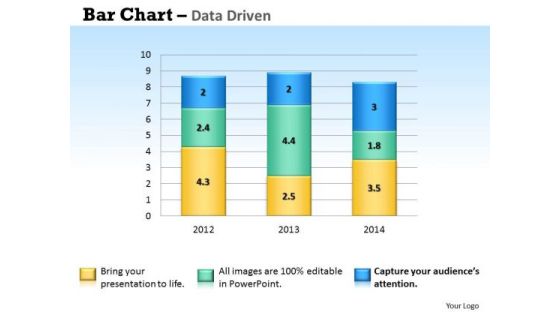
Microsoft Excel Data Analysis Bar Chart To Handle PowerPoint Templates
Our microsoft excel data analysis bar chart to handle Powerpoint Templates And Your Ideas Make A Great Doubles Pair. Play The Net With Assured Hands.
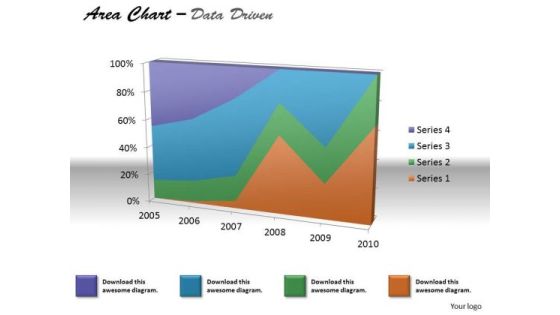
Financial Data Analysis Area Chart For Various Values PowerPoint Templates
Document The Process On Our financial data analysis area chart for various values Powerpoint Templates . Make A Record Of Every Detail.

Financial Data Analysis Area Chart For Showing Trends PowerPoint Templates
Document Your Views On Our financial data analysis area chart for showing trends Powerpoint Templates . They Will Create A Strong Impression.

Competitive Analysis Scatter Chart Ppt PowerPoint Presentation Samples
This is a competitive analysis scatter chart ppt powerpoint presentation samples. This is a six stage process. The stages in this process are competitive, analysis, business, marketing, management.
Pre And Post Report Analysis Bar Chart Icon Pictures PDF
Showcasing this set of slides titled Pre And Post Report Analysis Bar Chart Icon Pictures PDF. The topics addressed in these templates are Pre And Post Report Analysis, Bar Chart Icon. All the content presented in this PPT design is completely editable. Download it and make adjustments in color, background, font etc. as per your unique business setting.

Customer Analysis Percentage Chart Ppt PowerPoint Presentation Infographics Master Slide
This is a customer analysis percentage chart ppt powerpoint presentation infographics master slide. This is a four stage process. The stages in this process are comparison chart, comparison table, comparison matrix.

Competitive Analysis Bubble Chart Ppt PowerPoint Presentation Templates
This is a competitive analysis bubble chart ppt powerpoint presentation templates. This is a six stage process. The stages in this process are product, business, management, marketing, strategy.

Competitive Analysis Scatter Chart Ppt PowerPoint Presentation Background Designs
This is a competitive analysis scatter chart ppt powerpoint presentation background designs. This is a three stage process. The stages in this process are competitive analysis, business, management, marketing, strategy.

Data Collection And Analysis Control Chart Ppt PowerPoint Presentation Visuals
This is a data collection and analysis control chart ppt powerpoint presentation visuals. This is a ten stage process. The stages in this process are upper limit, centerline, lower limit, plotted points.

Competitive Analysis Matrix Chart Ppt PowerPoint Presentation Gallery
This is a competitive analysis matrix chart ppt powerpoint presentation gallery. This is a seven stage process. The stages in this process are our business, product quality, product fidelity, after sales service, customer service, price, shipping speed.
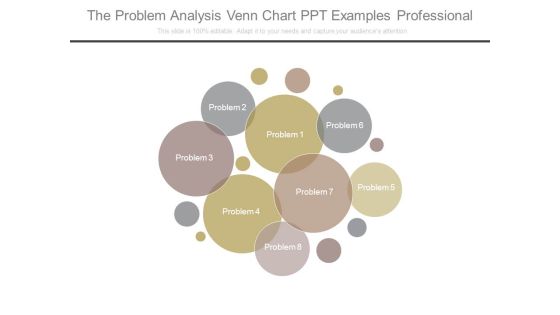
The Problem Analysis Venn Chart Ppt Examples Professional
This is a the problem analysis venn chart ppt examples professional. This is a eight stage process. The stages in this process are business, analysis, marketing, process, strategy.

data collection and analysis control chart ppt powerpoint presentation styles
This is a data collection and analysis control chart ppt powerpoint presentation styles. This is a one stage process. The stages in this process are upper limit, centerline, plotted points, lower limit, point labels.

Competitive Analysis Matrix Chart Ppt PowerPoint Presentation Inspiration
This is a competitive analysis matrix chart ppt powerpoint presentation inspiration. This is a six stage process. The stages in this process are product quality, product fidelity, after sales service, customer service, price, shipping speed.
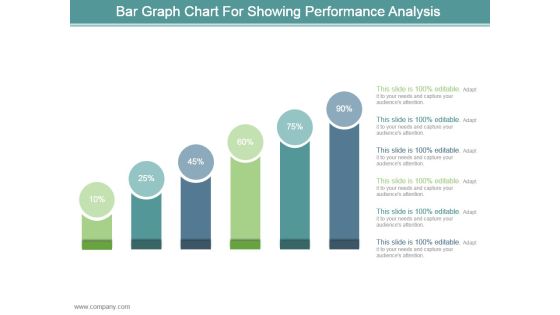
Bar Graph Chart For Showing Performance Analysis Ppt Design
This is a bar graph chart for showing performance analysis ppt design. This is a six stage process. The stages in this process are business, marketing, process, success, presentation.

data collection and analysis flow chart ppt powerpoint presentation microsoft
This is a data collection and analysis flow chart ppt powerpoint presentation microsoft. This is a nine stage process. The stages in this process are business, planning, marketing, strategy, management.
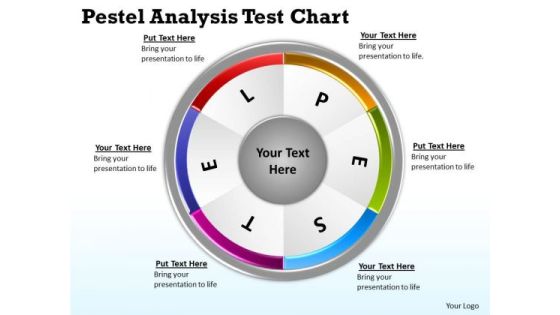
Mba Models And Frameworks Pestel Analysis Test Chart Business Diagram
Double Your Chances With Our Mba Models And Frameworks Pestel Analysis Test Chart Business Diagram Powerpoint Templates. The Value Of Your Thoughts Will Increase Two-Fold.
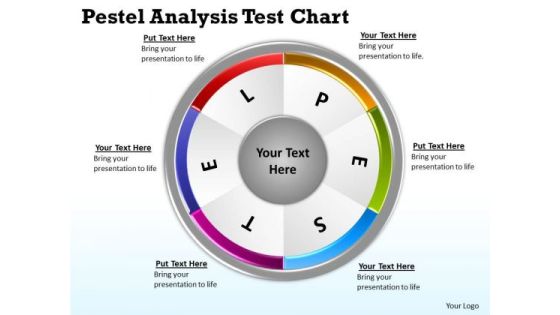
Marketing Diagram Pestel Analysis Test Chart Strategic Management
Deliver The Right Dose With Our Marketing Diagram Pestel Analysis Test Chart Strategic Management Powerpoint Templates. Your Ideas Will Get The Correct Illumination.
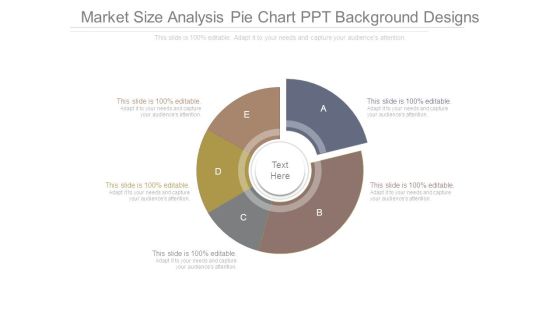
Market Size Analysis Pie Chart Ppt Background Designs
This is a market size analysis pie chart ppt background designs. This is a five stage process. The stages in this process are donut, business, marketing, process.

Overall Revenue Analysis Bar Chart Powerpoint Slide Information
This is a overall revenue analysis bar chart powerpoint slide information. This is a nine stage process. The stages in this process are finance, success, business, marketing, percentage.
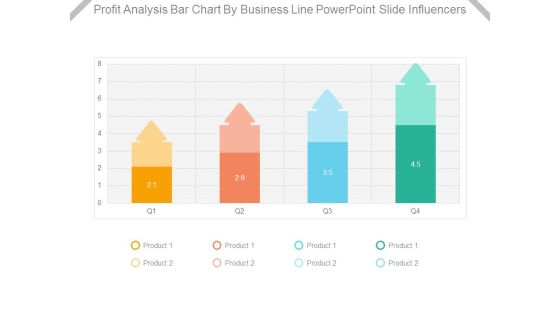
Profit Analysis Bar Chart By Business Line Powerpoint Slide Influencers
This is a profit analysis bar chart by business line powerpoint slide influencers. This is a four stage process. The stages in this process are product.

Comparison Chart For Strategic Planning Analysis Ppt PowerPoint Presentation Example
This is a comparison chart for strategic planning analysis ppt powerpoint presentation example. This is a two stage process. The stages in this process are business, finance, marketing, strategy, success.

Employee Quarter Wise Performance Analysis Bar Chart Icon Guidelines PDF
Presenting Employee Quarter Wise Performance Analysis Bar Chart Icon Guidelines PDF to dispense important information. This template comprises four stages. It also presents valuable insights into the topics including Employee Quarter Wise, Performance Analysis, Bar Chart Icon. This is a completely customizable PowerPoint theme that can be put to use immediately. So, download it and address the topic impactfully.

Data Collection And Analysis Flow Chart Ppt PowerPoint Presentation Sample
This is a data collection and analysis flow chart ppt powerpoint presentation sample. This is a five stage process. The stages in this process are business, strategy, marketing, process, growth strategy, finance.

Competitive Analysis Scatter Chart Template 1 Ppt PowerPoint Presentation Themes
This is a competitive analysis scatter chart template 1 ppt powerpoint presentation themes. This is a six stage process. The stages in this process are business, strategy, marketing, success, analysis.

Competitive Analysis Scatter Chart Ppt PowerPoint Presentation Layouts Layout
This is a competitive analysis scatter chart ppt powerpoint presentation layouts layout. This is a six stage process. The stages in this process are business, marketing, success, chart, management.
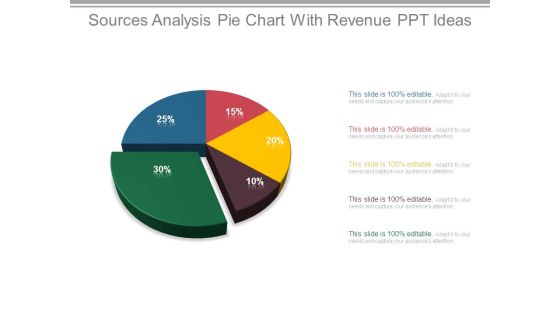
Sources Analysis Pie Chart With Revenue Ppt Ideas
This is a sources analysis pie chart with revenue ppt ideas. This is a five stage process. The stages in this process are finance, success, business, marketing, percentage, pie chart.

Internet Security Threat Analysis Report Chart Introduction PDF
Following slide exhibits security and data breach report chart it includes major statistics such as- loss or theft of data, failure to redirect data and data posting to incorrect recipient. Pitch your topic with ease and precision using this internet security threat analysis report chart introduction pdf. This layout presents information on internet security threat analysis report chart. It is also available for immediate download and adjustment. So, changes can be made in the color, design, graphics or any other component to create a unique layout.

Gross Margin Analysis Bar Chart Powerpoint Slide Backgrounds
This is a gross margin analysis bar chart powerpoint slide backgrounds. This is a two stage process. The stages in this process are bar graph, business, marketing, growth, success.
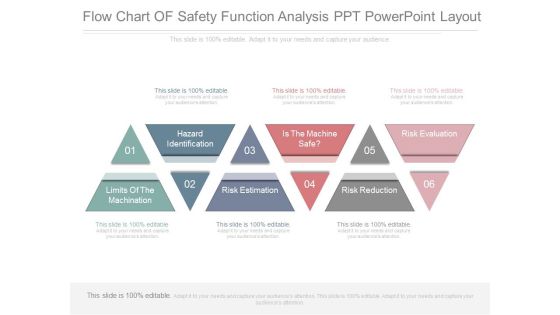
Flow Chart Of Safety Function Analysis Ppt Powerpoint Layout
This is a flow chart of safety function analysis ppt powerpoint layout. This is a six stage process. The stages in this process are hazard identification, limits of the machination, risk estimation, is the machine safe, risk reduction, risk evaluation.

Venn Chart For Process Collaboration Analysis Ppt PowerPoint Presentation Summary
This is a venn chart for process collaboration analysis ppt powerpoint presentation summary. This is a three stage process. The stages in this process are venn, business, marketing, success, management.
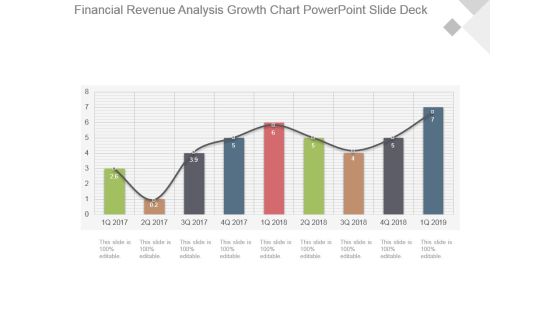
Financial Revenue Analysis Growth Chart Powerpoint Slide Deck
This is a financial revenue analysis growth chart powerpoint slide deck. This is a nine stage process. The stages in this process are growth, success, business, marketing, bar graph.

Competitive Analysis Scatter Chart Template 2 Ppt PowerPoint Presentation Files
This is a competitive analysis scatter chart template 2 ppt powerpoint presentation files. This is a nine stage process. The stages in this process are users interface, data import, example, pricing, support, update.

Competitive Analysis Matrix Chart Ppt PowerPoint Presentation Portfolio Format Ideas
This is a competitive analysis matrix chart ppt powerpoint presentation portfolio format ideas. This is a six stage process. The stages in this process are our business, product quality, product fidelity, after sales service, customer service.

Competitive Analysis Bubble Chart Ppt PowerPoint Presentation Pictures Mockup
This is a competitive analysis bubble chart ppt powerpoint presentation pictures mockup. This is a six stage process. The stages in this process are product, table, business, marketing, management.
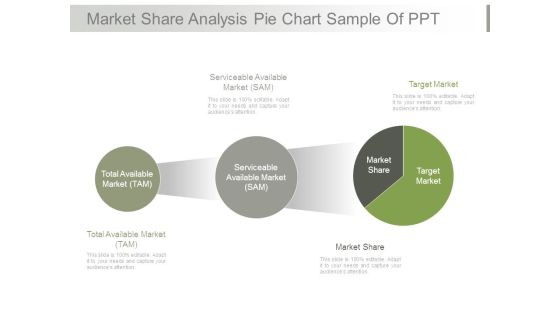
Market Share Analysis Pie Chart Sample Of Ppt
This is a market share analysis pie chart sample of ppt. This is a three stage process. The stages in this process are serviceable available market sam, target market, total available market tam, market share.

Kano Analysis Line Chart Powerpoint Slide Design Ideas
This is a kano analysis line chart powerpoint slide design ideas. This is a three stage process. The stages in this process are customer needs in the kano model, exciter, performance, basic, implementation level.

Financial Reporting And Analysis Pie Chart Ppt PowerPoint Presentation Guidelines
This is a financial reporting and analysis pie chart ppt powerpoint presentation guidelines. This is a four stage process. The stages in this process are process, percentage, business, marketing, finance.

Competitive Analysis Bubble Chart Template 1 Ppt PowerPoint Presentation Influencers
This is a competitive analysis bubble chart template 1 ppt powerpoint presentation influencers. This is a six stage process. The stages in this process are business, strategy, marketing, success, process.

Competitive Analysis Matrix Chart Template 1 Ppt PowerPoint Presentation Deck
This is a competitive analysis matrix chart template 1 ppt powerpoint presentation deck. This is a six stage process. The stages in this process are product quality, product fidelity, after sales service, customer service, shipping speed.
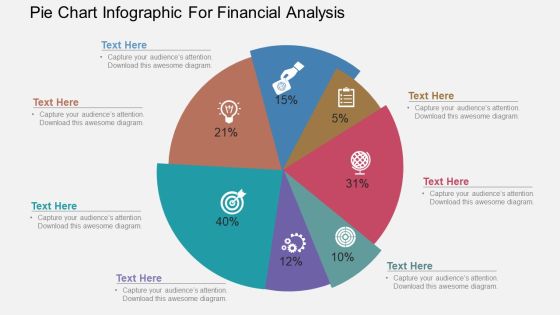
Pie Chart Infographic For Financial Analysis Powerpoint Template
Our above PowerPoint template has been designed with pie chart infographic. This slide is suitable to present financial analysis. Use this business diagram to present your work in a more smart and precise manner.

Travel And Leisure Industry Analysis Bar Chart Template PDF
Presenting this set of slides with name travel and leisure industry analysis bar chart template pdf. The topics discussed in these slide is bar chart. This is a completely editable PowerPoint presentation and is available for immediate download. Download now and impress your audience.

Variance Analysis Line Chart Ppt PowerPoint Presentation Styles Graphics Example
Presenting this set of slides with name variance analysis line chart ppt powerpoint presentation styles graphics example. The topics discussed in these slides are revenue trend, bar chart, financial. This is a completely editable PowerPoint presentation and is available for immediate download. Download now and impress your audience.

Pie Chart For Financial Ratio Analysis PowerPoint Templates
Create visually amazing presentations with this slide of pie chart. This PPT slide of pie chart for financial ratio analysis. Add this diagram in your presentations to visually support your content.

Pie Chart For Financial Ratio Analysis PowerPoint Template
Deliver amazing presentations with our above template showing pie chart. You may download this slide to display financial ratio analysis. Capture the attention of your audience using this diagram.

Pie Gear Chart For Financial Ratio Analysis Powerpoint Templates
This PPT slide displays diagram of pie gear chart. This PowerPoint template has been designed to exhibit financial ratio analysis. You can present your opinions using this impressive slide

Brand Specifications Comparative Analysis Ratings Chart Demonstration PDF
This slide illustrates the performance review ratings of mobile brands. It includes technology, quality, user interface and experience as main criteria.Showcasing this set of slides titled Brand Specifications Comparative Analysis Ratings Chart Demonstration PDF. The topics addressed in these templates are Technology, Quality, Experience. All the content presented in this PPT design is completely editable. Download it and make adjustments in color, background, font etc. as per your unique business setting

Competitive Analysis Comparison Chart Ppt Infographic Template Guide PDF
This slide provides the glimpse about the problem faced by the users since email is used for personal use which leads to problems such as no collaboration, poor productivity, and regular errors. Deliver and pitch your topic in the best possible manner with this competitive analysis comparison chart ppt infographic template guide pdf. Use them to share invaluable insights on e commerce, average, email, pricing and impress your audience. This template can be altered and modified as per your expectations. So, grab it now.
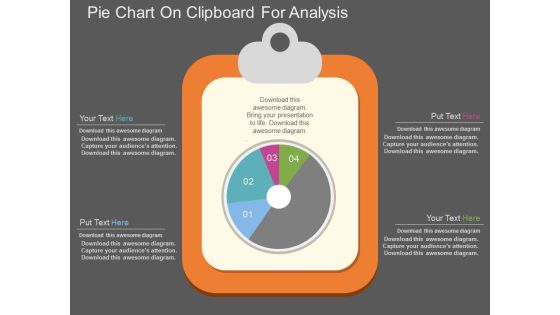
Pie Chart On Clipboard For Analysis Powerpoint Template
This PowerPoint template has been designed with graphics of pie chart on clipboard. Download this PPT slide for business and financial analysis. You may also use this professional template to depict statistical analysis.

Pie Chart For Financial Ratio Analysis Powerpoint Slides
This PPT slide contains graphics of eight stage pie chart. Download this PowerPoint template slide for financial ratio analysis. This diagram is editable you can edit text, color, shade and style as per you need.
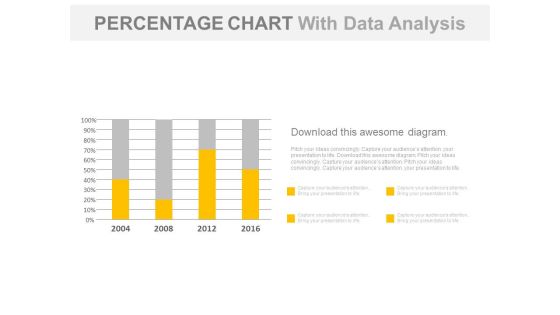
Year Based Chart With Percentage Data Analysis Powerpoint Slides
Our above business slide contains year based statistical chart. This PowerPoint template can be used to display percentage data analysis. Capture the attention of your audience with this slide.

Three Teams Skill Analysis Comparison Chart Powerpoint Slides
Create visually stunning and define your PPT presentations in a unique and inspiring manner using our above template. It contains graphics of comparison chart. This business slide helps to display teams skill analysis. Deliver amazing presentations to mesmerize your audience by using this PPT slide design.
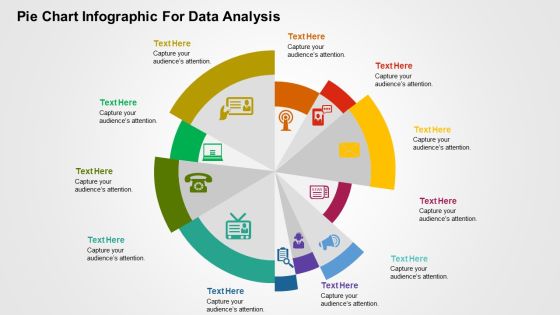
Pie Chart Infographic For Data Analysis PowerPoint Templates
This is one of the most downloaded PowerPoint template. This slide can be used for various purposes and to explain a number of processes. This can be included in your presentation to explain each step of a process and even include its relevance and importance in a single diagram. Using the uneven circular structure of the pie chart, the presenter can also explain random steps or highlight particular steps of process or parts of an organization or business that need special attention of any kind to the audience. Additionally, you can use this slide to show a transformation process or highlight key features of a product.
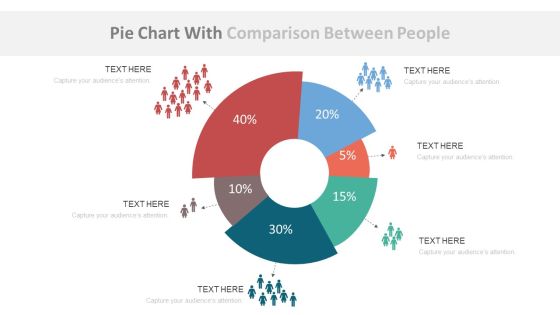
Pie Chart With Population Ratio Analysis Powerpoint Slides
This dashboard template contains graphics of pie chart with icons. This dashboard PowerPoint template helps to display population ratio analysis in a visual manner. Download this template to make impressive presentations.

Circle Chart With Percentage Value Analysis Powerpoint Slides
This PowerPoint template has been designed with circular process diagram. This business diagram helps to exhibit financial process control and analysis. Use this diagram to visually support your content.
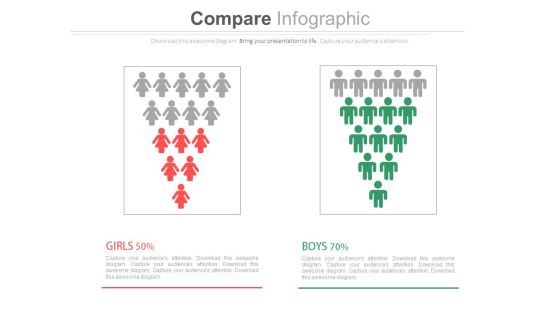
Male Female Gender Ratio Analysis Comparison Chart Powerpoint Slides
This PowerPoint template has been designed with graphics of male and female icons. Download this PPT slide to depict gender ratio analysis. Grab the attention of your team with this eye catching template.
Financial Charts Data Analysis Vector Icon Ppt PowerPoint Presentation Visual Aids Summary Cpb
This is a financial charts data analysis vector icon ppt powerpoint presentation visual aids summary cpb. This is a three stage process. The stages in this process are data analysis, analytics architecture, analytics framework.

Competitor Analysis Framework And Future Threat Analysis Chart Ppt PowerPoint Presentation Inspiration Introduction PDF
Pitch your topic with ease and precision using this competitor analysis framework and future threat analysis chart ppt powerpoint presentation inspiration introduction pdf. This layout presents information on market position, innovation ability, business strategy. It is also available for immediate download and adjustment. So, changes can be made in the color, design, graphics or any other component to create a unique layout.
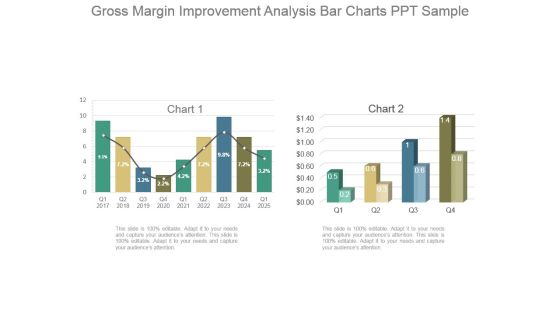
Gross Margin Improvement Analysis Bar Charts Ppt Sample
This is a gross margin improvement analysis bar charts ppt sample. This is a two stage process. The stages in this process are chart.

Business Expenditure Analysis Pie Charts Ppt Infographic Template
This is a business expenditure analysis pie charts ppt infographic template. This is a three stage process. The stages in this process are pie, business, marketing, finance, success.

Charts Representing Business Data Analysis Icon Introduction PDF
Presenting charts representing business data analysis icon introduction pdf. to dispense important information. This template comprises three stages. It also presents valuable insights into the topics including charts representing business data analysis icon. This is a completely customizable PowerPoint theme that can be put to use immediately. So, download it and address the topic impactfully.

Charts Vector For Statistical Analysis Ppt PowerPoint Presentation Layouts Professional
Presenting this set of slides with name charts vector for statistical analysis ppt powerpoint presentation layouts professional. The topics discussed in these slides are data icon, status icon, status symbol icon. This is a completely editable PowerPoint presentation and is available for immediate download. Download now and impress your audience.

Market Size Analysis Pie Charts Ppt Background Images
This is a market size analysis pie charts ppt background images. This is a three stage process. The stages in this process are in team of users, in team of revenue from customers, target market, we are planning to acquire users first and then paid customer, advertisers, event organizers, mentors.

3d Two Stages Of Process Analysis Flow Charting PowerPoint Slides
We present our 3d two stages of process analysis flow charting PowerPoint Slides.Download our Business PowerPoint Templates because like the famed William Tell, they put aside all emotions and concentrate on the target. Use our Competition PowerPoint Templates because it has inspired a whole new world of medical endeavour. Present our Marketing PowerPoint Templates because networking is an imperative in todays world. You need to access the views of others. Similarly you need to give access to them of your abilities. Present our Design PowerPoint Templates because Our Template designs are State of the Art. Download our Metaphor PowerPoint Templates because you can asked to strive to give true form to your great dream.Use these PowerPoint slides for presentations relating to analysis, analyze, background, business, chart, competition, conceptual, corporation, create, data, decision, design, direction, economic, enterprise, future, graph, idea, illustration, information, innovate, layout, management, marketing, paper, plan, process, product, project, science, social, . The prominent colors used in the PowerPoint template are Blue, Gray, Black. Professionals tell us our 3d two stages of process analysis flow charting PowerPoint Slides are designed by professionals The feedback we get is that our create PowerPoint templates and PPT Slides are Elegant. We assure you our 3d two stages of process analysis flow charting PowerPoint Slides are Dazzling. Customers tell us our corporation PowerPoint templates and PPT Slides provide you with a vast range of viable options. Select the appropriate ones and just fill in your text. Presenters tell us our 3d two stages of process analysis flow charting PowerPoint Slides will impress their bosses and teams. People tell us our corporation PowerPoint templates and PPT Slides are Attractive.

Pie Charts For Percentage Value Analysis Powerpoint Slides
Our above PPT slide displays graphics of Pie charts. This PowerPoint template may be used to display percentage value analysis. Download this template to leave permanent impression on your audience.

Pie Charts For Financial Ratio Analysis Powerpoint Slides
This PowerPoint template has been designed with diagram of pie charts. This PPT slide can be used to prepare presentations for profit growth report and also for financial data analysis. You can download finance PowerPoint template to prepare awesome presentations.
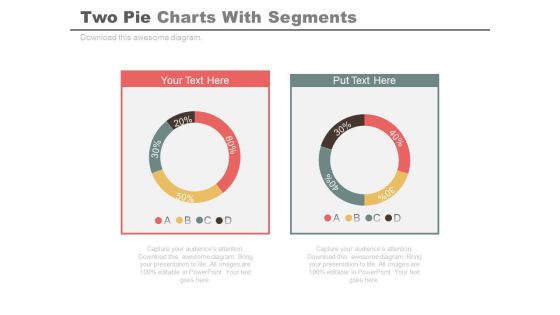
Two Pie Charts For Comparison And Analysis Powerpoint Slides
Develop competitive advantage with our above template of two pie charts. This PowerPoint diagram provides an effective way of displaying business information. You can edit text, color, shade and style as per you need.

Data Analysis Excel Bubble Chart For Business Tasks PowerPoint Templates
Doll Up Your Thoughts With Our data analysis excel bubble chart for business tasks Powerpoint Templates. They Will Make A Pretty Picture.

Corporate Vulnerability Analysis Process Flow Chart Summary PDF
This slide showcases the enterprise vulnerability management process flow chart. It also includes stages such as information gathering, questionnaire, vendor response, risk management, remediation and validation. Pitch your topic with ease and precision using this Corporate Vulnerability Analysis Process Flow Chart Summary PDF. This layout presents information on Vender Response, Risk Assessment, Information Gathering. It is also available for immediate download and adjustment. So, changes can be made in the color, design, graphics or any other component to create a unique layout.
Environmental Analysis Icon With Chart And Magnifying Glass Introduction PDF
Persuade your audience using this Environmental Analysis Icon With Chart And Magnifying Glass Introduction PDF. This PPT design covers five stages, thus making it a great tool to use. It also caters to a variety of topics including Environmental Analysis Icon With Chart And Magnifying Glass. Download this PPT design now to present a convincing pitch that not only emphasizes the topic but also showcases your presentation skills.

Tactical Analysis Management Organizational Chart Ppt Styles Slide Portrait PDF
Deliver an awe inspiring pitch with this creative tactical analysis management organizational chart ppt styles slide portrait pdf bundle. Topics like business development, marketing communication, employee can be discussed with this completely editable template. It is available for immediate download depending on the needs and requirements of the user.
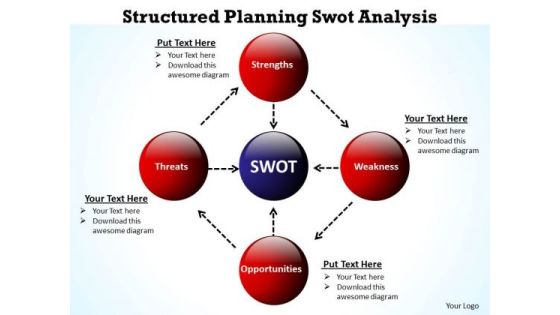
Business Organizational Chart Template Structured Planning Swot Analysis PowerPoint Slides
We present our business organizational chart template structured planning swot analysis PowerPoint Slides.Use our Circle Charts PowerPoint Templates because Our PowerPoint Templates and Slides are effectively colour coded to prioritise your plans They automatically highlight the sequence of events you desire. Download our Ring Charts PowerPoint Templates because Our PowerPoint Templates and Slides are created with admirable insight. Use them and give your group a sense of your logical mind. Download and present our Business PowerPoint Templates because Your ideas provide food for thought. Our PowerPoint Templates and Slides will help you create a dish to tickle the most discerning palate. Present our Flow Charts PowerPoint Templates because Our PowerPoint Templates and Slides are truly out of this world. Even the MIB duo has been keeping tabs on our team. Present our Process and Flows PowerPoint Templates because Our PowerPoint Templates and Slides are a sure bet. Gauranteed to win against all odds. Use these PowerPoint slides for presentations relating to Business, buy, clipart, commerce, concept, conceptual, consumer, customer, cycle, design, development, diagram, direction, guidelines, icon, illustration, know, life, lifecycle, like, manage, management, market, marketing, mix, model, optimize, organization, performance, process, refer, repeat, resource, sales, selling, stages. The prominent colors used in the PowerPoint template are Red, Blue navy, Black. People tell us our business organizational chart template structured planning swot analysis PowerPoint Slides are designed by a team of presentation professionals. PowerPoint presentation experts tell us our conceptual PowerPoint templates and PPT Slides will generate and maintain the level of interest you desire. They will create the impression you want to imprint on your audience. Presenters tell us our business organizational chart template structured planning swot analysis PowerPoint Slides are designed by professionals Use our cycle PowerPoint templates and PPT Slides are aesthetically designed to attract attention. We guarantee that they will grab all the eyeballs you need. Customers tell us our business organizational chart template structured planning swot analysis PowerPoint Slides will make the presenter look like a pro even if they are not computer savvy. People tell us our concept PowerPoint templates and PPT Slides will get their audience's attention.
Pie Chart With Icons For Business Analysis Powerpoint Slides
This dashboard template contains graphics of pie chart with icons. This dashboard PowerPoint template helps to display business analysis in a visual manner. Download this template to make impressive presentations.

Cyber Computing Services Risk Analysis Software Status Chart Portrait PDF
This slide illustrates different digitally enabled cyber computing applications. It includes risk severity chart, action cost along with risk owner details and implementation due date. Showcasing this set of slides titled Cyber Computing Services Risk Analysis Software Status Chart Portrait PDF. The topics addressed in these templates are Risk Treatment, Risk Owner, Implementation. All the content presented in this PPT design is completely editable. Download it and make adjustments in color, background, font etc. as per your unique business setting.
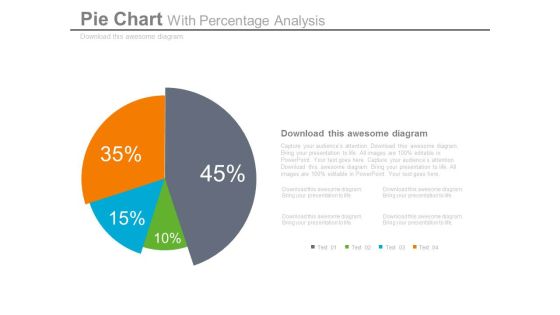
Pie Chart Dashboard Style For Percentage Analysis Powerpoint Slides
This dashboard PPT template contains graphics of pie chart. This dashboard PowerPoint template helps to display percentage analysis in a visual manner. Download this PPT slide for quick decision-making.
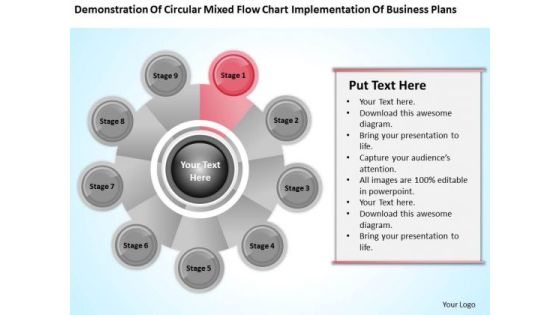
Business Analysis Diagrams Flow Chart Implementation Plans PowerPoint Templates
We present our business analysis diagrams flow chart implementation plans PowerPoint templates.Present our Business PowerPoint Templates because It will get your audience in sync. Download our Circle Charts PowerPoint Templates because Your ideas provide food for thought. Our PowerPoint Templates and Slides will help you create a dish to tickle the most discerning palate. Present our Shapes PowerPoint Templates because our PowerPoint Templates and Slides will give your ideas the shape. Download our Process and Flows PowerPoint Templates because Our PowerPoint Templates and Slides has conjured up a web of all you need with the help of our great team. Use them to string together your glistening ideas. Present our Leadership PowerPoint Templates because Watching this your Audience will Grab their eyeballs, they wont even blink.Use these PowerPoint slides for presentations relating to project, flow, process, business, system, success, chart, work, innovation, implementation, plan, concept, evaluation, presentation, symbol, internet, diagram, analysis, flowchart, analyzing, technology, idea, development, management, steps, strategy, addie, design, outcome, assessment, structure. The prominent colors used in the PowerPoint template are Red, Gray, White.
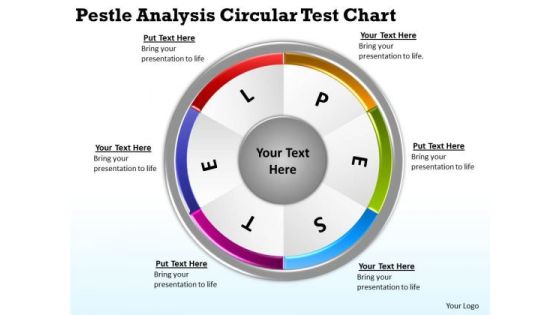
Pestle Analysis Circular Test Chart Forma Business Plan PowerPoint Templates
We present our pestle analysis circular test chart forma business plan PowerPoint templates.Download and present our Ring Charts PowerPoint Templates because Our PowerPoint Templates and Slides offer you the needful to organise your thoughts. Use them to list out your views in a logical sequence. Use our Flow Charts PowerPoint Templates because It will Raise the bar of your Thoughts. They are programmed to take you to the next level. Download our Process and Flows PowerPoint Templates because Our PowerPoint Templates and Slides are innately eco-friendly. Their high recall value negate the need for paper handouts. Download and present our Success PowerPoint Templates because Our PowerPoint Templates and Slides will bullet point your ideas. See them fall into place one by one. Download our Shapes PowerPoint Templates because You can Double your output with our PowerPoint Templates and Slides. They make beating deadlines a piece of cake.Use these PowerPoint slides for presentations relating to Arrow, vector, website, speech, form, green, special, corporate, order, red, business, concept, bright, symbol, circle, match, usable, graphic, process,element, different, idea, shape, abstract, cycle, creative, illustration, piece, connection, chart, strategy, place, frame, web, solution, design, group, color, colorful,blue, text, pestle, access, part, conceptual. The prominent colors used in the PowerPoint template are Green, Red, Pink.
Five Mountain Chart With Icons For Financial Analysis Powerpoint Slides
Our above PPT slide contains five mountains with icons and financial values. This PowerPoint template helps to exhibit financial analysis for business growth. Use this diagram to impart more clarity to subject and to create more sound impact on viewers.
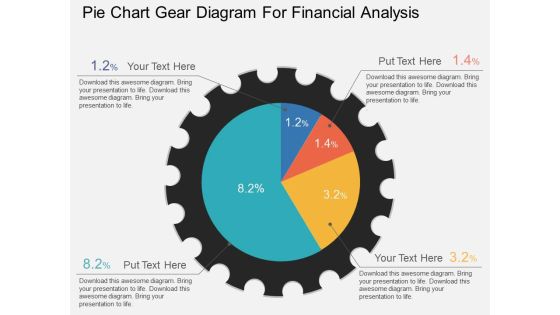
Pie Chart Gear Diagram For Financial Analysis Powerpoint Template
This PowerPoint template has been designed with graphic of pie chart gear diagram. This PPT slide can be used to display financial analysis. Download this PPT diagram slide to make your presentations more effective.

Puzzle Pie Chart With Team For Financial Analysis Powerpoint Slides
This PPT slide contains graphics of puzzle pie chart with team icons. You may use this PowerPoint template to display team strategy and success. Download this professional slide design to deliver amazing presentations.
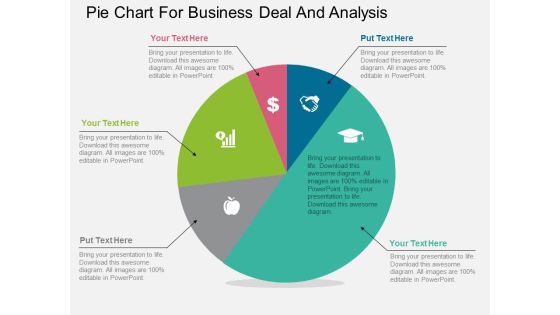
Pie Chart For Business Deal And Analysis Powerpoint Template
Our above PPT slide contains diagram of pentagon infographic. It helps to display steps of corporate marketing. Use this diagram to impart more clarity to data and to create more sound impact on viewers.
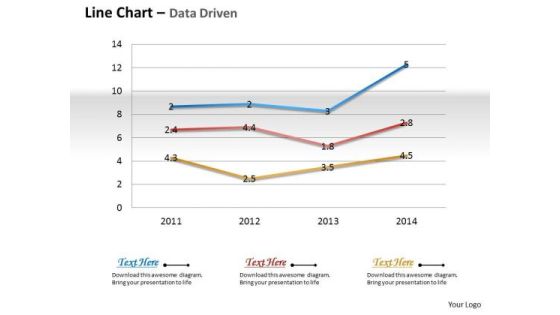
Business Data Analysis Chart Shows Changes Over The Time PowerPoint Templates
Document The Process On Our business data analysis chart shows changes over the time Powerpoint Templates. Make A Record Of Every Detail.
Pie Chart For Revenue Analysis Vector Icon Ppt Outline Slides PDF
Presenting Pie Chart For Revenue Analysis Vector Icon Ppt Outline Slides PDF to dispense important information. This template comprises three stages. It also presents valuable insights into the topics including pie chart for revenue analysis vector icon. This is a completely customizable PowerPoint theme that can be put to use immediately. So, download it and address the topic impactfully.
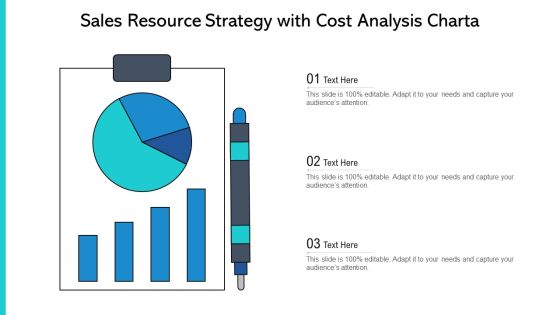
Sales Resource Strategy With Cost Analysis Chart Ppt Summary Objects PDF
Presenting sales resource strategy with cost analysis chart ppt summary objects pdf to dispense important information. This template comprises three stages. It also presents valuable insights into the topics including sales resource strategy with cost analysis chart. This is a completely customizable PowerPoint theme that can be put to use immediately. So, download it and address the topic impactfully.

Quantitative Bar Chart For Data Analysis Ppt PowerPoint Presentation Model Graphic Tips
This is a quantitative bar chart for data analysis ppt powerpoint presentation model graphic tips. This is a two stage process. The stages in this process are financial analysis, quantitative, statistical modelling.

Data Analysis Chart For Funds Management Ppt PowerPoint Presentation Infographic Template Files
This is a data analysis chart for funds management ppt powerpoint presentation infographic template files. This is a five stage process. The stages in this process are financial analysis, quantitative, statistical modelling.

Clients Existing Website Traffic Assessment SEO Audit Report Analysis Chart Of The Company Brochure PDF
The slide shows an SEO audit report analysis chart with details such as SEO factor, factor description, current factor status and action plan that needs to be implemented.Deliver an awe inspiring pitch with this creative Clients Existing Website Traffic Assessment SEO Audit Report Analysis Chart Of The Company Brochure PDF bundle. Topics like Current Status, Image Descriptions, Standard can be discussed with this completely editable template. It is available for immediate download depending on the needs and requirements of the user.

Bar Graph And Line Chart For Comparative Analysis Icon Ppt PowerPoint Presentation Gallery Infographics PDF
Showcasing this set of slides titled bar graph and line chart for comparative analysis icon ppt powerpoint presentation gallery infographics pdf. The topics addressed in these templates are bar graph and line chart for comparative analysis icon. All the content presented in this PPT design is completely editable. Download it and make adjustments in color, background, font etc. as per your unique business setting.

Business Bar Chart With Percentage Analysis Ppt PowerPoint Presentation File Outline PDF
Presenting this set of slides with name business bar chart with percentage analysis ppt powerpoint presentation file outline pdf. The topics discussed in these slide is business bar chart with percentage analysis. This is a completely editable PowerPoint presentation and is available for immediate download. Download now and impress your audience.

Annual Two Product Performance Analysis Chart Ppt PowerPoint Presentation Icon Design Templates PDF
Pitch your topic with ease and precision using this annual two product performance analysis chart ppt powerpoint presentation icon design templates pdf. This layout presents information on annual, two product performance, analysis chart. It is also available for immediate download and adjustment. So, changes can be made in the color, design, graphics or any other component to create a unique layout.

ABC Analysis Chart Of Product Costs Ppt PowerPoint Presentation Icon Information PDF
Showcasing this set of slides titled abc analysis chart of product costs ppt powerpoint presentation icon information pdf. The topics addressed in these templates are abc analysis chart of product costs. All the content presented in this PPT design is completely editable. Download it and make adjustments in color, background, font etc. as per your unique business setting.

ABC Analysis Chart For Business Revenue Assessment Ppt PowerPoint Presentation Model Template PDF
Pitch your topic with ease and precision using this abc analysis chart for business revenue assessment ppt powerpoint presentation model template pdf. This layout presents information on abc analysis chart for business revenue assessment. It is also available for immediate download and adjustment. So, changes can be made in the color, design, graphics or any other component to create a unique layout.
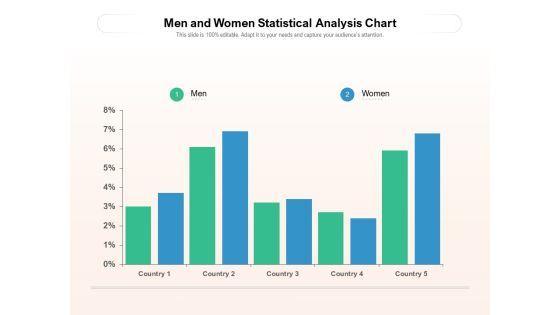
Men And Women Statistical Analysis Chart Ppt PowerPoint Presentation File Slides PDF
Showcasing this set of slides titled men and women statistical analysis chart ppt powerpoint presentation file slides pdf. The topics addressed in these templates are men and women statistical analysis chart. All the content presented in this PPT design is completely editable. Download it and make ajustments in color, background, font etc. as per your unique business setting.

Two Commodities Sales Analysis Chart Ppt PowerPoint Presentation Ideas Inspiration PDF
Showcasing this set of slides titled two commodities sales analysis chart ppt powerpoint presentation ideas inspiration pdf. The topics addressed in these templates are two commodities sales analysis chart. All the content presented in this PPT design is completely editable. Download it and make adjustments in color, background, font etc. as per your unique business setting.

Pie Chart Sales Percentage Analysis Ppt PowerPoint Presentation Gallery Slides PDF
Showcasing this set of slides titled pie chart sales percentage analysis ppt powerpoint presentation gallery slides pdf. The topics addressed in these templates are pie chart sales percentage analysis. All the content presented in this PPT design is completely editable. Download it and make adjustments in color, background, font etc. as per your unique business setting.

Two Products Performance Analysis Chart Ppt PowerPoint Presentation Layouts Aids PDF
Showcasing this set of slides titled two products performance analysis chart ppt powerpoint presentation layouts aids pdf. The topics addressed in these templates are competition, year 2020, two products performance, analysis chart. All the content presented in this PPT design is completely editable. Download it and make adjustments in color, background, font etc. as per your unique business setting.
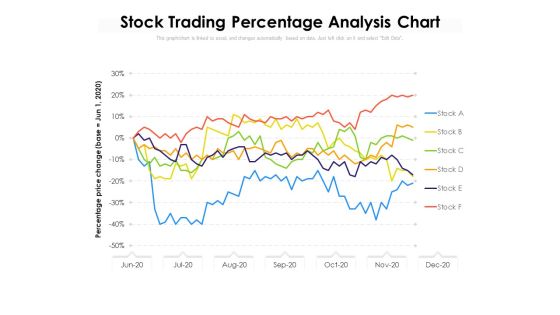
Stock Trading Percentage Analysis Chart Ppt PowerPoint Presentation Slides Files PDF
Presenting this set of slides with name stock trading percentage analysis chart ppt powerpoint presentation slides files pdf. The topics discussed in these slide is stock trading percentage analysis chart. This is a completely editable PowerPoint presentation and is available for immediate download. Download now and impress your audience.
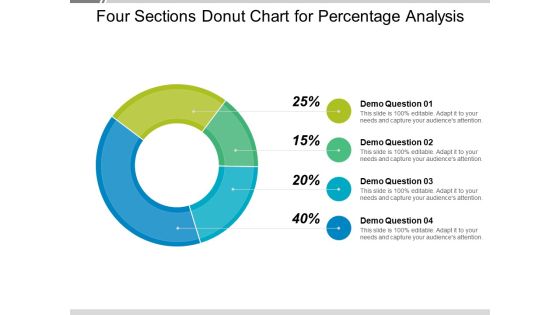
Four Sections Donut Chart For Percentage Analysis Ppt PowerPoint Presentation Styles Portrait PDF
Presenting this set of slides with name four sections donut chart for percentage analysis ppt powerpoint presentation styles portrait pdf. The topics discussed in these slide is four sections donut chart for percentage analysis. This is a completely editable PowerPoint presentation and is available for immediate download. Download now and impress your audience.
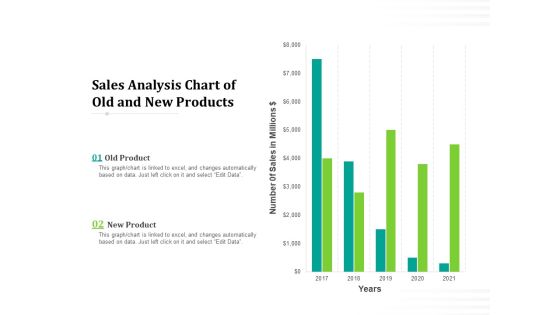
Sales Analysis Chart Of Old And New Products Ppt PowerPoint Presentation Professional Influencers PDF
Pitch your topic with ease and precision using this sales analysis chart of old and new products ppt powerpoint presentation professional influencers pdf. This layout presents information on sales analysis chart of old and new products. It is also available for immediate download and adjustment. So, changes can be made in the color, design, graphics or any other component to create a unique layout.

ABC Analysis Chart With Percentage Of Dollar Value Ppt PowerPoint Presentation Gallery Portfolio PDF
Pitch your topic with ease and precision using this abc analysis chart with percentage of dollar value ppt powerpoint presentation gallery portfolio pdf. This layout presents information on abc analysis chart with percentage of dollar value. It is also available for immediate download and adjustment. So, changes can be made in the color, design, graphics or any other component to create a unique layout.
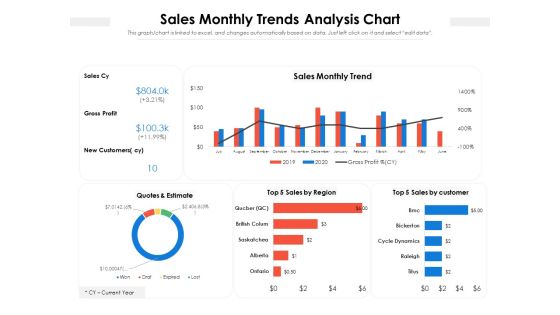
Sales Monthly Trends Analysis Chart Ppt Powerpoint Presentation Gallery Objects Pdf
Pitch your topic with ease and precision using this sales monthly trends analysis chart ppt powerpoint presentation gallery objects pdf. This layout presents information on sales monthly trends analysis chart. It is also available for immediate download and adjustment. So, changes can be made in the color, design, graphics or any other component to create a unique layout.

Pie Chart For Regional Analysis Ppt PowerPoint Presentation Gallery Example PDF
Pitch your topic with ease and precision using this pie chart for regional analysis ppt powerpoint presentation gallery example pdf. This layout presents information on pie chart for regional analysis. It is also available for immediate download and adjustment. So, changes can be made in the color, design, graphics or any other component to create a unique layout.
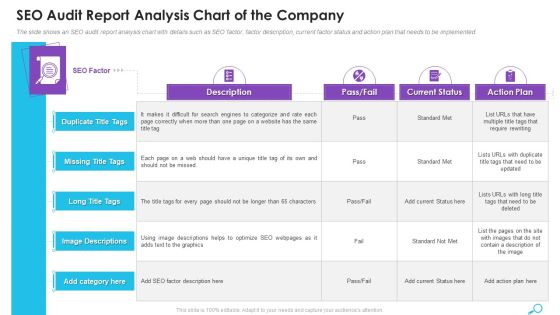
SEO Audit Report Analysis Chart Of The Company Ppt Infographic Template Microsoft PDF
The slide shows an SEO audit report analysis chart with details such as SEO factor, factor description, current factor status and action plan that needs to be implemented. Deliver an awe inspiring pitch with this creative seo audit report analysis chart of the company ppt infographic template microsoft pdf bundle. Topics like seo audit report analysis chart of the company can be discussed with this completely editable template. It is available for immediate download depending on the needs and requirements of the user.
Statistical Data Analysis Chart Vector Icon Ppt PowerPoint Presentation Styles Guide PDF
Showcasing this set of slides titled statistical data analysis chart vector icon ppt powerpoint presentation styles guide pdf. The topics addressed in these templates are statistical data analysis chart vector icon. All the content presented in this PPT design is completely editable. Download it and make adjustments in color, background, font etc. as per your unique business setting.

5 Years Revenue Comparative Analysis Chart Icon Ppt Inspiration Diagrams PDF
Presenting 5 Years Revenue Comparative Analysis Chart Icon Ppt Inspiration Diagrams PDF to dispense important information. This template comprises three stages. It also presents valuable insights into the topics including 5 Years, Revenue Comparative, Analysis Chart, Icon. This is a completely customizable PowerPoint theme that can be put to use immediately. So, download it and address the topic impactfully.
Notepad With Pie Chart For Business Analysis Vector Icon Ppt PowerPoint Presentation Gallery Format Ideas PDF
Presenting this set of slides with name notepad with pie chart for business analysis vector icon ppt powerpoint presentation gallery format ideas pdf. This is a four stage process. The stages in this process are notepad with pie chart for business analysis vector icon. This is a completely editable PowerPoint presentation and is available for immediate download. Download now and impress your audience.

Scatter Chart Illustrating Data Analysis Ppt PowerPoint Presentation Show Graphic Tips PDF
Presenting scatter chart illustrating data analysis ppt powerpoint presentation show graphic tips pdf to dispense important information. This template comprises three stages. It also presents valuable insights into the topics including scatter chart illustrating data analysis. This is a completely customizable PowerPoint theme that can be put to use immediately. So, download it and address the topic impactfully.

5 Years Employee Performance Comparative Analysis Chart Icon Ppt Portfolio Objects PDF
Presenting 5 Years Employee Performance Comparative Analysis Chart Icon Ppt Portfolio Objects PDF to dispense important information. This template comprises three stages. It also presents valuable insights into the topics including 5 Years, Employee Performance, Comparative Analysis, Chart Icon. This is a completely customizable PowerPoint theme that can be put to use immediately. So, download it and address the topic impactfully.
Financial Plan Analysis Chart Vector Icon Ppt PowerPoint Presentation Ideas Inspiration PDF
Showcasing this set of slides titled financial plan analysis chart vector icon ppt powerpoint presentation ideas inspiration pdf. The topics addressed in these templates are financial plan analysis chart vector icon. All the content presented in this PPT design is completely editable. Download it and make adjustments in color, background, font etc. as per your unique business setting.
Performance Growth Analysis Chart Vector Icon Ppt PowerPoint Presentation Styles Mockup PDF
Presenting this set of slides with name performance growth analysis chart vector icon ppt powerpoint presentation styles mockup pdf. This is a three stage process. The stages in this process are performance growth analysis chart vector icon. This is a completely editable PowerPoint presentation and is available for immediate download. Download now and impress your audience.

Circle Chart With Percentage Analysis Vector Icon Ppt PowerPoint Presentation Summary Graphic Images PDF
Presenting this set of slides with name circle chart with percentage analysis vector icon ppt powerpoint presentation summary graphic images pdf. This is a three stage process. The stages in this process are circle chart with percentage analysis vector icon. This is a completely editable PowerPoint presentation and is available for immediate download. Download now and impress your audience.
Sales Growth Analysis Chart Vector Icon Ppt Powerpoint Presentation Portfolio Inspiration Pdf
Showcasing this set of slides titled sales growth analysis chart vector icon ppt powerpoint presentation portfolio inspiration pdf. The topics addressed in these templates are sales growth analysis chart vector icon. All the content presented in this PPT design is completely editable. Download it and make adjustments in color, background, font etc. as per your unique business setting.
Pie Chart For Ratio Analysis Vector Icon Ppt PowerPoint Presentation File Show PDF
Showcasing this set of slides titled pie chart for ratio analysis vector icon ppt powerpoint presentation file show pdf. The topics addressed in these templates are pie chart for ratio analysis vector icon. All the content presented in this PPT design is completely editable. Download it and make adjustments in color, background, font etc. as per your unique business setting.

Business Growth Percentage Analysis Chart Ppt PowerPoint Presentation Gallery Pictures PDF
Presenting this set of slides with name business growth percentage analysis chart ppt powerpoint presentation gallery pictures pdf. This is a three stage process. The stages in this process are business growth percentage analysis chart. This is a completely editable PowerPoint presentation and is available for immediate download. Download now and impress your audience.

Business Product Brand Analysis Chart Ppt PowerPoint Presentation File Templates PDF
Showcasing this set of slides titled business product brand analysis chart ppt powerpoint presentation file templates pdf. The topics addressed in these templates are business product brand analysis chart. All the content presented in this PPT design is completely editable. Download it and make adjustments in color, background, font etc. as per your unique business setting.
 Home
Home