Chart Analysis

Consumer Demand Grid Chart With High And Low Risk Levels Ppt Layouts Visual Aids PDF
Presenting consumer demand grid chart with high and low risk levels ppt layouts visual aids pdf to dispense important information. This template comprises four stages. It also presents valuable insights into the topics including consumer demand grid chart with high and low risk levels. This is a completely customizable PowerPoint theme that can be put to use immediately. So, download it and address the topic impactfully.

Supply And Demand Grid Chart With Risks Levels Ppt File Structure PDF
Persuade your audience using this supply and demand grid chart with risks levels ppt file structure pdf. This PPT design covers four stages, thus making it a great tool to use. It also caters to a variety of topics including supply and demand grid chart with risks levels. Download this PPT design now to present a convincing pitch that not only emphasizes the topic but also showcases your presentation skills.
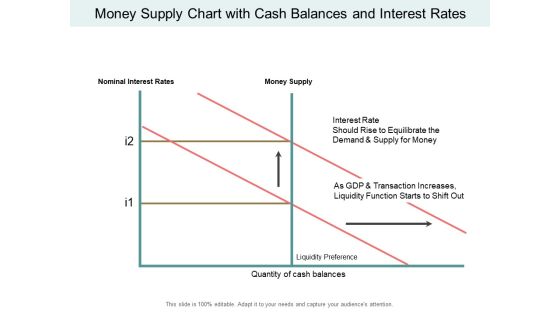
Money Supply Chart With Cash Balances And Interest Rates Ppt PowerPoint Presentation Inspiration Background Images
This is a money supply chart with cash balances and interest rates ppt powerpoint presentation inspiration background images. This is a two stage process. The stages in this process are liquidity, cash assets, solvency.
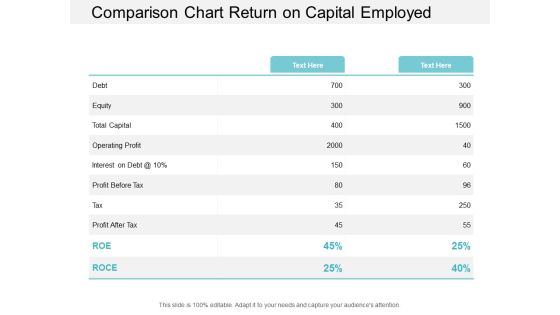
Comparison Chart Return On Capital Employed Ppt PowerPoint Presentation Portfolio Templates
This is a comparison chart return on capital employed ppt powerpoint presentation portfolio templates. This is a two stage process. The stages in this process are accounting ratio, roce, return on capital employed.
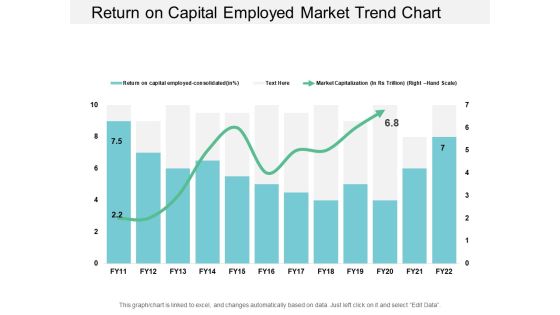
Return On Capital Employed Market Trend Chart Ppt PowerPoint Presentation Styles Examples
This is a return on capital employed market trend chart ppt powerpoint presentation styles examples. This is a two stage process. The stages in this process are accounting ratio, roce, return on capital employed.

Return On Capital Employed Product Performance Chart Ppt PowerPoint Presentation Portfolio Visuals
This is a return on capital employed product performance chart ppt powerpoint presentation portfolio visuals. This is a three stage process. The stages in this process are accounting ratio, roce, return on capital employed.

Database Management Icon With Chart And Magnifying Glass Ppt Icon Backgrounds PDF
Persuade your audience using this database management icon with chart and magnifying glass ppt icon backgrounds pdf. This PPT design covers three stages, thus making it a great tool to use. It also caters to a variety of topics including database management icon with chart and magnifying glass. Download this PPT design now to present a convincing pitch that not only emphasizes the topic but also showcases your presentation skills.

Drawing Book With Color Chart To Draw Creative Design Ppt PowerPoint Presentation File Outline PDF
Presenting drawing book with color chart to draw creative design ppt powerpoint presentation file outline pdf to dispense important information. This template comprises three stages. It also presents valuable insights into the topics including drawing book with color chart to draw creative design. This is a completely customizable PowerPoint theme that can be put to use immediately. So, download it and address the topic impactfully.

Cost Management Plan With Pie Chart And Dollar Sign Mockup PDF
Persuade your audience using this cost management plan with pie chart and dollar sign mockup pdf. This PPT design covers four stages, thus making it a great tool to use. It also caters to a variety of topics including cost management plan with pie chart and dollar sign. Download this PPT design now to present a convincing pitch that not only emphasizes the topic but also showcases your presentation skills.

Demand Grid Chart For Tracking User Traffic Ppt Ideas Graphics Pictures PDF
Persuade your audience using this demand grid chart for tracking user traffic ppt ideas graphics pictures pdf. This PPT design covers four stages, thus making it a great tool to use. It also caters to a variety of topics including demand grid chart for tracking user traffic. Download this PPT design now to present a convincing pitch that not only emphasizes the topic but also showcases your presentation skills.

Product Demand Grid Chart With Increase In Sales Volume Ppt Slides Tips PDF
Persuade your audience using this product demand grid chart with increase in sales volume ppt slides tips pdf. This PPT design covers four stages, thus making it a great tool to use. It also caters to a variety of topics including product demand grid chart with increase in sales volume. Download this PPT design now to present a convincing pitch that not only emphasizes the topic but also showcases your presentation skills.
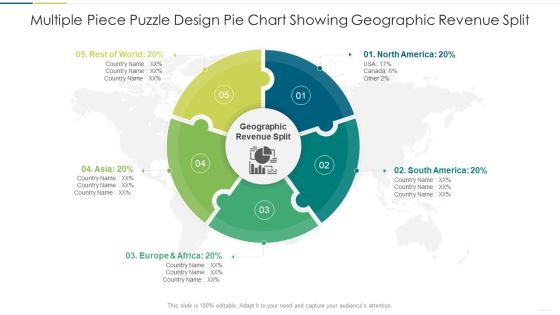
Multiple Piece Puzzle Design Pie Chart Showing Geographic Revenue Split Rules PDF
Persuade your audience using this multiple piece puzzle design pie chart showing geographic revenue split rules pdf. This PPT design covers five stages, thus making it a great tool to use. It also caters to a variety of topics including multiple piece puzzle design pie chart showing geographic revenue split. Download this PPT design now to present a convincing pitch that not only emphasizes the topic but also showcases your presentation skills.

Process Flow Chart Of Digital Twin Technology Ppt PowerPoint Presentation File Gallery PDF
This slide represents the digital twin process flow chart that includes system, process, and product and how each one of them is carried out using digital twin technology. Boost your pitch with our creative Process Flow Chart Of Digital Twin Technology Ppt PowerPoint Presentation File Gallery PDF. Deliver an awe-inspiring pitch that will mesmerize everyone. Using these presentation templates you will surely catch everyones attention. You can browse the ppts collection on our website. We have researchers who are experts at creating the right content for the templates. So you do not have to invest time in any additional work. Just grab the template now and use them.

Introduction To Mobile SEM Functional Chart Of Mobile SEO Team Portrait PDF
The purpose of this slide is to outline a diagrammatic representation of mobile search engine optimization SEO team. The org chart covers information about the teams of director of organic and paid search. There are so many reasons you need a Introduction To Mobile SEM Functional Chart Of Mobile SEO Team Portrait PDF. The first reason is you can not spend time making everything from scratch, Thus, Slidegeeks has made presentation templates for you too. You can easily download these templates from our website easily.
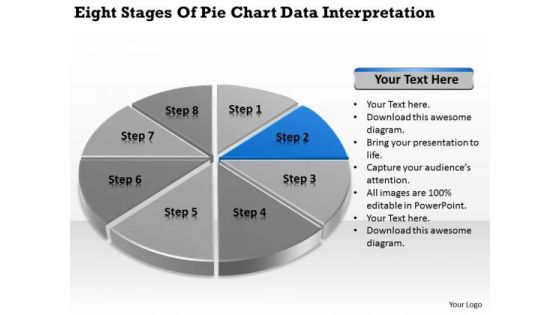
Stages Of Pie Chart Data Interpretation Vending Machine Business Plan PowerPoint Slides
We present our stages of pie chart data interpretation vending machine business plan PowerPoint Slides.Present our Circle Charts PowerPoint Templates because You should Bet on your luck with our PowerPoint Templates and Slides. Be assured that you will hit the jackpot. Present our Marketing PowerPoint Templates because Our PowerPoint Templates and Slides will provide you the cutting edge. Slice through the doubts in the minds of your listeners. Download our Business PowerPoint Templates because you should Experience excellence with our PowerPoint Templates and Slides. They will take your breath away. Download our Shapes PowerPoint Templates because It will Raise the bar of your Thoughts. They are programmed to take you to the next level. Present our Process and Flows PowerPoint Templates because Our PowerPoint Templates and Slides will give good value for money. They also have respect for the value of your time.Use these PowerPoint slides for presentations relating to achievement, analysis, background, bank, banking, business, calculation, chart, circle, commerce, commercial, commission, concept, credit, crisis, debt, deposit, design, detail, diagram, earnings, economics, economy, element, finance, goal, gold, golden, graph, graphic, growth, icon, idea, illustration, income, increase, invest, isolated, level, loss, market, marketing, metal, modern, money, new, object, part, percent, percentage, pie, plot, politics, profit, progress, ratio, reflection, reflective. The prominent colors used in the PowerPoint template are Blue, Gray, Black.
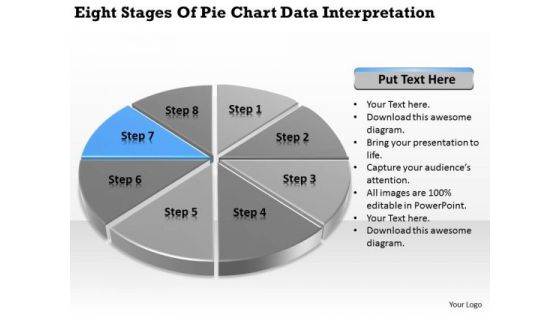
Stages Of Pie Chart Data Interpretation Business Plan Template PowerPoint Templates
We present our stages of pie chart data interpretation business plan template PowerPoint templates.Download and present our Circle Charts PowerPoint Templates because You can Stir your ideas in the cauldron of our PowerPoint Templates and Slides. Cast a magic spell on your audience. Download our Marketing PowerPoint Templates because Our PowerPoint Templates and Slides will let you Hit the target. Go the full distance with ease and elan. Use our Business PowerPoint Templates because Our PowerPoint Templates and Slides are truly out of this world. Even the MIB duo has been keeping tabs on our team. Download our Shapes PowerPoint Templates because Watching this your Audience will Grab their eyeballs, they wont even blink. Download our Process and Flows PowerPoint Templates because It will Give impetus to the hopes of your colleagues. Our PowerPoint Templates and Slides will aid you in winning their trust.Use these PowerPoint slides for presentations relating to achievement, analysis, background, bank, banking, business, calculation, chart, circle, commerce, commercial, commission, concept, credit, crisis, debt, deposit, design, detail, diagram, earnings, economics, economy, element, finance, goal, gold, golden, graph, graphic, growth, icon, idea, illustration, income, increase, invest, isolated, level, loss, market, marketing, metal, modern, money, new, object, part, percent, percentage, pie, plot, politics, profit, progress, ratio, reflection, reflective. The prominent colors used in the PowerPoint template are Blue, Gray, Black.

Stages Of Pie Chart Data Interpretation How To Write Business Plan PowerPoint Templates
We present our stages of pie chart data interpretation how to write business plan PowerPoint templates.Present our Circle Charts PowerPoint Templates because Our PowerPoint Templates and Slides will provide you a launch platform. Give a lift off to your ideas and send them into orbit. Present our Marketing PowerPoint Templates because Our PowerPoint Templates and Slides will let you Hit the right notes. Watch your audience start singing to your tune. Use our Business PowerPoint Templates because Our PowerPoint Templates and Slides come in all colours, shades and hues. They help highlight every nuance of your views. Download our Shapes PowerPoint Templates because It can Leverage your style with our PowerPoint Templates and Slides. Charm your audience with your ability. Use our Process and Flows PowerPoint Templates because You can Connect the dots. Fan expectations as the whole picture emerges.Use these PowerPoint slides for presentations relating to achievement, analysis, background, bank, banking, business, calculation, chart, circle, commerce, commercial, commission, concept, credit, crisis, debt, deposit, design, detail, diagram, earnings, economics, economy, element, finance, goal, gold, golden, graph, graphic, growth, icon, idea, illustration, income, increase, invest, isolated, level, loss, market, marketing, metal, modern, money, new, object, part, percent, percentage, pie, plot, politics, profit, progress, ratio, reflection, reflective. The prominent colors used in the PowerPoint template are Blue, Gray, Black.
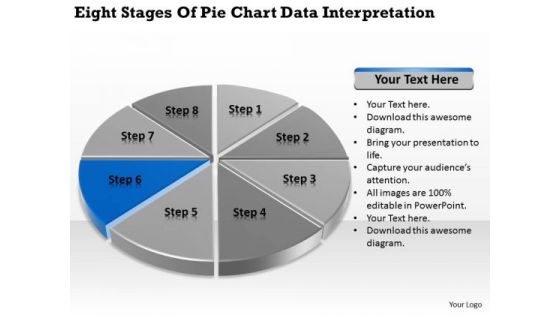
Stages Of Pie Chart Data Interpretation Example Business Plan PowerPoint Slides
We present our stages of pie chart data interpretation example business plan PowerPoint Slides.Download and present our Circle Charts PowerPoint Templates because It will let you Set new benchmarks with our PowerPoint Templates and Slides. They will keep your prospects well above par. Download our Marketing PowerPoint Templates because Our PowerPoint Templates and Slides will weave a web of your great ideas. They are gauranteed to attract even the most critical of your colleagues. Use our Business PowerPoint Templates because It will Strengthen your hand with your thoughts. They have all the aces you need to win the day. Present our Shapes PowerPoint Templates because It will get your audience in sync. Present our Process and Flows PowerPoint Templates because Our PowerPoint Templates and Slides will generate and maintain the level of interest you desire. They will create the impression you want to imprint on your audience.Use these PowerPoint slides for presentations relating to achievement, analysis, background, bank, banking, business, calculation, chart, circle, commerce, commercial, commission, concept, credit, crisis, debt, deposit, design, detail, diagram, earnings, economics, economy, element, finance, goal, gold, golden, graph, graphic, growth, icon, idea, illustration, income, increase, invest, isolated, level, loss, market, marketing, metal, modern, money, new, object, part, percent, percentage, pie, plot, politics, profit, progress, ratio, reflection, reflective. The prominent colors used in the PowerPoint template are Blue navy, Gray, Black.
Four Steps Workflow Chart Of Innovation Plan With Icons Ppt PowerPoint Presentation Outline Graphics Tutorials PDF
Presenting four steps workflow chart of innovation plan with icons ppt powerpoint presentation outline graphics tutorials pdf to dispense important information. This template comprises four stages. It also presents valuable insights into the topics including developing profitable, testing chosen solution, implementation. This is a completely customizable PowerPoint theme that can be put to use immediately. So, download it and address the topic impactfully.
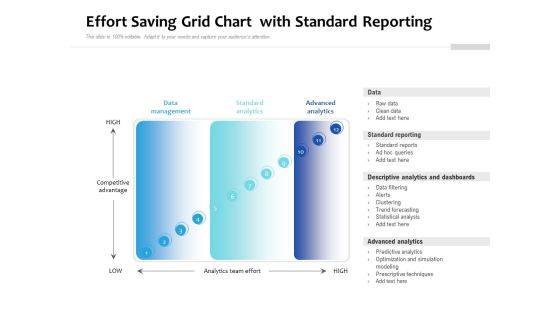
Effort Saving Grid Chart With Standard Reporting Ppt PowerPoint Presentation Layouts Graphics PDF
Presenting effort saving grid chart with standard reporting ppt powerpoint presentation layouts graphics pdf to dispense important information. This template comprises twelve stages. It also presents valuable insights into the topics including data management, standard analytics, advanced analytics. This is a completely customizable PowerPoint theme that can be put to use immediately. So, download it and address the topic impactfully.

Client Support Process Flow Chart Ppt PowerPoint Presentation Gallery Design Inspiration PDF
Presenting client support process flow chart ppt powerpoint presentation gallery design inspiration pdf to dispense important information. This template comprises three stages. It also presents valuable insights into the topics including level one support, call escalation, resolution. This is a completely customizable PowerPoint theme that can be put to use immediately. So, download it and address the topic impactfully.
PMP Procedure Chart IT Poste It Notes Ppt Portfolio Guidelines PDF
Presenting pmp procedure chart it poste it notes ppt portfolio guidelines pdf to provide visual cues and insights. Share and navigate important information on three stages that need your due attention. This template can be used to pitch topics like poste it notes. In addtion, this PPT design contains high resolution images, graphics, etc, that are easily editable and available for immediate download.

Various Stages Data Extraction Process Flow Chart Ppt PowerPoint Presentation Pictures Show PDF
Persuade your audience using this various stages data extraction process flow chart ppt powerpoint presentation pictures show pdf. This PPT design covers five stages, thus making it a great tool to use. It also caters to a variety of topics including interpretation evaluation, data mining, transformation, preprocessing, selection, target data, preprocessed data, transformed data, patterns, knowledge. Download this PPT design now to present a convincing pitch that not only emphasizes the topic but also showcases your presentation skills.
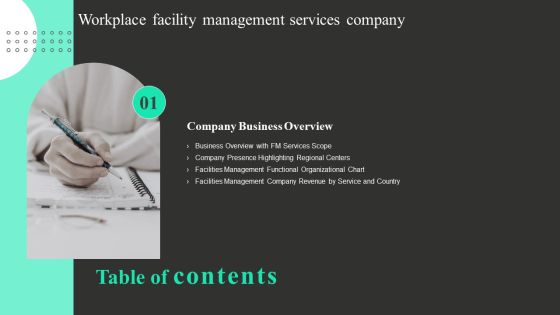
Workplace Facility Management Services Company Workplace Facility Management Services Company Chart Graphics PDF
If your project calls for a presentation, then Slidegeeks is your go to partner because we have professionally designed, easy to edit templates that are perfect for any presentation. After downloading, you can easily edit Workplace Facility Management Services Company Workplace Facility Management Services Company Chart Graphics PDF and make the changes accordingly. You can rearrange slides or fill them with different images. Check out all the handy templates.
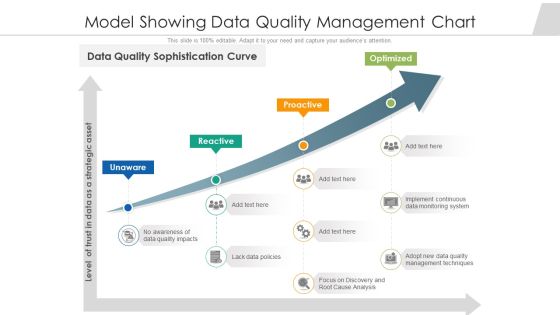
Model Showing Data Quality Management Chart Ppt PowerPoint Presentation Show Slide Download PDF
Persuade your audience using this model showing data quality management chart ppt powerpoint presentation show slide download pdf. This PPT design covers four stages, thus making it a great tool to use. It also caters to a variety of topics including implement continuous data monitoring system, management techniques, strategic asset. Download this PPT design now to present a convincing pitch that not only emphasizes the topic but also showcases your presentation skills.
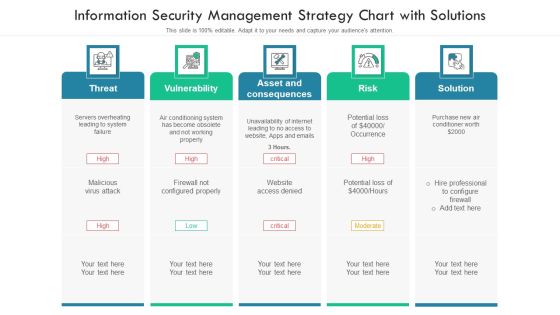
Information Security Management Strategy Chart With Solutions Ppt PowerPoint Presentation File Slides PDF
Persuade your audience using this information security management strategy chart with solutions ppt powerpoint presentation file slides pdf. This PPT design covers five stages, thus making it a great tool to use. It also caters to a variety of topics including threat, vulnerability, risk, solution. Download this PPT design now to present a convincing pitch that not only emphasizes the topic but also showcases your presentation skills.
Social Media Marketing Grid Chart Vector Icon Ppt Outline Maker PDF
This slide covers matrix for writing content for social media branding. It includes indictors such as Persona, Voice, Language and purpose of writing Presenting social media marketing grid chart vector icon ppt outline maker pdf to dispense important information. This template comprises four stages. It also presents valuable insights into the topics including marketing, professorial, language. This is a completely customizable PowerPoint theme that can be put to use immediately. So, download it and address the topic impactfully.

Strategic Sourcing Chart With Performance Based Partnership Ppt Infographics Designs PDF
Persuade your audience using this strategic sourcing chart with performance based partnership ppt infographics designs pdf. This PPT design covers four stages, thus making it a great tool to use. It also caters to a variety of topics including leverage products, strategic products, bottleneck products. Download this PPT design now to present a convincing pitch that not only emphasizes the topic but also showcases your presentation skills.
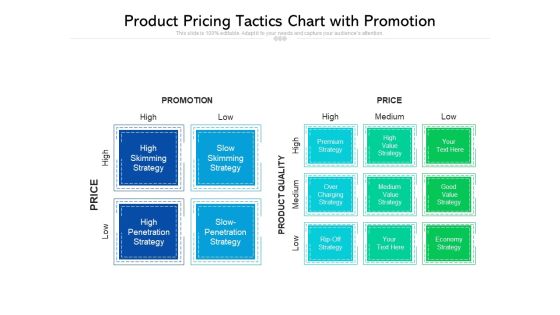
Product Pricing Tactics Chart With Promotion Ppt PowerPoint Presentation Outline Slide Portrait PDF
Persuade your audience using this product pricing tactics chart with promotion ppt powerpoint presentation outline slide portrait pdf. This PPT design covers two stages, thus making it a great tool to use. It also caters to a variety of topics including product quality, premium strategy, high penetration strategy . Download this PPT design now to present a convincing pitch that not only emphasizes the topic but also showcases your presentation skills.

Four Steps Grid Chart With Ecosystem Drivers Ppt PowerPoint Presentation File Format PDF
Persuade your audience using this four steps grid chart with ecosystem drivers ppt powerpoint presentation file format pdf. This PPT design covers four stages, thus making it a great tool to use. It also caters to a variety of topics including multichannel businesses, business design, ecosystem drivers. Download this PPT design now to present a convincing pitch that not only emphasizes the topic but also showcases your presentation skills.

Effort Saving Grid Chart For Task Priority Ppt PowerPoint Presentation Summary Samples PDF
Persuade your audience using this effort saving grid chart for task priority ppt powerpoint presentation summary samples pdf. This PPT design covers four stages, thus making it a great tool to use. It also caters to a variety of topics including crucial do now, crucial but do later, uncategorized. Download this PPT design now to present a convincing pitch that not only emphasizes the topic but also showcases your presentation skills.

Task Prioritizing For Effort Saving Chart Ppt PowerPoint Presentation Pictures Ideas PDF
Persuade your audience using this task prioritizing for effort saving chart ppt powerpoint presentation pictures ideas pdf. This PPT design covers one stage, thus making it a great tool to use. It also caters to a variety of topics including marketing, innovation, sales customer relationship management CRM. Download this PPT design now to present a convincing pitch that not only emphasizes the topic but also showcases your presentation skills.

Four Steps Workflow Chart For Project Problems Management Ppt PowerPoint Presentation Layouts Layouts PDF
Persuade your audience using this four steps workflow chart for project problems management ppt powerpoint presentation layouts layouts pdf. This PPT design covers four stages, thus making it a great tool to use. It also caters to a variety of topics including reviewing possible actions, implementing action, review and control actions. Download this PPT design now to present a convincing pitch that not only emphasizes the topic but also showcases your presentation skills.
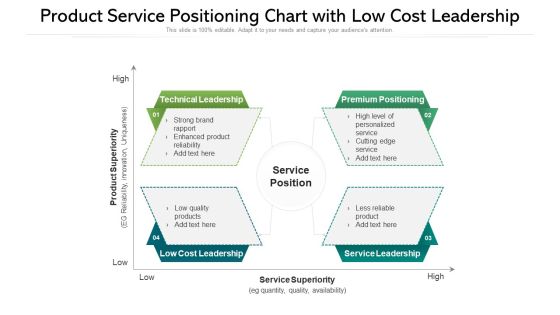
Product Service Positioning Chart With Low Cost Leadership Ppt PowerPoint Presentation Layouts Mockup PDF
Persuade your audience using this product service positioning chart with low cost leadership ppt powerpoint presentation layouts mockup pdf. This PPT design covers four stages, thus making it a great tool to use. It also caters to a variety of topics including product superiority, technical leadership, service position. Download this PPT design now to present a convincing pitch that not only emphasizes the topic but also showcases your presentation skills.

Org Chart Showing Top Middle And Lower Management Levels Brochure PDF
Persuade your audience using this org chart showing top middle and lower management levels brochure pdf. This PPT design covers three stages, thus making it a great tool to use. It also caters to a variety of topics including top level management, middle level management, lower level management. Download this PPT design now to present a convincing pitch that not only emphasizes the topic but also showcases your presentation skills.

Organization Chart And Corporate Model Transformation Risk Associated With Starburst Strategy Background PDF
This slide covers the problems associated with starburst strategy if not implemented properly such as impact on ROI, teams not aligned with enterprise wide strategy and goals and objectives does not aligned with overall business goals. This is a organization chart and corporate model transformation risk associated with starburst strategy background pdf template with various stages. Focus and dispense information on three stages using this creative set, that comes with editable features. It contains large content boxes to add your information on topics like risk associated with starburst strategy. You can also showcase facts, figures, and other relevant content using this PPT layout. Grab it now.
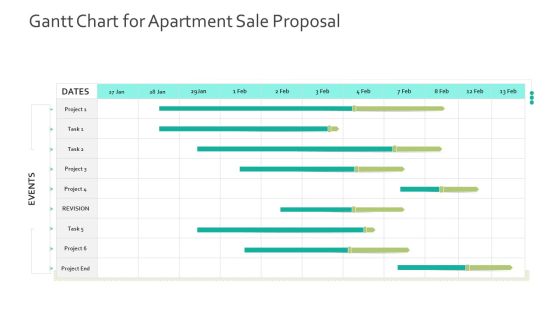
Gantt Chart For Apartment Sale Proposal Human Resource Information System For Organizational Effectiveness Sample PDF
We have summarized the situation in three section that defines the problem and solution for better HR System. This is a Gantt Chart For Apartment Sale Proposal Human Resource Information System For Organizational Effectiveness Sample Pdf template with various stages. Focus and dispense information on three stages using this creative set, that comes with editable features. It contains large content boxes to add your information on topics like process, system, resources, strategic. You can also showcase facts, figures, and other relevant content using this PPT layout. Grab it now.

Scrum Team Company Structural Chart Ppt PowerPoint Presentation File Infographic Template PDF
This slide provides the glimpse about the scrum team organizational structure which focuses on business owner, scrum master, product owner and development team. From laying roadmaps to briefing everything in detail, our templates are perfect for you. You can set the stage with your presentation slides. All you have to do is download these easy to edit and customizable templates. Scrum Team Company Structural Chart Ppt PowerPoint Presentation File Infographic Template PDF will help you deliver an outstanding performance that everyone would remember and praise you for. Do download this presentation today.

Organization Chart And Corporate Model Transformation Mitigation Plan Checklist Structure PDF
This slide covers organization systems readiness based on information, communication technology, content and business application. It also covers action required, when required and action completion status. Presenting organization chart and corporate model transformation mitigation plan checklist structure pdf to provide visual cues and insights. Share and navigate important information on three stages that need your due attention. This template can be used to pitch topics like information and communications technology ict, content, business application. In addtion, this PPT design contains high resolution images, graphics, etc, that are easily editable and available for immediate download.

Organization Chart And Corporate Model Transformation Business Process After Restructuring Brochure PDF
This slide covers the business process after implementing the organizational restructuring program starting from product definition to warranty process including various customer touch points. This is a organization chart and corporate model transformation business process after restructuring brochure pdf template with various stages. Focus and dispense information on seven stages using this creative set, that comes with editable features. It contains large content boxes to add your information on topics like warranty process, accounting process, production process, purchasing process, buyer process. You can also showcase facts, figures, and other relevant content using this PPT layout. Grab it now.

Organization Chart And Corporate Model Transformation Mitigation Plan Checklist Actions Structure PDF
This slide covers organization people readiness based on business unit or product group actions and training. It also, covers action required, when required and action completion status. This is a organization chart and corporate model transformation mitigation plan checklist actions structure pdf template with various stages. Focus and dispense information on two stages using this creative set, that comes with editable features. It contains large content boxes to add your information on topics like business unit or product group actions, training. You can also showcase facts, figures, and other relevant content using this PPT layout. Grab it now.
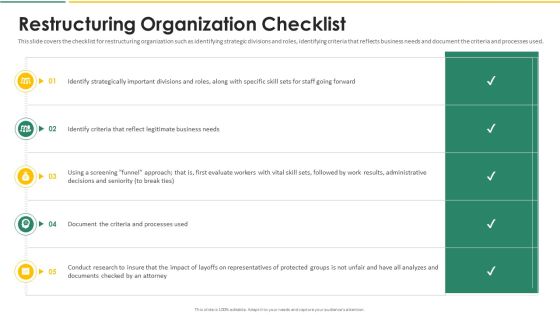
Organization Chart And Corporate Model Transformation Restructuring Organization Checklist Slides PDF
This slide covers the checklist for restructuring organization such as identifying strategic divisions and roles, identifying criteria that reflects business needs and document the criteria and processes used. This is a organization chart and corporate model transformation restructuring organization checklist slides pdf template with various stages. Focus and dispense information on five stages using this creative set, that comes with editable features. It contains large content boxes to add your information on topics like strategically, business, evaluate, processes, analyzes. You can also showcase facts, figures, and other relevant content using this PPT layout. Grab it now.
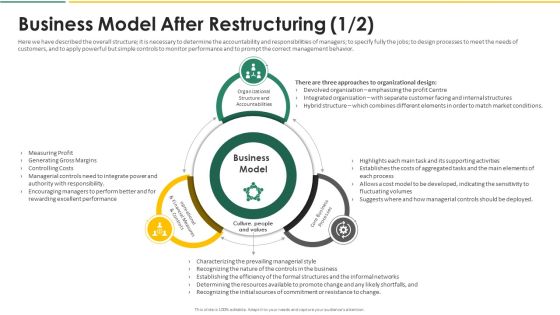
Organization Chart And Corporate Model Transformation Business Model After Information PDF
Here we have described the overall structure it is necessary to determine the accountability and responsibilities of managers to specify fully the jobs to design processes to meet the needs of customers, and to apply powerful but simple controls to monitor performance and to prompt the correct management behavior. This is a organization chart and corporate model transformation business model after information pdf template with various stages. Focus and dispense information on three stages using this creative set, that comes with editable features. It contains large content boxes to add your information on topics like organizational structure and accountabilities, opreational and financial measures and controls, core business processes. You can also showcase facts, figures, and other relevant content using this PPT layout. Grab it now.
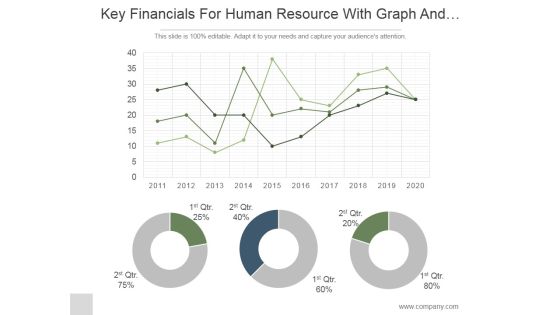
Key Financials For Human Resource With Graph And Pie Chart Ppt PowerPoint Presentation Ideas
This is a key financials for human resource with graph and pie chart ppt powerpoint presentation ideas. This is a three stage process. The stages in this process are business, strategy, marketing, analysis, donut, growth.

Volume High Low Close Chart Ppt PowerPoint Presentation Ideas Background Images
This is a volume high low close chart ppt powerpoint presentation ideas background images. This is a five stage process. The stages in this process are volume, high, low, close.

Download Diverging Process Arrow Chart Ppt Relative Circular Flow PowerPoint Slides
We present our download diverging process arrow chart ppt Relative Circular Flow PowerPoint Slides.Download and present our Circle Charts PowerPoint Templates because visual appeal is a priority for us. Download and present our Arrows PowerPoint Templates because you can Lead your flock steadily to greater heights. Look around at the vast potential of achievement around you. Download our Business PowerPoint Templates because the fruits of your labour are beginning to show.Enlighten them on the great plans you have for their enjoyment. Download and present our Shapes PowerPoint Templates because generation of sales is the core of any business. Use our Flow Charts PowerPoint Templates because this slide demonstrates how they contribute to the larger melting pot.Use these PowerPoint slides for presentations relating to Analysis, Background, Blank, Business, Center, Central, Chart, Component, Concept, Diagram, Disperse, Distribute, Expand, Flow, Gist, Group, Industry, Process, Strategy, Support, Surround, Template, Transfer. The prominent colors used in the PowerPoint template are White, Brown, Gray. People tell us our download diverging process arrow chart ppt Relative Circular Flow PowerPoint Slides are Attractive. Professionals tell us our Business PowerPoint templates and PPT Slides are Elegant. Customers tell us our download diverging process arrow chart ppt Relative Circular Flow PowerPoint Slides are specially created by a professional team with vast experience. They diligently strive to come up with the right vehicle for your brilliant Ideas. Use our Chart PowerPoint templates and PPT Slides are Luxuriant. We assure you our download diverging process arrow chart ppt Relative Circular Flow PowerPoint Slides are the best it can get when it comes to presenting. Professionals tell us our Blank PowerPoint templates and PPT Slides are Beautiful.

7 Stages Parallel Arrow Process Sequence Chart Business Plan Outline Template PowerPoint Templates
We present our 7 stages parallel arrow process sequence chart business plan outline template PowerPoint templates.Present our Arrows PowerPoint Templates because Our PowerPoint Templates and Slides are Clear and concise. Use them and dispel any doubts your team may have. Download and present our Signs PowerPoint Templates because Our PowerPoint Templates and Slides will let Your superior ideas hit the target always and everytime. Download and present our Shapes PowerPoint Templates because You can Raise a toast with our PowerPoint Templates and Slides. Spread good cheer amongst your audience. Download and present our Metaphors-Visual Concepts PowerPoint Templates because It will mark the footprints of your journey. Illustrate how they will lead you to your desired destination. Download our Business PowerPoint Templates because Our PowerPoint Templates and Slides are aesthetically designed to attract attention. We gaurantee that they will grab all the eyeballs you need.Use these PowerPoint slides for presentations relating to action, analysis, arrow, business, chart, colorful, company, concept, conceptual, corporate, design, diagram, editable, flowchart, goal, growth, guidelines, idea, illustration, manage, management, mission, model, motivation, opportunity, organization, performance, plan, process, profit, progress, project, representation, resource, risk, solution, strategy, strength, success, swot, team, theoretical, theory, threat, tool, vector, vision, weakness. The prominent colors used in the PowerPoint template are Yellow, Orange, Green. We assure you our 7 stages parallel arrow process sequence chart business plan outline template PowerPoint templates will make you look like a winner. People tell us our arrow PowerPoint templates and PPT Slides are designed by a team of presentation professionals. Customers tell us our 7 stages parallel arrow process sequence chart business plan outline template PowerPoint templates will make the presenter look like a pro even if they are not computer savvy. Presenters tell us our company PowerPoint templates and PPT Slides will make the presenter look like a pro even if they are not computer savvy. People tell us our 7 stages parallel arrow process sequence chart business plan outline template PowerPoint templates effectively help you save your valuable time. We assure you our colorful PowerPoint templates and PPT Slides help you meet deadlines which are an element of today's workplace. Just browse and pick the slides that appeal to your intuitive senses.

Brainstorming And Organizing Ideas Mind Map Chart Ppt Business Plan PowerPoint Templates
We present our brainstorming and organizing ideas mind map chart ppt business plan PowerPoint templates.Use our Light Bulbs PowerPoint Templates because It will Strengthen your hand with your thoughts. They have all the aces you need to win the day. Download and present our Business PowerPoint Templates because They will Put your wonderful verbal artistry on display. Our PowerPoint Templates and Slides will provide you the necessary glam and glitter. Download and present our Technology PowerPoint Templates because Our PowerPoint Templates and Slides are specially created by a professional team with vast experience. They diligently strive to come up with the right vehicle for your brilliant Ideas. Download and present our Shapes PowerPoint Templates because It is Aesthetically crafted by artistic young minds. Our PowerPoint Templates and Slides are designed to display your dexterity. Present our Process and Flows PowerPoint Templates because Timeline crunches are a fact of life. Meet all deadlines using our PowerPoint Templates and Slides.Use these PowerPoint slides for presentations relating to 3d, business, plan, process, market, formula, corporate, success, mind map, diagram, analysis, marketing, relation, idea, mind, management, connection, chart, strategy, solutions, brainstorming, conceptual, financial. The prominent colors used in the PowerPoint template are Blue, Yellow, Gray.
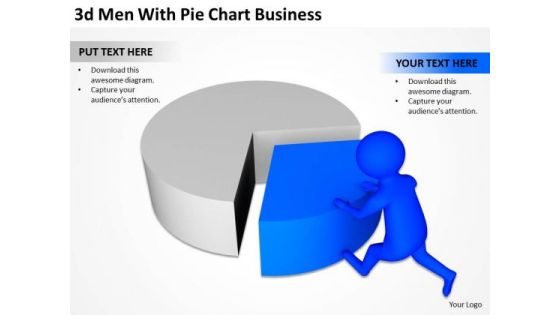
Top Business People 3d Man With Pie Chart New PowerPoint Presentation Templates
We present our top business people 3d man with pie chart new powerpoint presentation templates.Present our Circle Charts PowerPoint Templates because You can Be the star of the show with our PowerPoint Templates and Slides. Rock the stage with your ideas. Present our Business PowerPoint Templates because Our PowerPoint Templates and Slides will Activate the energies of your audience. Get their creative juices flowing with your words. Download our People PowerPoint Templates because our PowerPoint Templates and Slides will give your ideas the shape. Use our Shapes PowerPoint Templates because It will mark the footprints of your journey. Illustrate how they will lead you to your desired destination. Download our Success PowerPoint Templates because You can Channelise the thoughts of your team with our PowerPoint Templates and Slides. Urge them to focus on the goals you have set.Use these PowerPoint slides for presentations relating to 3d,active, analysis, business, cartoon, character, chart, commerce, company, data,diagram, earning, economy, figures, financial, forecast, gain, goal, graph, growth,guy, income, investment, male, man, market, money, monthly, number, person,pie, planning, positive, profit, profitable, progress, pushing, report, research,results, revenue, sale, sheet, spreadsheet, statement, statistics, stock, table. The prominent colors used in the PowerPoint template are Blue , Gray, Black. We assure you our top business people 3d man with pie chart new powerpoint presentation templates provide you with a vast range of viable options. Select the appropriate ones and just fill in your text. You can be sure our character PowerPoint templates and PPT Slides will make the presenter successul in his career/life. Use our top business people 3d man with pie chart new powerpoint presentation templates will make the presenter successul in his career/life. We assure you our chart PowerPoint templates and PPT Slides will get their audience's attention. Use our top business people 3d man with pie chart new powerpoint presentation templates will make you look like a winner. Professionals tell us our chart PowerPoint templates and PPT Slides will generate and maintain the level of interest you desire. They will create the impression you want to imprint on your audience.

Acquisition Firm Business Outline Procurement Management Process Flow Chart Demonstration PDF
This slide provides the details of the procurement management process flowchart which covers research of exiting and new markets, identify suppliers, negotiate supplier terms, etc. Presenting acquisition firm business outline procurement management process flow chart demonstration pdf to provide visual cues and insights. Share and navigate important information on nine stages that need your due attention. This template can be used to pitch topics like supplier issues, product performance, maintain supplier, evaluate supplier performance. In addtion, this PPT design contains high resolution images, graphics, etc, that are easily editable and available for immediate download.
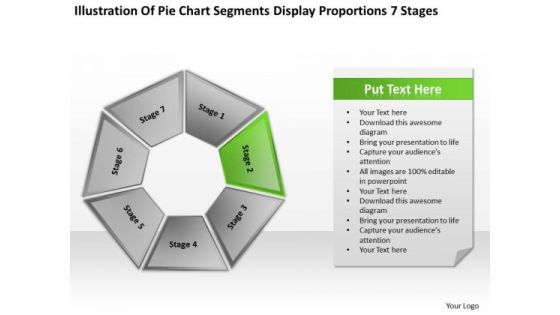
Chart Segments Display Proportions 7 Stages Business Development Plans PowerPoint Templates
We present our chart segments display proportions 7 stages business development plans PowerPoint templates.Use our Business PowerPoint Templates because It will get your audience in sync. Use our Leadership PowerPoint Templates because Our PowerPoint Templates and Slides are a sure bet. Gauranteed to win against all odds. Download our Shapes PowerPoint Templates because Our PowerPoint Templates and Slides help you meet the demand of the Market. Just browse and pick the slides that appeal to your intuitive senses. Download and present our Targets PowerPoint Templates because you should Whip up a frenzy with our PowerPoint Templates and Slides. They will fuel the excitement of your team. Present our Process and Flows PowerPoint Templates because Our PowerPoint Templates and Slides will generate and maintain the level of interest you desire. They will create the impression you want to imprint on your audience.Use these PowerPoint slides for presentations relating to Abstract, analysis, banner, blank, boxes, brochure, business, button, catalog, chart, circular, combination, combine, communication, company, competition, components, concept, diagram, different, display, finance, goal, illustration, information, link, marketing, mission, navigation, petals, pictogram, pie, plan, presentation, process, report, round, segment, strategy, tab, target, template, text, website. The prominent colors used in the PowerPoint template are Green, Gray, White.
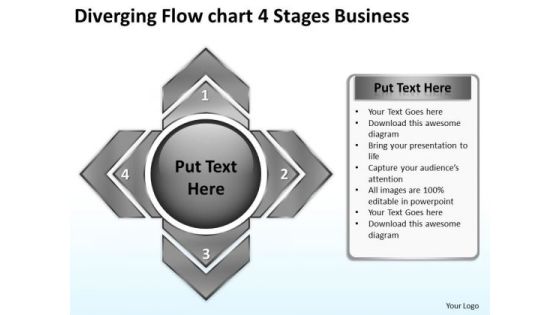
Flow Chart 4 Stages Free Business PowerPoint Templates 1 Circular Process Slides
We present our flow chart 4 stages free business powerpoint templates 1 Circular Process Slides.Use our Marketing PowerPoint Templates because our templates illustrates your ability. Download and present our Arrows PowerPoint Templates because you should Demonstrate how you think out of the box. Download and present our Flow charts PowerPoint Templates because it shows them how to persistently hit bullseye. Present our Shapes PowerPoint Templates because our cleverly selected background hues are guaranteed to achieve this aim. Use our Business PowerPoint Templates because like the famed William Tell, they put aside all emotions and concentrate on the target.Use these PowerPoint slides for presentations relating to Analysis, analyze, background, blank, business, businessman, center, central, chart component, concept, connect, core, decentralize, deploy, diagram, disperse disseminate, distribute, diverge, diverse, diversify, divide, education, element, empty expand, extend, flow, gist, group, industry, link, man, management, manager, part people, person, plan, process, scatter, separate, spread, strategy, support, surround teacher, template, transfer. The prominent colors used in the PowerPoint template are Black, Gray, White. Presenters tell us our flow chart 4 stages free business powerpoint templates 1 Circular Process Slides are Enchanting. Presenters tell us our center PowerPoint templates and PPT Slides are Quaint. PowerPoint presentation experts tell us our flow chart 4 stages free business powerpoint templates 1 Circular Process Slides are Liberated. We assure you our background PowerPoint templates and PPT Slides are Clever. Customers tell us our flow chart 4 stages free business powerpoint templates 1 Circular Process Slides are Graceful. People tell us our chart PowerPoint templates and PPT Slides effectively help you save your valuable time.

Flow Chart 4 Stages World Business PowerPoint Templates Radial Diagram Slides
We present our flow chart 4 stages world business powerpoint templates Radial Diagram Slides.Present our Arrows PowerPoint Templates because they are Designed to attract the attention of your audience. Use our Business PowerPoint Templates because it helps you to project your enthusiasm and single mindedness to your colleagues. Download and present our Flow Charts PowerPoint Templates because this is an excellent slide to detail and highlight your thought process, your views and your positive expectations.. Download our Shapes PowerPoint Templates because it helps to churn the mixture to the right degree and pound home your views and expectations in a spectacularly grand and virtuoso fluid performance. Download and present our Signs PowerPoint Templates because this diagram helps you to develop your marketing strategy and communicate your enthusiasm and motivation to raise the bar.Use these PowerPoint slides for presentations relating to Analysis, Analyze, Background, Blank, Business, Businessman, Center, Central, Chart, Component, Concept, Connect, Core, Decentralize, Deploy, Diagram, Disperse, Disseminate, Distribute, Diverge, Diverse, Diversify, Divide, Education, Element, Empty, Expand, Extend, Flow, Gist, Group, Industry, Link, Man, Management, Manager, Part, People, Person, Plan, Process, Scatter, Separate, Spread, Strategy, Support, Surround, Teacher, Template, Transfer. The prominent colors used in the PowerPoint template are Black, Green, Gray. We assure you our flow chart 4 stages world business powerpoint templates Radial Diagram Slides are Stunning. We assure you our Blank PowerPoint templates and PPT Slides are Versatile. Customers tell us our flow chart 4 stages world business powerpoint templates Radial Diagram Slides are Tasteful. Presenters tell us our Businessman PowerPoint templates and PPT Slides are Romantic. You can be sure our flow chart 4 stages world business powerpoint templates Radial Diagram Slides are aesthetically designed to attract attention. We guarantee that they will grab all the eyeballs you need. The feedback we get is that our Center PowerPoint templates and PPT Slides help you meet deadlines which are an element of today's workplace. Just browse and pick the slides that appeal to your intuitive senses.

Young Business People Pie Chart Marketing PowerPoint Templates Ppt Backgrounds For Slides
We present our young business people pie chart marketing PowerPoint templates PPT backgrounds for slides.Download our Business PowerPoint Templates because These PowerPoint Templates and Slides will give the updraft to your ideas. See them soar to great heights with ease. Present our Finance PowerPoint Templates because you can Set pulses racing with our PowerPoint Templates and Slides. They will raise the expectations of your team. Download and present our Marketing PowerPoint Templates because Your ideas provide food for thought. Our PowerPoint Templates and Slides will help you create a dish to tickle the most discerning palate. Use our People PowerPoint Templates because They will Put the wind in your sails. Skim smoothly over the choppy waters of the market. Download and present our Success PowerPoint Templates because Our PowerPoint Templates and Slides will embellish your thoughts. See them provide the desired motivation to your team.Use these PowerPoint slides for presentations relating to 3d, analysis, boardroom, business, cartoon, character, chart, clipart, committee, company, concept, corporate, council, directors, display, document, economics, executive, figure, finance, financial, group, growth, guy, human, management, market, meeting, performance, presentation, report, table, team. The prominent colors used in the PowerPoint template are Black, White, Gray. The feedback we get is that our young business people pie chart marketing PowerPoint templates PPT backgrounds for slides are designed by a team of presentation professionals. Professionals tell us our committee PowerPoint templates and PPT Slides help you meet deadlines which are an element of today's workplace. Just browse and pick the slides that appeal to your intuitive senses. PowerPoint presentation experts tell us our young business people pie chart marketing PowerPoint templates PPT backgrounds for slides are visually appealing. People tell us our character PowerPoint templates and PPT Slides are readymade to fit into any presentation structure. Presenters tell us our young business people pie chart marketing PowerPoint templates PPT backgrounds for slides will make the presenter successul in his career/life. Professionals tell us our chart PowerPoint templates and PPT Slides are effectively colour coded to prioritise your plans They automatically highlight the sequence of events you desire.

Business Diagram Colored 3d Flow Chart For Data Processing Presentation Template
Colored 3d flow chart has been used to design this power point template. This PPT contains the concept of data processing. Use this PPT for your data communication and analysis related presentations.

Stock Photo Black Brown Pie Chart For Business Result PowerPoint Slide
This high quality image is designed with pie chart. Use this image to make business reports. Use this outstanding image in presentations relating to data analysis and reports. Go ahead and add charm to your presentations.
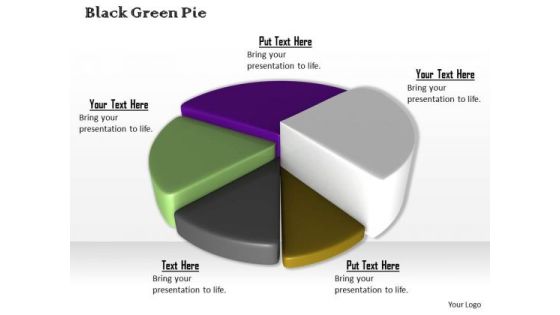
Stock Photo Colorful 3d Pie Chart For Business Result PowerPoint Slide
This high quality image is designed with pie chart. Use this image to make business reports. Use this outstanding image in presentations relating to data analysis and reports. Go ahead and add charm to your presentations.
Pie Chart Showing Three Phases Of Business Transformation Process Ppt PowerPoint Presentation Gallery Icon PDF
Showcasing this set of slides titled pie chart showing three phases of business transformation process ppt powerpoint presentation gallery icon pdf. The topics addressed in these templates are analysis phase, design phase, implementation phase. All the content presented in this PPT design is completely editable. Download it and make adjustments in color, background, font etc. as per your unique business setting.

Risk Probability And Impact Assessment Chart Ppt PowerPoint Presentation Show Smartart
Presenting this set of slides with name risk probability and impact assessment chart ppt powerpoint presentation show smartart. This is a two stage process. The stages in this process are control impact matrix, analysis strategic framework, risk assessment. This is a completely editable PowerPoint presentation and is available for immediate download. Download now and impress your audience.
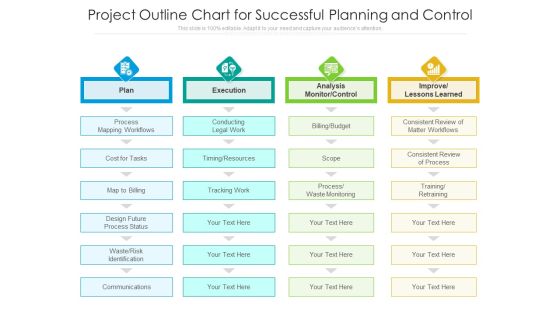
Project Outline Chart For Successful Planning And Control Ppt PowerPoint Presentation Gallery Slides PDF
Showcasing this set of slides titled project outline chart for successful planning and control ppt powerpoint presentation gallery slides pdf. The topics addressed in these templates are plan, execution, analysis monitor control. All the content presented in this PPT design is completely editable. Download it and make adjustments in color, background, font etc. as per your unique business setting.

Organization Chart And Corporate Model Transformation Restructuring Organization Results Elements PDF
This is an analysis carried out to capture the overall experience of the Restructuring Organization process. On the views such as strongly agree, agree, disagree, strongly disagree. Deliver an awe inspiring pitch with this creative organization chart and corporate model transformation restructuring organization results elements pdf bundle. Topics like effective, involvement, organizations can be discussed with this completely editable template. It is available for immediate download depending on the needs and requirements of the user.
Marketing Campaign Tracking Chart With Launch Platform Ppt Show Slides PDF
This slide covers the marketing campaign analysis sheet. It includes campaign details such as campaign name, status, platform, campaign category, start date, target audience, and audience stage. There are so many reasons you need a Marketing Campaign Tracking Chart With Launch Platform Ppt Show Slides PDF. The first reason is you can not spend time making everything from scratch, Thus, Slidegeeks has made presentation templates for you too. You can easily download these templates from our website easily.
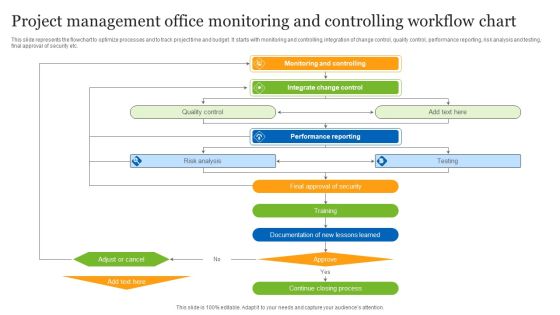
Project Management Office Monitoring And Controlling Workflow Chart Ppt Slides Mockup PDF
This slide represents the flowchart to optimize processes and to track project time and budget. It starts with monitoring and controlling, integration of change control, quality control, performance reporting, risk analysis and testing, final approval of security etc. Presenting Project Management Office Monitoring And Controlling Workflow Chart Ppt Slides Mockup PDF to dispense important information. This template comprises five stages. It also presents valuable insights into the topics including Monitoring And Controlling, Integrate Change Control, Performance Reporting. This is a completely customizable PowerPoint theme that can be put to use immediately. So, download it and address the topic impactfully.

Agile Model Improve Task Team Performance Agile Kanban Methodology Chart With Stories Guidelines PDF
This slide explains Kanban Methodology through a chart that shows User Story Details, Tasks to be done, Tasks in progress Product Development, Software Quality Check, Testing to be done Automation Processes, Cycle Time Analysis and the activities that are ready to be deployed. Deliver an awe inspiring pitch with this creative agile model improve task team performance agile kanban methodology chart with stories guidelines pdf bundle. Topics like security integration, product development, automation processes can be discussed with this completely editable template. It is available for immediate download depending on the needs and requirements of the user.

Gantt Chart For Interior Design Process And Development Procedure Management Diagrams PDF
The slide depicts a Gantt chart for interior designing project management which helps to track activities efficiently. It covers timeframe, project budget, resources, analysis and cost. Showcasing this set of slides titled Gantt Chart For Interior Design Process And Development Procedure Management Diagrams PDF. The topics addressed in these templates are Cost, Establish Budget, Development Procedure Management. All the content presented in this PPT design is completely editable. Download it and make adjustments in color, background, font etc. as per your unique business setting.

Various Billing Software Comparison Chart Ppt PowerPoint Presentation File Diagrams PDF
Following slide represents comparative analysis of various software for company billing system. It includes various parameters such as prices, installation, time tracking, individual invoices, expense tracking etc. Do you have an important presentation coming up Are you looking for something that will make your presentation stand out from the rest Look no further than Various Billing Software Comparison Chart Ppt PowerPoint Presentation File Diagrams PDF With our professional designs, you can trust that your presentation will pop and make delivering it a smooth process. And with Slidegeeks, you can trust that your presentation will be unique and memorable. So why wait Grab Various Billing Software Comparison Chart Ppt PowerPoint Presentation File Diagrams PDF today and make your presentation stand out from the rest.
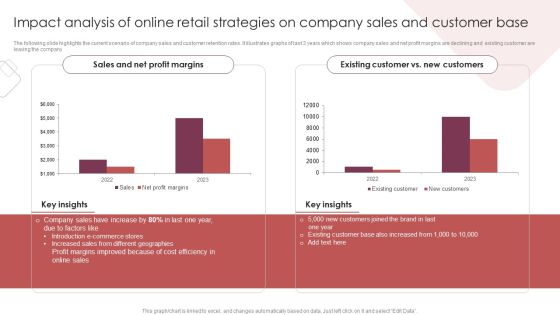
E Commerce Marketing Techniques To Boost Sales Impact Analysis Of Online Retail Strategies On Company Sales And Customer Base Slides PDF
The following slide highlights the current scenario of company sales and customer retention rates. It illustrates graphs of last 3 years which shows company sales and net profit margins are declining and existing customer are leaving the company. Explore a selection of the finest E Commerce Marketing Techniques To Boost Sales Impact Analysis Of Online Retail Strategies On Company Sales And Customer Base Slides PDF here. With a plethora of professionally designed and pre-made slide templates, you can quickly and easily find the right one for your upcoming presentation. You can use our E Commerce Marketing Techniques To Boost Sales Impact Analysis Of Online Retail Strategies On Company Sales And Customer Base Slides PDF to effectively convey your message to a wider audience. Slidegeeks has done a lot of research before preparing these presentation templates. The content can be personalized and the slides are highly editable. Grab templates today from Slidegeeks.

COVID 19 Risk Analysis Mitigation Policies Ocean Liner Sector Value Of Cruise Line Companies Has Plunged Due To COVID 19 Themes PDF
This slide shows the value of major cruise lines during the March 2019 to March 2020. it shows the values of Carnival corporation, Royal Caribbean, and Norwegian. Deliver an awe inspiring pitch with this creative covid 19 risk analysis mitigation policies ocean liner sector value of cruise line companies has plunged due to covid 19 themes pdf bundle. Topics like value of cruise line companies has plunged due to covid 19 can be discussed with this completely editable template. It is available for immediate download depending on the needs and requirements of the user.

Clustered Column Line Chart Finance Ppt PowerPoint Presentation Inspiration Design Templates
This is a clustered column line chart finance ppt powerpoint presentation inspiration design templates. This is a three stage process. The stages in this process are finance, analysis, business, investment, marketing.

break even chart showing contribution margin ppt powerpoint presentation professional templates
This is a break even chart showing contribution margin ppt powerpoint presentation professional templates. This is a two stage process. The stages in this process are break even point,break even analysis,break even level.

Volume Open High Low Close Chart Ppt PowerPoint Presentation Model Ideas
This is a volume open high low close chart ppt powerpoint presentation model ideas. This is a five stage process. The stages in this process are finance, marketing, analysis, business, investment.

Volume Open High Low Close Chart Finance Ppt PowerPoint Presentation Gallery Graphic Tips
This is a volume open high low close chart finance ppt powerpoint presentation gallery graphic tips. This is a two stage process. The stages in this process are finance, analysis, business, investment, marketing.

Volume Open High Low Close Chart Finance Ppt PowerPoint Presentation Professional Background Image
This is a volume open high low close chart finance ppt powerpoint presentation professional background image. This is a four stage process. The stages in this process are finance, analysis, business, investment, marketing.

Volume Open High Low Close Chart Finance Ppt PowerPoint Presentation Model Graphic Images
This is a volume open high low close chart finance ppt powerpoint presentation model graphic images. This is a three stage process. The stages in this process are finance, analysis, business, investment, marketing.
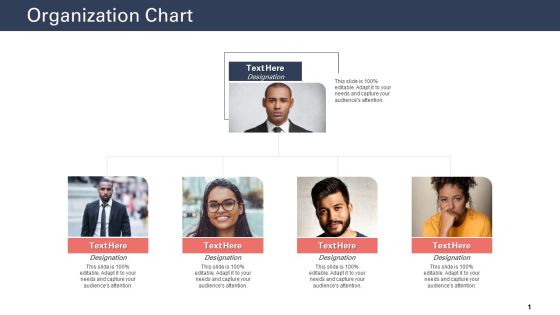
Techniques To Increase Customer Satisfaction Organization Chart Ppt Summary Design Templates PDF
Presenting techniques to increase customer satisfaction organization chart ppt summary design templates pdf to provide visual cues and insights. Share and navigate important information on four stages that need your due attention. This template can be used to pitch topics like organization chart. In addtion, this PPT design contains high resolution images, graphics, etc, that are easily editable and available for immediate download.

3 Project Groups Comparative Assessment Chart For Performance Evaluation Background PDF
Showcasing this set of slides titled 3 project groups comparative assessment chart for performance evaluation background pdf. The topics addressed in these templates are data analysis, data recovery, android development. All the content presented in this PPT design is completely editable. Download it and make adjustments in color, background, font etc. as per your unique business setting.

Volume High Low Close Chart Ppt PowerPoint Presentation Infographic Template Example File
Presenting this set of slides with name volume high low close chart ppt powerpoint presentation infographic template example file. The topics discussed in these slides are finance, marketing, management, investment, analysis. This is a completely editable PowerPoint presentation and is available for immediate download. Download now and impress your audience.
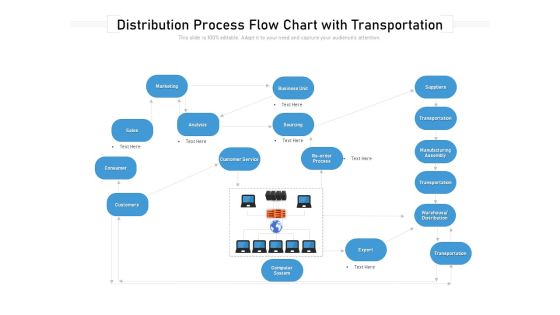
Distribution Process Flow Chart With Transportation Ppt PowerPoint Presentation Slides Deck PDF
Presenting distribution process flow chart with transportation ppt powerpoint presentation slides deck pdf to dispense important information. This template comprises one stages. It also presents valuable insights into the topics including business unit, suppliers,analysis, marketing, consumer, transportation, transportation, manufacturing assembly. This is a completely customizable PowerPoint theme that can be put to use immediately. So, download it and address the topic impactfully.
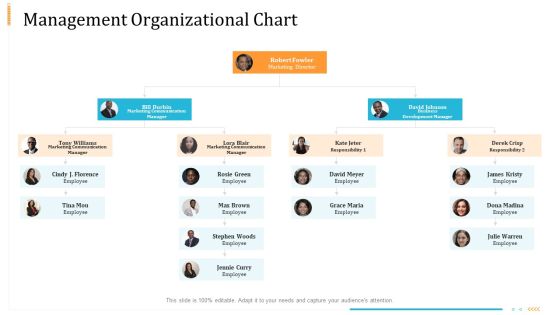
Enterprise Examination And Inspection Management Organizational Chart Ppt Inspiration Show PDF
Presenting enterprise examination and inspection management organizational chart ppt inspiration show pdf to provide visual cues and insights. Share and navigate important information on two stages that need your due attention. This template can be used to pitch topics like marketing, communication, development. In addtion, this PPT design contains high resolution images, graphics, etc, that are easily editable and available for immediate download.

Cpm Chart For Project Management Ppt PowerPoint Presentation Portfolio Background Image
This is a cpm chart for project management ppt powerpoint presentation portfolio background image. This is a eleven stage process. The stages in this process are critical path method, critical path analysis, cpm.
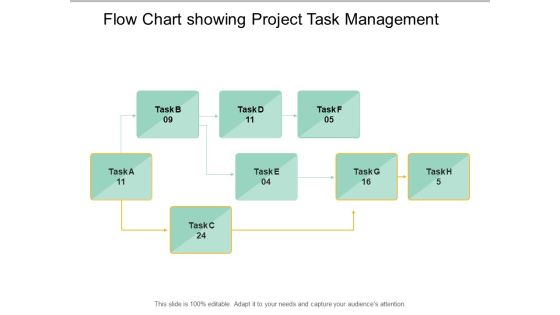
Flow Chart Showing Project Task Management Ppt PowerPoint Presentation Styles Smartart
This is a flow chart showing project task management ppt powerpoint presentation styles smartart. This is a eight stage process. The stages in this process are critical path method, critical path analysis, cpm.
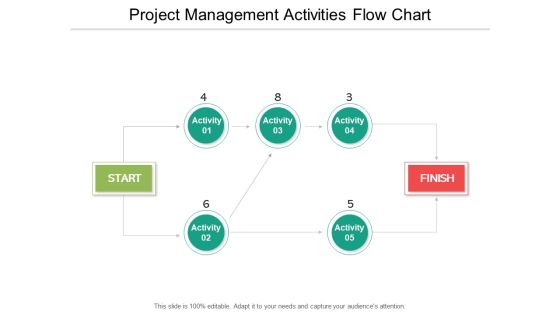
Project Management Activities Flow Chart Ppt PowerPoint Presentation File Example File
This is a project management activities flow chart ppt powerpoint presentation file example file. This is a seven stage process. The stages in this process are critical path method, critical path analysis, cpm.

Clustered Bar Chart Yearly Operating Plan Ppt PowerPoint Presentation Styles Icon
This is a clustered bar chart yearly operating plan ppt powerpoint presentation styles icon. This is a four stage process. The stages in this process are business, management, strategy, analysis, marketing.

Project Timeline For Strategic Planning Gantt Chart Ppt PowerPoint Presentation Professional Ideas
This is a project timeline for strategic planning gantt chart ppt powerpoint presentation professional ideas. This is a three stage process. The stages in this process are Business, Strategy, Marketing, Analysis, Table.
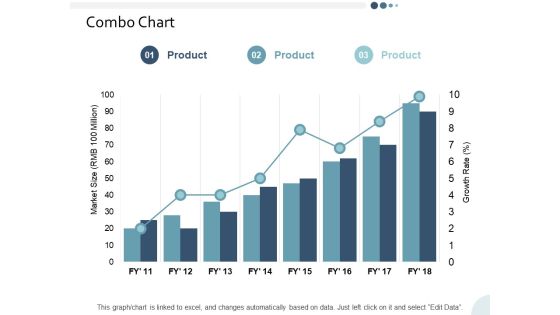
Combo Chart Yearly Operating Plan Ppt PowerPoint Presentation Infographic Template Skills
This is a combo chart yearly operating plan ppt powerpoint presentation infographic template skills. This is a three stage process. The stages in this process are business, management, strategy, analysis, marketing.

Scatter Bubble Chart Highest Sale Ppt PowerPoint Presentation Show Slide Download
This is a scatter bubble chart highest sale ppt powerpoint presentation show slide download. This is a two stage process. The stages in this process are finance, investment, analysis, business, marketing.

Column Chart Employee Value Proposition Ppt PowerPoint Presentation Slides Graphics Design
This is a column chart employee value proposition ppt powerpoint presentation slides graphics design. This is a two stage process. The stages in this process are business, management, strategy, analysis, marketing.

Donut Pie Chart Sample Budget Ppt Ppt PowerPoint Presentation Layouts Styles
This is a donut pie chart sample budget ppt ppt powerpoint presentation layouts styles. This is a four stage process. The stages in this process are business, management, strategy, analysis, marketing.

Business Performance Evaluation And Feedback Flow Chart Ppt Powerpoint Presentation Model Example Topics
This is a business performance evaluation and feedback flow chart ppt powerpoint presentation model example topics. This is a three stage process. The stages in this process are performance management, structure conduct performance, performance review and analysis.

Pie Of Pie Chart Finance Ppt Powerpoint Presentation File Design Templates
This is a pie of pie chart finance ppt powerpoint presentation file design templates. This is a four stage process. The stages in this process are finance, marketing, management, investment, analysis.

Donut Chart Finance Marketing Ppt Powerpoint Presentation Infographics Skills Ppt Powerpoint Presentation File Skills
This is a donut chart finance marketing ppt powerpoint presentation infographics skills ppt powerpoint presentation file skills. This is a four stage process. The stages in this process are finance, marketing, management, investment, analysis.
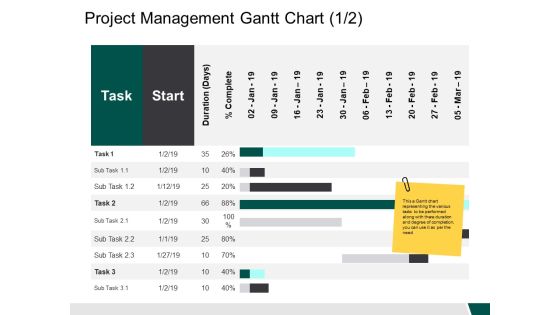
Project Management Gantt Chart Start Ppt PowerPoint Presentation Outline Example Introduction
This is a project management gantt chart start ppt powerpoint presentation outline example introduction. This is a two stage process. The stages in this process are business, management, strategy, analysis, marketing.

Donut Pie Chart Marketing Ppt Powerpoint Presentation Infographic Template Graphics Template
This is a donut pie chart marketing ppt powerpoint presentation infographic template graphics template. This is a six stage process. The stages in this process are finance, marketing, management, investment, analysis.

Agile Technique To Lawful Pitch And Proposals IT Legal Project Management Gantt Chart Slides PDF
Design a highly optimized project management report using this well-researched agile technique to lawful pitch and proposals it legal project management gantt chart slides pdf. This layout can be used to present the professional details of a task or activity. Showcase the activities allocated to the business executives with this Gantt Chart PowerPoint theme. List down the column tasks in various timeframes and allocate time for each. In addition, also monitor the actual time and make comparisons to interpret the final progress using this innovative Gantt Chart Template. Showcase the work breakdown structure to attract your audience. Download and share it using Google Slides, if it suits your requirement.

7 Sections Pie Chart For Data Comparison Ppt PowerPoint Presentation File Graphics Template
This is a 7 sections pie chart for data comparison ppt powerpoint presentation file graphics template. This is a seven stage process. The stages in this process are 6 piece pie chart, 6 segment pie chart, 6 parts pie chart.

8 Sections Pie Chart For Data Comparison Ppt PowerPoint Presentation Show Slideshow
This is a 8 sections pie chart for data comparison ppt powerpoint presentation show slideshow. This is a eight stage process. The stages in this process are 6 piece pie chart, 6 segment pie chart, 6 parts pie chart.

Six Sections Pie Chart For Data Comparison Ppt PowerPoint Presentation Styles Graphics Example
This is a six sections pie chart for data comparison ppt powerpoint presentation styles graphics example. This is a six stage process. The stages in this process are 6 piece pie chart, 6 segment pie chart, 6 parts pie chart.

8 Segments Pie Chart For Data Representation Ppt PowerPoint Presentation Infographics Design Templates
This is a 8 segments pie chart for data representation ppt powerpoint presentation infographics design templates. This is a eight stage process. The stages in this process are 6 piece pie chart, 6 segment pie chart, 6 parts pie chart.

6 Segments Pie Chart For Data Representation Ppt PowerPoint Presentation Icon Graphics
This is a 6 segments pie chart for data representation ppt powerpoint presentation icon graphics. This is a six stage process. The stages in this process are 6 piece pie chart, 6 segment pie chart, 6 parts pie chart.

6 Piece Pie Chart For Data Representation Ppt PowerPoint Presentation Professional Brochure
This is a 6 piece pie chart for data representation ppt powerpoint presentation professional brochure. This is a six stage process. The stages in this process are 6 piece pie chart, 6 segment pie chart, 6 parts pie chart.

7 Piece Pie Chart For Data Representation Ppt PowerPoint Presentation Portfolio Graphics
This is a 7 piece pie chart for data representation ppt powerpoint presentation portfolio graphics. This is a seven stage process. The stages in this process are 6 piece pie chart, 6 segment pie chart, 6 parts pie chart.

7 Segments Pie Chart For Data Representation Ppt PowerPoint Presentation Styles Summary
This is a 7 segments pie chart for data representation ppt powerpoint presentation styles summary. This is a seven stage process. The stages in this process are 6 piece pie chart, 6 segment pie chart, 6 parts pie chart.

8 Piece Pie Chart For Data Representation Ppt PowerPoint Presentation Ideas
This is a 8 piece pie chart for data representation ppt powerpoint presentation ideas. This is a eight stage process. The stages in this process are 6 piece pie chart, 6 segment pie chart, 6 parts pie chart.
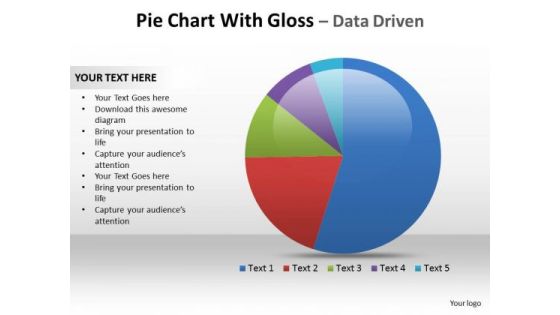
Business Marketing PowerPoint Templates Business Pie Chart With Gloss Ppt Slides
Business Marketing PowerPoint Templates Business pie chart with gloss PPT Slides-This PowerPoint pie chart template is fully data driven. The designer 3D pie charts are bevelled. Borders and gloss are added to some of the pie graphs to add that extra impact. -Business Marketing PowerPoint Templates Business pie chart with gloss PPT Slides-This ppt can be used for concepts relating to- pie graphs, pie charts and donut charts.
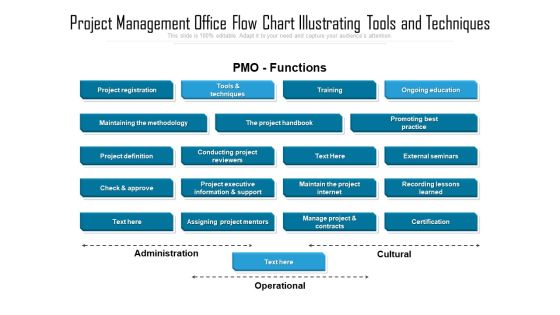
Project Management Office Flow Chart Illustrating Tools And Techniques Slides PDF
Presenting project management office flow chart illustrating tools and techniques slides pdf to dispense important information. This template comprises one stage. It also presents valuable insights into the topics including promoting best practice, project executive information, project internet. This is a completely customizable PowerPoint theme that can be put to use immediately. So, download it and address the topic impactfully.
Histogram Column Chart With Red Arrow Vector Icon Ppt PowerPoint Presentation Outline Ideas Cpb
This is a histogram column chart with red arrow vector icon ppt powerpoint presentation outline ideas cpb. This is a three stage process. The stages in this process are bar chart icon, bar graph icon, data chart icon.
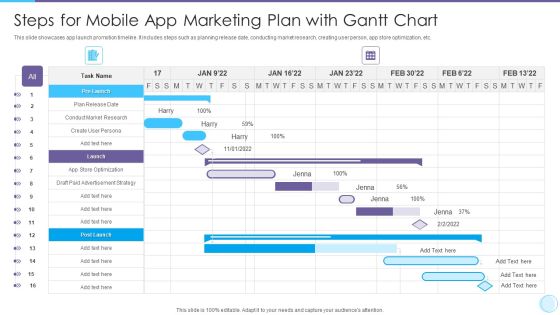
Steps For Mobile App Marketing Plan With Gantt Chart Rules PDF
Your complex projects can be managed and organized simultaneously using this detailed Steps For Mobile App Marketing Plan With Gantt Chart Rules PDF template. Track the milestones, tasks, phases, activities, and subtasks to get an updated visual of your project. Share your planning horizon and release plan with this well crafted presentation template. This exemplary template can be used to plot various dependencies to distinguish the tasks in the pipeline and their impact on the schedules and deadlines of the project. Apart from this, you can also share this visual presentation with your team members and stakeholders. It a resourceful tool that can be incorporated into your business structure. Therefore, download and edit it conveniently to add the data and statistics as per your requirement

Gantt Chart For Electrical Engineering Services Proposal Ppt Layouts Layout PDF
Your complex projects can be managed and organized simultaneously using this detailed gantt chart for electrical engineering services proposal ppt layouts layout pdf template. Track the milestones, tasks, phases, activities, and subtasks to get an updated visual of your project. Share your planning horizon and release plan with this well-crafted presentation template. This exemplary template can be used to plot various dependencies to distinguish the tasks in the pipeline and their impact on the schedules and deadlines of the project. Apart from this, you can also share this visual presentation with your team members and stakeholders. It a resourceful tool that can be incorporated into your business structure. Therefore, download and edit it conveniently to add the data and statistics as per your requirement.

One Page For Reconstructing Roster And NFL Depth Chart PDF Document PPT Template
Heres a predesigned One Page For Reconstructing Roster And NFL Depth Chart PDF Document PPT Template for you. Built on extensive research and analysis, this one-pager template has all the centerpieces of your specific requirements. This temple exudes brilliance and professionalism. Being completely editable, you can make changes to suit your purpose. Get this One Page For Reconstructing Roster And NFL Depth Chart PDF Document PPT Template Download now.
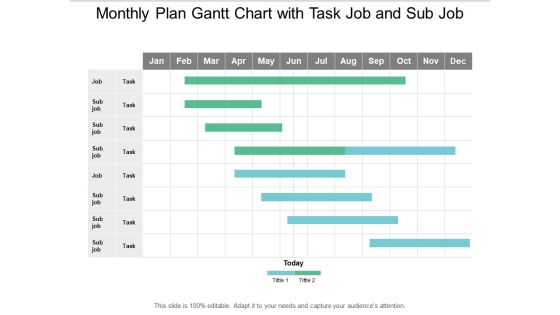
Monthly Plan Gantt Chart With Task Job And Sub Job Ppt PowerPoint Presentation Infographic Template Mockup
This is a monthly plan gantt chart with task job and sub job ppt powerpoint presentation infographic template mockup. The topics discussed in this diagram are critical path method, critical path analysis, cpm. This is a completely editable PowerPoint presentation, and is available for immediate download.
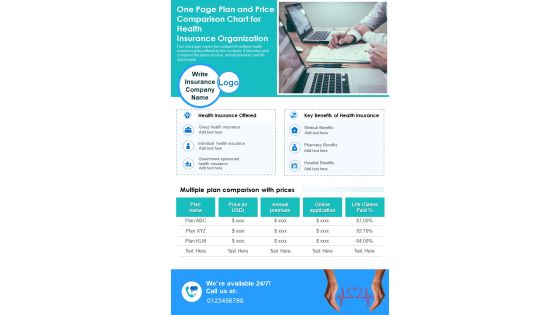
One Page Plan And Price Comparison Chart For Health Insurance Organization PDF Document PPT Template
Heres a predesigned One Page Plan And Price Comparison Chart For Health Insurance Organization PDF Document PPT Template for you. Built on extensive research and analysis, this one-pager template has all the centerpieces of your specific requirements. This temple exudes brilliance and professionalism. Being completely editable, you can make changes to suit your purpose. Get this One Page Plan And Price Comparison Chart For Health Insurance Organization PDF Document PPT Template Download now.
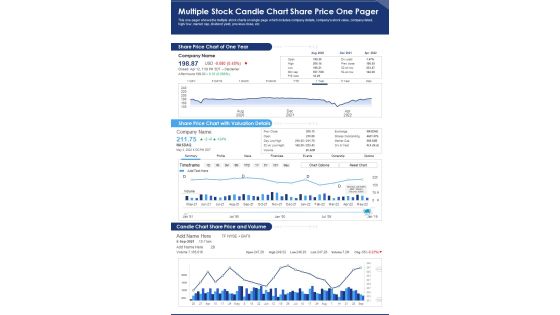
Multiple Stock Candle Chart Share Price One Pager PDF Document PPT Template
Heres a predesigned Multiple Stock Candle Chart Share Price One Pager PDF Document PPT Template for you. Built on extensive research and analysis, this one-pager template has all the centerpieces of your specific requirements. This temple exudes brilliance and professionalism. Being completely editable, you can make changes to suit your purpose. Get this Multiple Stock Candle Chart Share Price One Pager PDF Document PPT Template Download now.

Gantt Chart Showing Critical And Flexible Task Planning Ppt PowerPoint Presentation Model Shapes
This is a gantt chart showing critical and flexible task planning ppt powerpoint presentation model shapes. The topics discussed in this diagram are critical path method, critical path analysis, cpm. This is a completely editable PowerPoint presentation, and is available for immediate download.

Various Project Progress Chart On Daily Basis Ppt PowerPoint Presentation Gallery Brochure PDF
Showcasing this set of slides titled various project progress chart on daily basis ppt powerpoint presentation gallery brochure pdf. The topics addressed in these templates are analysis, development, design. All the content presented in this PPT design is completely editable. Download it and make adjustments in color, background, font etc. as per your unique business setting.
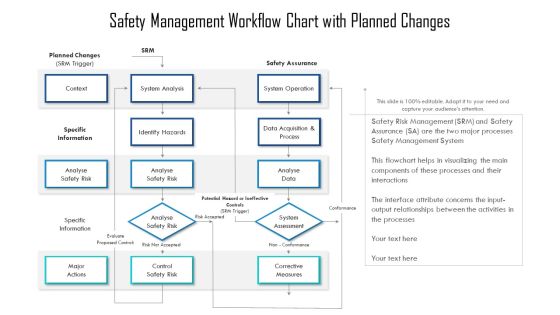
Safety Management Workflow Chart With Planned Changes Ppt PowerPoint Presentation Pictures Graphics PDF
Showcasing this set of slides titled safety management workflow chart with planned changes ppt powerpoint presentation pictures graphics pdf. The topics addressed in these templates are identify hazards, analyse safety risk, system analysis. All the content presented in this PPT design is completely editable. Download it and make adjustments in color, background, font etc. as per your unique business setting.

Data Integration Process Flow Chart Ppt PowerPoint Presentation File Templates PDF
Presenting this set of slides with name data integration process flow chart ppt powerpoint presentation file templates pdf. This is a six stage process. The stages in this process are actions, integration, analysis. This is a completely editable PowerPoint presentation and is available for immediate download. Download now and impress your audience.
Software Comparison Chart With Features Ppt PowerPoint Presentation Icon Slide Download
Presenting this set of slides with name software comparison chart with features ppt powerpoint presentation icon slide download. The topics discussed in these slides are linux operating system, cloud storage, realtime data analysis. This is a completely editable PowerPoint presentation and is available for immediate download. Download now and impress your audience.
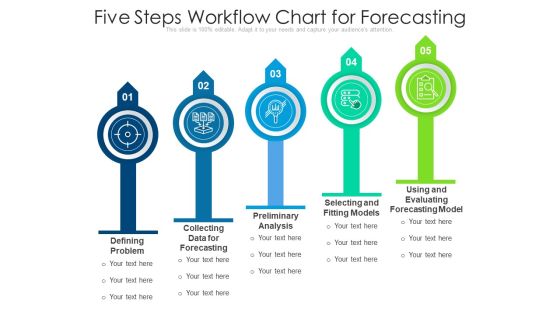
Five Steps Workflow Chart For Forecasting Ppt PowerPoint Presentation Outline Designs Download PDF
Presenting five steps workflow chart for forecasting ppt powerpoint presentation outline designs download pdf to dispense important information. This template comprises five stages. It also presents valuable insights into the topics including collecting data for forecasting, preliminary analysis, selecting and fitting models. This is a completely customizable PowerPoint theme that can be put to use immediately. So, download it and address the topic impactfully.

90 Day Plan Gantt Chart Template Ppt PowerPoint Presentation Outline Graphics
Presenting this set of slides with name 90 day plan gantt chart template ppt powerpoint presentation outline graphics. The topics discussed in these slides are 30 60 90 action plan, business analysis, business strategy. This is a completely editable PowerPoint presentation and is available for immediate download. Download now and impress your audience.

AAR Process Chart Activity Begin End Ppt PowerPoint Presentation File Icon
Presenting this set of slides with name aar process chart activity begin end ppt powerpoint presentation file icon. The topics discussed in these slides are after action review, performance analysis, future performances. This is a completely editable PowerPoint presentation and is available for immediate download. Download now and impress your audience.
Employee Orientation Workflow Chart With Outcome Ppt PowerPoint Presentation Icon Inspiration PDF
Presenting this set of slides with name employee orientation workflow chart with outcome ppt powerpoint presentation icon inspiration pdf. The topics discussed in these slides are analysis, knowledge, validation. This is a completely editable PowerPoint presentation and is available for immediate download. Download now and impress your audience.

Gantt Chart For Thesis Writing And Research Process Ppt PowerPoint Presentation Gallery Show PDF
Presenting this set of slides with name gantt chart for thesis writing and research process ppt powerpoint presentation gallery show pdf. The topics discussed in these slides are planning, data collection, analysis. This is a completely editable PowerPoint presentation and is available for immediate download. Download now and impress your audience.
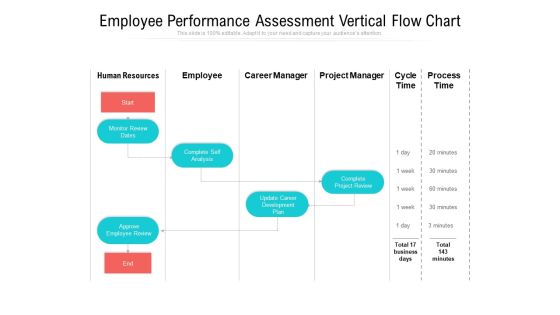
Employee Performance Assessment Vertical Flow Chart Ppt PowerPoint Presentation File Slide Download PDF
Presenting employee performance assessment vertical flow chart ppt powerpoint presentation file slide download pdf to dispense important information. This template comprises one stages. It also presents valuable insights into the topics including human resources, analysis, process. This is a completely customizable PowerPoint theme that can be put to use immediately. So, download it and address the topic impactfully.

User Service Support Workflow Chart Ppt PowerPoint Presentation Gallery Infographics PDF
Presenting this set of slides with name user service support workflow chart ppt powerpoint presentation gallery infographics pdf. This is a one stage process. The stages in this process are management, technical, analysis. This is a completely editable PowerPoint presentation and is available for immediate download. Download now and impress your audience.

Working Capital Management Process Flow Chart Ppt PowerPoint Presentation File Graphics Pictures PDF
Presenting this set of slides with name working capital management process flow chart ppt powerpoint presentation file graphics pictures pdf. This is a twelve stage process. The stages in this process are analysis, sales, exception. This is a completely editable PowerPoint presentation and is available for immediate download. Download now and impress your audience.
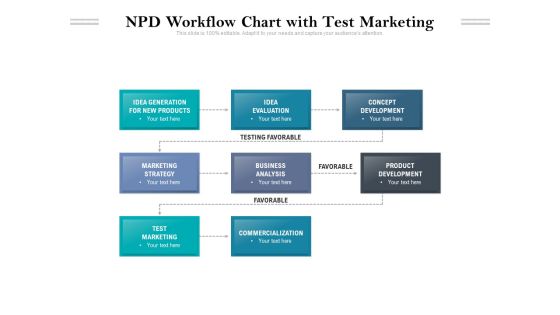
NPD Workflow Chart With Test Marketing Ppt PowerPoint Presentation File Aids PDF
Presenting this set of slides with name npd workflow chart with test marketing ppt powerpoint presentation file aids pdf. This is a eight stage process. The stages in this process are development, evaluation, analysis. This is a completely editable PowerPoint presentation and is available for immediate download. Download now and impress your audience.

Personal Interview Costing Assessment Chart Ppt PowerPoint Presentation File Graphics Template PDF
Showcasing this set of slides titled personal interview costing assessment chart ppt powerpoint presentation file graphics template pdf. The topics addressed in these templates are analysis, cost, researcher. All the content presented in this PPT design is completely editable. Download it and make adjustments in color, background, font etc. as per your unique business setting.

Cycle Time Chart With Number Of Work Operations Ppt PowerPoint Presentation Pictures Information PDF
Pitch your topic with ease and precision using this cycle time chart with number of work operations ppt powerpoint presentation pictures information pdf. This layout presents information on analysis, operation, product, inefficient procedures, drilling and tapping. It is also available for immediate download and adjustment. So, changes can be made in the color, design, graphics or any other component to create a unique layout.

8 Segments Pie Chart For Graphical Display Of Data Ppt PowerPoint Presentation Infographic Template Templates
This is a 8 segments pie chart for graphical display of data ppt powerpoint presentation infographic template templates. This is a eight stage process. The stages in this process are 6 piece pie chart, 6 segment pie chart, 6 parts pie chart.

6 Segments Pie Chart For Graphical Display Of Data Ppt PowerPoint Presentation Portfolio Rules
This is a 6 segments pie chart for graphical display of data ppt powerpoint presentation portfolio rules. This is a six stage process. The stages in this process are 6 piece pie chart, 6 segment pie chart, 6 parts pie chart.
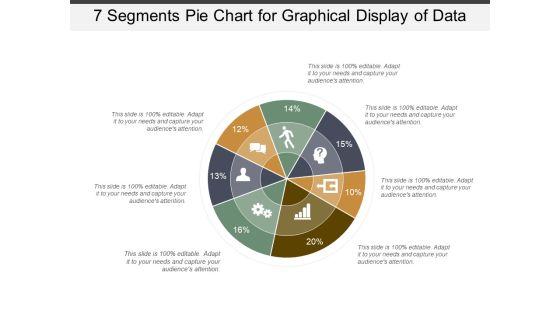
7 Segments Pie Chart For Graphical Display Of Data Ppt PowerPoint Presentation Model Elements
This is a 7 segments pie chart for graphical display of data ppt powerpoint presentation model elements. This is a seven stage process. The stages in this process are 6 piece pie chart, 6 segment pie chart, 6 parts pie chart.

Ppt Power Point Org Chart Shaped Arrows 6 Segments PowerPoint Templates
PPT power point org chart shaped arrows 6 segments PowerPoint Templates-This Organizational chart makes information accessible throughout the organization with a collective, visible view of critical data from different perspectives and providing the tools to upcoming business scenarios and plan for change.-PPT power point org chart shaped arrows 6 segments PowerPoint Templates-Abstract, Around, Arrow, Arrow Circles, Chart, Circle, Circular, Circular Arrows, Circular Flow, Circulation, Cycle, Cyclic, Direction, Element, Flow, Icon, Illustration, Isolated, Motion, Movement, Refresh, Ring, Rotation, Round, Section, Set, Shape, Sign, Symbol
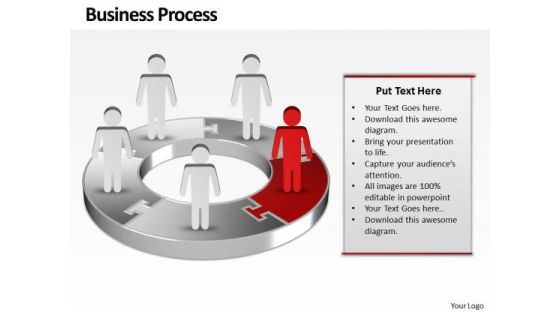
Ppt Red Men Standing On Business PowerPoint Theme Pie Chart Templates
PPT red men standing on business powerpoint theme pie chart Templates-Use this graphical approach to represent global business issues such as financial data, stock market Exchange, increase in sales, corporate presentations and more.-PPT red men standing on business powerpoint theme pie chart Templates-3d, arrow, background, blue, chart, circle, circular, clipart, colorful, connection, continuity, cycle, cyclic, diagram, direction, flow, graph, icon, illustration, isolated, loop, motion, process, progress, recycle, ring, round, step, sticker, symbol, teamwork, template, turn, vector
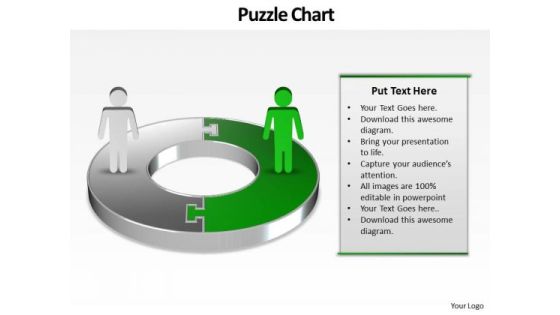
Ppt Green PowerPoint Slide Man On Circular Gantt Chart Template Templates
PPT green powerpoint slide man on circular gantt chart template Templates-This PowerPoint Diagram shows you the Circular way to represent Business components or losses in Business related Activities. This PowerPoint Diagram can be use in Investor presentations for Initial Public Offerings, Annual general meetings and financial seminars.-PPT green powerpoint slide man on circular gantt chart template Templates-abstract, accounting, background, business, businessman, chart, company, connection, corporate, diagram, earnings, finance, forecast, graph, growth, investment, management, network, people, profit, progress, puzzle, shapes, team, technology, vector, wealth

Ppt Red World Business Layouts People Stand On Circular Chart PowerPoint Templates
PPT red world business layouts people stand on circular chart PowerPoint Templates-This 3D PowerPoint Diagram shows the Three interconnected stages represented by first Red Quadrant. It signifies the concept of aspect, attribute, bearing, complexion, component, differentia, disposition, distinction, earmark, essence, essential etc.-PPT red world business layouts people stand on circular chart PowerPoint Templates-abstract, accounting, background, business, businessman, chart, company, connection, corporate, diagram, earnings, finance, forecast, graph, growth, investment, management, network, people, profit, progress, puzzle, shapes, team, technology, vector, wealth

Of Procedure Having 6 Stages Ppt Technical Support Process Flow Chart PowerPoint Templates
We present our of procedure having 6 stages ppt technical support process flow chart PowerPoint templates.Present our Leadership PowerPoint Templates because this diagram can be used to illustrate the logical path or system. Download and present our Arrows PowerPoint Templates because this slide depicts the occasion for gifting and giving. Use our Process and Flows PowerPoint Templates because you will be able to Highlight the various ways in which we can maintain its efficiency. Download our Business PowerPoint Templates because your product has established a foothold in the market. Customers are happy with the value it brings to their lives. Present our Circle Charts PowerPoint Templates because you can Bullet-point your thoughts and ideas to profitably accomplish every step of every stage along the way.Use these PowerPoint slides for presentations relating to Analysis, Analyze, Argument, Argumentation, Black, Business, Calculation, Concept, Criticism, Critique, Detection, Discussion, Dispute, Examination, Experiment, Interpretation, Interview, Know, Learning, Loupe, Magnification, Magnify, Magnifying, Operation, Problem, Procedure, Strategy, Technical, Verification. The prominent colors used in the PowerPoint template are Blue, Gray, Black. People tell us our of procedure having 6 stages ppt technical support process flow chart PowerPoint templates are Stunning. PowerPoint presentation experts tell us our Calculation PowerPoint templates and PPT Slides are Luxuriant. Presenters tell us our of procedure having 6 stages ppt technical support process flow chart PowerPoint templates are Efficient. The feedback we get is that our Black PowerPoint templates and PPT Slides provide you with a vast range of viable options. Select the appropriate ones and just fill in your text. You can be sure our of procedure having 6 stages ppt technical support process flow chart PowerPoint templates look good visually. Professionals tell us our Argument PowerPoint templates and PPT Slides are Luxuriant.

Pie Chart Business Diagram 10 Stages Ppt Plan Example PowerPoint Templates
We present our pie chart business diagram 10 stages ppt plan example PowerPoint templates.Download our Flow Charts PowerPoint Templates because Our PowerPoint Templates and Slides ensures Effective communication. They help you put across your views with precision and clarity. Download our Process and Flows PowerPoint Templates because It is Aesthetically crafted by artistic young minds. Our PowerPoint Templates and Slides are designed to display your dexterity. Download our Marketing PowerPoint Templates because You are an avid believer in ethical practices. Highlight the benefits that accrue with our PowerPoint Templates and Slides. Download and present our Business PowerPoint Templates because Our PowerPoint Templates and Slides ensures Effective communication. They help you put across your views with precision and clarity. Present our Shapes PowerPoint Templates because Our PowerPoint Templates and Slides will let your team Walk through your plans. See their energy levels rise as you show them the way.Use these PowerPoint slides for presentations relating to Graph, icon, market, isolated, statistics, percent, economics, ten, economy, display, business, render, success, presentation,diagram, circle, data, analyst, analysis, bank, report, calculation, accounting, trend, illustration, three, piece, pie, circular, chart, money, dimensional, clipart,accountant, growth, colorful, competition, account, stats, profit, part, information, background, improvement, financial. The prominent colors used in the PowerPoint template are White, Green, Black.

Chart Business Diagram 10 Stages Ppt Non Profit Plan Template PowerPoint Slides
We present our chart business diagram 10 stages ppt non profit plan template PowerPoint Slides.Use our Process and Flows PowerPoint Templates because You should Ascend the ladder of success with ease. Our PowerPoint Templates and Slides will provide strong and sturdy steps. Use our Circle Charts PowerPoint Templates because you should Whip up a frenzy with our PowerPoint Templates and Slides. They will fuel the excitement of your team. Use our Business PowerPoint Templates because Timeline crunches are a fact of life. Meet all deadlines using our PowerPoint Templates and Slides. Download and present our Marketing PowerPoint Templates because Our PowerPoint Templates and Slides are topically designed to provide an attractive backdrop to any subject. Download and present our Shapes PowerPoint Templates because you can Add colour to your speech with our PowerPoint Templates and Slides. Your presentation will leave your audience speechless.Use these PowerPoint slides for presentations relating to Chart, pie, graph, market, economics, economy, target, business, concept, success, diagram, circle, percentage, graphic, finance, revenue, element, analysis, report, marketing, modern, illustration, icon, earnings,, growth, ratio, progress, credit, commerce, statistic. The prominent colors used in the PowerPoint template are Blue , Gray, Black.
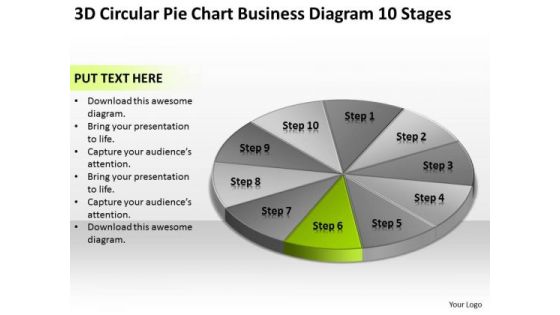
Pie Chart Business Diagram 10 Stages Creating Small Plan PowerPoint Slides
We present our pie chart business diagram 10 stages creating small plan PowerPoint Slides.Present our Flow Charts PowerPoint Templates because Our PowerPoint Templates and Slides will provide you a launch platform. Give a lift off to your ideas and send them into orbit. Present our Process and Flows PowerPoint Templates because Our PowerPoint Templates and Slides will give good value for money. They also have respect for the value of your time. Present our Marketing PowerPoint Templates because Our PowerPoint Templates and Slides will fulfill your every need. Use them and effectively satisfy the desires of your audience. Use our Business PowerPoint Templates because It will mark the footprints of your journey. Illustrate how they will lead you to your desired destination. Download our Shapes PowerPoint Templates because They will bring a lot to the table. Their alluring flavours will make your audience salivate.Use these PowerPoint slides for presentations relating to Graph, icon, market, isolated, statistics, percent, economics, ten, economy, display, business, render, success, presentation,diagram, circle, data, analyst, analysis, bank, report, calculation, accounting, trend, illustration, three, piece, pie, circular, chart, money, dimensional, clipart,accountant, growth, colorful, competition, account, stats, profit, part, information, background, improvement, financial. The prominent colors used in the PowerPoint template are Gray, Green, Black.

10 Stages Chart Implementation Of Donut Diagram Ppt Need Business Plan PowerPoint Templates
We present our 10 stages chart implementation of donut diagram ppt need business plan PowerPoint templates.Download and present our Communication PowerPoint Templates because Our PowerPoint Templates and Slides will let your team Walk through your plans. See their energy levels rise as you show them the way. Use our Advertising PowerPoint Templates because You can safely bank on our PowerPoint Templates and Slides. They will provide a growth factor to your valuable thoughts. Present our Circle Charts PowerPoint Templates because It can Conjure up grand ideas with our magical PowerPoint Templates and Slides. Leave everyone awestruck by the end of your presentation. Download our Business PowerPoint Templates because It is Aesthetically crafted by artistic young minds. Our PowerPoint Templates and Slides are designed to display your dexterity. Download our Shapes PowerPoint Templates because Watching this your Audience will Grab their eyeballs, they wont even blink.Use these PowerPoint slides for presentations relating to Chart, business, donut, market, sales, document, economy, display, corporate, income, concept, success, presentation, symbol, diagram, percentage, graphic, finance, analysis, report, marketing, accounting, management, graph, forecast, design, growth, competition, progress, profit, information, trade, investment, statistic, financial, infographics, 3d. The prominent colors used in the PowerPoint template are Green, White, Blue.

Structural And Relationship Chart 10 Stages Ppt Business Planning PowerPoint Templates
We present our structural and relationship chart 10 stages ppt business planning PowerPoint templates.Present our Process and Flows PowerPoint Templates because Our PowerPoint Templates and Slides are Clear and concise. Use them and dispel any doubts your team may have. Download our Flow Charts PowerPoint Templates because You can Double your output with our PowerPoint Templates and Slides. They make beating deadlines a piece of cake. Use our Education PowerPoint Templates because Our PowerPoint Templates and Slides will definately Enhance the stature of your presentation. Adorn the beauty of your thoughts with their colourful backgrounds. Download and present our Shapes PowerPoint Templates because You can Flag mark the road ahead with our PowerPoint Templates and Slides. They will unfurl your brilliant plans to your audience. Download our Marketing PowerPoint Templates because Our PowerPoint Templates and Slides will let Your superior ideas hit the target always and everytime.Use these PowerPoint slides for presentations relating to Mark, corporate, business, plan, concept, bright, symbol, diagram, crayon, stack, graphic, finance, stock,analysis, drawing, paint, calculation, accounting, creative, economic, creativity, chart, forecast, design, color, objects, stationary, pencil, education,profit, information, background, investment, figures, ten, business, business process. The prominent colors used in the PowerPoint template are Green, Gray, Black.

Structural And Relationship Chart 10 Stages Ppt One Page Business Plan PowerPoint Templates
We present our structural and relationship chart 10 stages ppt one page business plan PowerPoint templates.Download and present our Business PowerPoint Templates because Our PowerPoint Templates and Slides will fulfill your every need. Use them and effectively satisfy the desires of your audience. Download and present our Flow Charts PowerPoint Templates because Our PowerPoint Templates and Slides are conceived by a dedicated team. Use them and give form to your wondrous ideas. Download and present our Shapes PowerPoint Templates because It can Bubble and burst with your ideas. Use our Marketing PowerPoint Templates because You have a driving passion to excel in your field. Our PowerPoint Templates and Slides will prove ideal vehicles for your ideas. Download and present our Process and Flows PowerPoint Templates because Our PowerPoint Templates and Slides are created by a hardworking bunch of busybees. Always flitting around with solutions gauranteed to please.Use these PowerPoint slides for presentations relating to Market, isolated, rate, mark, corporate, row, business, plan, concept, bright, symbol, diagram, crayon, stack, graphic, finance, stock,analysis, drawing, paint, calculation, accounting, creative, economic, creativity, chart, forecast, design, color, objects, stationary, pencil, education,profit, information, background, investment, figures, rainbow, financial, artist, capital, business, business process. The prominent colors used in the PowerPoint template are Green, Blue, Black.

Structural And Relationship Chart 10 Stages Ppt Help With Business Plan PowerPoint Templates
We present our structural and relationship chart 10 stages ppt help with business plan PowerPoint templates.Use our Education PowerPoint Templates because You are an avid believer in ethical practices. Highlight the benefits that accrue with our PowerPoint Templates and Slides. Download our Process and Flows PowerPoint Templates because You can Double your output with our PowerPoint Templates and Slides. They make beating deadlines a piece of cake. Use our Flow Charts PowerPoint Templates because It is Aesthetically crafted by artistic young minds. Our PowerPoint Templates and Slides are designed to display your dexterity. Use our Marketing PowerPoint Templates because You can Connect the dots. Fan expectations as the whole picture emerges. Download and present our Business PowerPoint Templates because Our PowerPoint Templates and Slides will let you Clearly mark the path for others to follow.Use these PowerPoint slides for presentations relating to Mark, corporate, business, plan, concept, bright, symbol, diagram, crayon, stack, graphic, finance, stock,analysis, drawing, paint, calculation, accounting, creative, economic, creativity, chart, forecast, design, color, objects, stationary, pencil, education,profit, information, background, investment, figures, ten, business, business process. The prominent colors used in the PowerPoint template are Black, Green, Gray.

Structural And Relationship Chart 10 Stages Ppt Samples Business Plan PowerPoint Slides
We present our structural and relationship chart 10 stages ppt samples business plan PowerPoint Slides.Download and present our Education PowerPoint Templates because You can Score a slam dunk with our PowerPoint Templates and Slides. Watch your audience hang onto your every word. Download and present our Process and Flows PowerPoint Templates because Our PowerPoint Templates and Slides help you pinpoint your timelines. Highlight the reasons for your deadlines with their use. Use our Flow Charts PowerPoint Templates because our PowerPoint Templates and Slides are the string of your bow. Fire of your ideas and conquer the podium. Download and present our Marketing PowerPoint Templates because You can Bait your audience with our PowerPoint Templates and Slides. They will bite the hook of your ideas in large numbers. Download our Business PowerPoint Templates because You can Zap them with our PowerPoint Templates and Slides. See them reel under the impact.Use these PowerPoint slides for presentations relating to Mark, corporate, business, plan, concept, bright, symbol, diagram, crayon, stack, graphic, finance, stock,analysis, drawing, paint, calculation, accounting, creative, economic, creativity, chart, forecast, design, color, objects, stationary, pencil, education,profit, information, background, investment, figures, ten, business, business process. The prominent colors used in the PowerPoint template are Blue, Gray, Black.
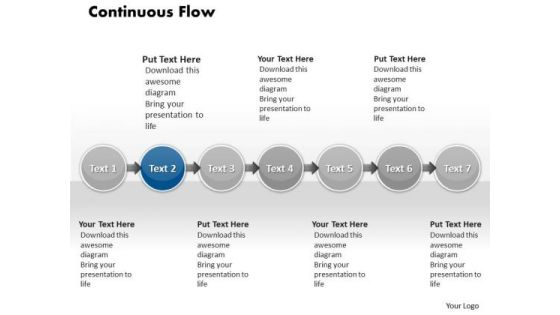
Ppt Continuous Busines Demo Create Flow Chart PowerPoint Of 7 Steps Templates
PPT continuous busines demo create flow chart powerpoint of 7 steps Templates-This Diagram shows how steps in a process fit together. This makes them useful tools for communicating how processes work, and for clearly documenting how a particular job is done. Furthermore, the act of mapping a process out in flow chart format helps you clarify your understanding of the process, and helps you think about where the process can be improved.-PPT continuous busines demo create flow chart powerpoint of 7 steps Templates-Analysis, Arrow, Background, Backlink, Circle, Code, Content, Diagram, Engine, Illustration, Keyword, Optimization, Offpage, Process, Search, Template, Tracking, Unpage, Violet, Visitor,

Business Audit Committee Workflow Chart Ppt PowerPoint Presentation Gallery Graphics Example PDF
This slide shows the business process followed by internal audit committee which focuses on formation of audit team, ordering audit and document, data collection and analysis, developing checklist, processing data using checklist, preparing audit report, etc. Persuade your audience using this business audit committee workflow chart ppt powerpoint presentation gallery graphics example pdf. This PPT design covers one stages, thus making it a great tool to use. It also caters to a variety of topics including data analysis, management, data processing. Download this PPT design now to present a convincing pitch that not only emphasizes the topic but also showcases your presentation skills.

Approach Avoidance Conflict Planned And Actual Velocity Project Burndown Chart Structure PDF
This slide provides the glimpse about the planned and actual velocity project burndown chart which showcase the impact of introducing issue escalation process in the company. Deliver an awe inspiring pitch with this creative approach avoidance conflict planned and actual velocity project burndown chart structure pdf bundle. Topics like planned and actual velocity project burndown chart can be discussed with this completely editable template. It is available for immediate download depending on the needs and requirements of the user.

Business Operation Modeling Approaches Project Iteration Burn Down Chart Template PDF
This slide provides the glimpse about the project iteration burn down chart which focuses on 21 days plan along with completed tasks, remaining effort, ideal burndown and remaining tasks.Deliver an awe inspiring pitch with this creative business operation modeling approaches project iteration burn down chart template pdf bundle. Topics like project iteration burn down chart can be discussed with this completely editable template. It is available for immediate download depending on the needs and requirements of the user.

Online Finance Pie Chart Success PowerPoint Templates And PowerPoint Themes 0812
Online Finance Pie Chart Success PowerPoint Templates And PowerPoint Themes 0812-Microsoft Powerpoint Templates and Background with online finance pie chart

Client Support Communication Process Flow Chart For Finding Solutions Brochure PDF
This slide covers the process to improve the customer communication regarding their inquiries . It includes a conversation between the agent and customer related to knowing the account balance. Persuade your audience using this Client Support Communication Process Flow Chart For Finding Solutions Brochure PDF. This PPT design covers one stages, thus making it a great tool to use. It also caters to a variety of topics including Client Support Communication Process, Flow Chart For Finding Solutions. Download this PPT design now to present a convincing pitch that not only emphasizes the topic but also showcases your presentation skills.

11 Stages Representing Diverging Circular Flow Chart Ppt Cycle Process PowerPoint Templates
We present our 11 stages representing diverging circular flow chart ppt Cycle Process PowerPoint templates.Present our Circle Charts PowerPoint Templates because they will Amplify your basic corporate concept and forefront the benefits of overlapping processes to arrive at common goals. Download and present our Arrows PowerPoint Templates because this slide is an excellent backdrop for you to enlighten your audience on the process you have gone through and the vision you have for the future. Use our Ring Charts PowerPoint Templates because your listeners do not have to put on their thinking caps. Download and present our Business PowerPoint Templates because it helps you to project your enthusiasm and single mindedness to your colleagues. Use our Flow Charts PowerPoint Templates because you have examined every element down to the finest detail.Use these PowerPoint slides for presentations relating to arrows, business, chart, circle, company, concept, continuity, continuous, cycle, dependency, diagram, direction, dynamic, endless, feeds, graph, iteration, iterative, method, path, phase, presentation, process, production, progress, progression, report, rotation, sequence, succession, vector. The prominent colors used in the PowerPoint template are Green, Blue, Gray. Presenters tell us our 11 stages representing diverging circular flow chart ppt Cycle Process PowerPoint templates are Pleasant. You can be sure our cycle PowerPoint templates and PPT Slides will get their audience's attention. Professionals tell us our 11 stages representing diverging circular flow chart ppt Cycle Process PowerPoint templates are Flirty. People tell us our circle PowerPoint templates and PPT Slides will save the presenter time. People tell us our 11 stages representing diverging circular flow chart ppt Cycle Process PowerPoint templates are aesthetically designed to attract attention. We guarantee that they will grab all the eyeballs you need. Professionals tell us our circle PowerPoint templates and PPT Slides are Playful.
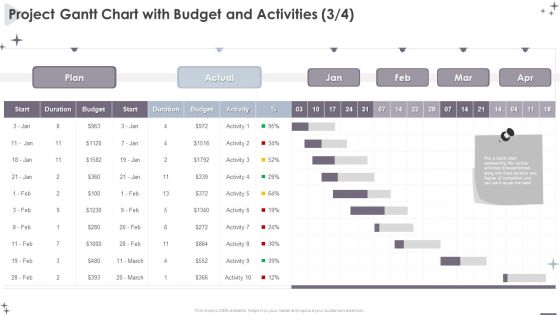
Project Administration Bundle Project Gantt Chart With Budget And Activities Infographics PDF
Your complex projects can be managed and organized simultaneously using this detailed Project Administration Bundle Project Gantt Chart With Budget And Activities Infographics PDF template. Track the milestones, tasks, phases, activities, and subtasks to get an updated visual of your project. Share your planning horizon and release plan with this well crafted presentation template. This exemplary template can be used to plot various dependencies to distinguish the tasks in the pipeline and their impact on the schedules and deadlines of the project. Apart from this, you can also share this visual presentation with your team members and stakeholders. It a resourceful tool that can be incorporated into your business structure. Therefore, download and edit it conveniently to add the data and statistics as per your requirement.
Internet Browser With Pie Chart PowerPoint Templates And PowerPoint Themes 1012
Internet Browser With Pie Chart PowerPoint Templates And PowerPoint Themes 1012-Aesthetically designed to make a great first impression this template highlights an internet browser with pie chart. It imitates internet, money, networking, profit, risk, sales and stock market. Our PPT images are so perfectly designed that it reveals the very basis of our PPT template are an effective tool to make your clients understand.-Internet Browser With Pie Chart PowerPoint Templates And PowerPoint Themes 1012-This PowerPoint template can be used for presentations relating to-Internet browser with pie chart, business, technology, pie charts, marketing, finance
Sustainable Energy Resources Column Chart Ppt PowerPoint Presentation Icon Infographic Template PDF
This graph or chart is linked to excel, and changes automatically based on data. Just left click on it and select Edit Data. Deliver and pitch your topic in the best possible manner with this Sustainable Energy Resources Column Chart Ppt PowerPoint Presentation Icon Infographic Template PDF. Use them to share invaluable insights on Column Chart, 2017 To 2022 and impress your audience. This template can be altered and modified as per your expectations. So, grab it now.
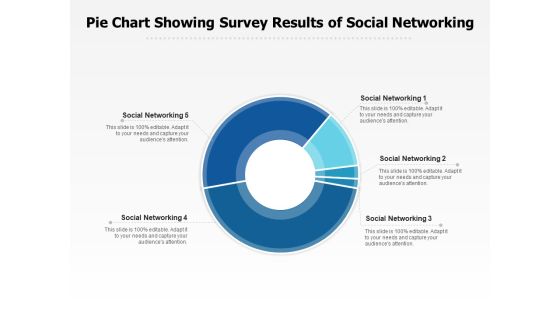
Pie Chart Showing Survey Results Of Social Networking Ppt PowerPoint Presentation Gallery Ideas PDF
Presenting this set of slides with name pie chart showing survey results of social networking ppt powerpoint presentation gallery ideas pdf. The topics discussed in these slide is pie chart showing survey results of social networking. This is a completely editable PowerPoint presentation and is available for immediate download. Download now and impress your audience.

Pie Chart Survey Results Of Vehicle Export Ppt PowerPoint Presentation Portfolio Slide Portrait PDF
Presenting this set of slides with name pie chart survey results of vehicle export ppt powerpoint presentation portfolio slide portrait pdf. The topics discussed in these slides are pie chart survey results of vehicle export, export of car. This is a completely editable PowerPoint presentation and is available for immediate download. Download now and impress your audience.

Lead Ranking Sales Methodology Model Clustered Bar Chart Ppt PowerPoint Presentation Styles Introduction PDF
Presenting this set of slides with name lead ranking sales methodology model clustered bar chart ppt powerpoint presentation styles introduction pdf. The topics discussed in these slide is clustered bar chart. This is a completely editable PowerPoint presentation and is available for immediate download. Download now and impress your audience.

Business Circle Chart PowerPoint Templates Business Market Research Data Ppt Slides
Business Circle Chart PowerPoint Templates Business market research data PPT Slides-\nThis PowerPoint diagram slide shows a circular process withan arrow. Useful to represent process slides-Business Circle Chart PowerPoint Templates Business market research data PPT Slides-This template can be used for presentations relating to 3d, Abstract, Around, Arrow, Background, Bright, Business, Card, Chart, Circle, Circular, Circulation, Collection, Colorful, Communication, Concept, Cycle, Cyclic, Design, Direction, Element, Flow, Glass, Glossy, Graphic, Icon, Illustration, Modern, Motion, Network

Financial Waterfall Chart For Data Visualization Ppt PowerPoint Presentation Ideas Elements
This is a financial waterfall chart for data visualization ppt powerpoint presentation ideas elements. This is a five stage process. The stages in this process are sales waterfall, waterfall chart, business.
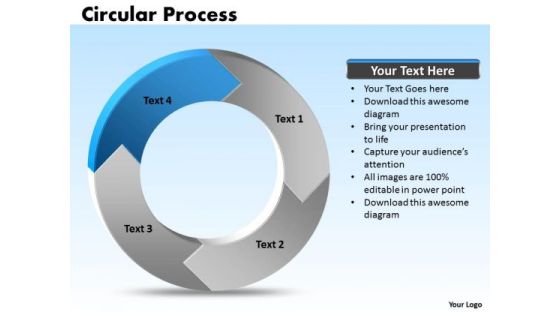
Ppt Edit Data PowerPoint Chart Processing Cycle Diagram 4 State Templates
PPT edit data powerpoint chart processing cycle diagram 4 state Templates-The above template has the theme of circular process Diagram. This image refers the concept of Act Cycle. Adjust the above image in your PPT presentations to visually support your content in your business meetings. This PPT images is so perfectly designed that it make your clients understand the business idea quickly and visually.-PPT edit data powerpoint chart processing cycle diagram 4 state Templates-Arrow, Chart, Circular, Color, Colorful, Connect, Connection, Design, Diagram, Finance, Graphic, Group, Growth, Icon, Illustration, Marketing, Pieces, Process, Recycle, Recycling, Round, Set, Strategy, Symbol, Wheel

Developing New Sales And Marketing Strategic Approach Bar Chart Ppt PowerPoint Presentation Show Samples PDF
Presenting this set of slides with name developing new sales and marketing strategic approach bar chart ppt powerpoint presentation show samples pdf. The topics discussed in these slide is bar chart. This is a completely editable PowerPoint presentation and is available for immediate download. Download now and impress your audience.
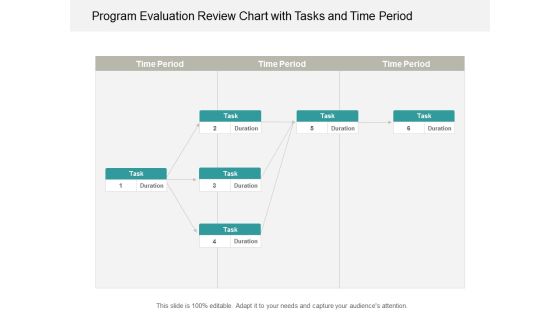
Program Evaluation Review Chart With Tasks And Time Period Ppt Powerpoint Presentation Portfolio Infographic Template
This is a program evaluation review chart with tasks and time period ppt powerpoint presentation portfolio infographic template. This is a six stage process. The stages in this process are pert chart, program evaluation and review technique, pert graph.
Project Task Planning And Evaluation Chart Ppt Powerpoint Presentation Icon Slide
This is a project task planning and evaluation chart ppt powerpoint presentation icon slide. This is a nine stage process. The stages in this process are pert chart, program evaluation and review technique, pert graph.

Program Evaluation Chart From Start To Finish Ppt Powerpoint Presentation Professional Examples
This is a program evaluation chart from start to finish ppt powerpoint presentation professional examples. This is a three stage process. The stages in this process are pert chart, program evaluation and review technique, pert graph.
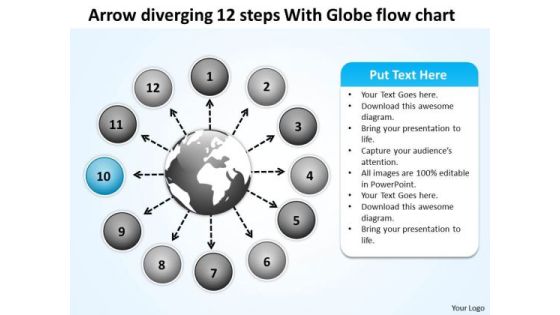
Arrow Diverging 12 Steps With Globe Flow Chart Target Network PowerPoint Templates
We present our arrow diverging 12 steps with globe flow chart Target Network PowerPoint templates.Download and present our Circle Charts PowerPoint Templates because the gears of youthful minds are useful, therefore set them in motion. Use our Arrows PowerPoint Templates because honesty is the best policy has an ardent follower in you. Use our Globe PowerPoint Templates because you have the entire picture in mind. Download our Business PowerPoint Templates because your ideas too are pinpointedly focused on you goals. Use our Flow Charts PowerPoint Templates because you are buzzing with ideas.Use these PowerPoint slides for presentations relating to 3d, abstract, aim, arrow, background, business, career, chart, circle, color, concept, creative, curve, design, development, direction, financial, flowing, gain, graph, green, group, growth, higher, illustration, increase, isolated, motion, moving, moving up, path, prediction, progress, red, series, shape, sign, success, symbol, target, turn, twisted, up, upload, upward, way, white, win. The prominent colors used in the PowerPoint template are Blue, Gray, White. PowerPoint presentation experts tell us our arrow diverging 12 steps with globe flow chart Target Network PowerPoint templates are Clever. PowerPoint presentation experts tell us our background PowerPoint templates and PPT Slides are Delightful. Presenters tell us our arrow diverging 12 steps with globe flow chart Target Network PowerPoint templates are Nostalgic. Presenters tell us our background PowerPoint templates and PPT Slides are Stylish. You can be sure our arrow diverging 12 steps with globe flow chart Target Network PowerPoint templates are Festive. We assure you our background PowerPoint templates and PPT Slides are Nice.
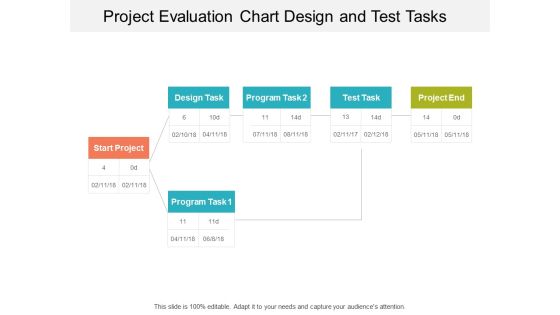
Project Evaluation Chart Design And Test Tasks Ppt Powerpoint Presentation Show Graphics Design
This is a project evaluation chart design and test tasks ppt powerpoint presentation show graphics design. This is a three stage process. The stages in this process are pert chart, program evaluation and review technique, pert graph.

Bar Chart Representing Strategies To Promote Data Driven Organizational Culture Diagrams PDF
Showcasing this set of slides titled bar chart representing strategies to promote data driven organizational culture diagrams pdf. The topics addressed in these templates are bar chart representing strategies to promote data driven organizational culture. All the content presented in this PPT design is completely editable. Download it and make adjustments in color, background, font etc. as per your unique business setting.
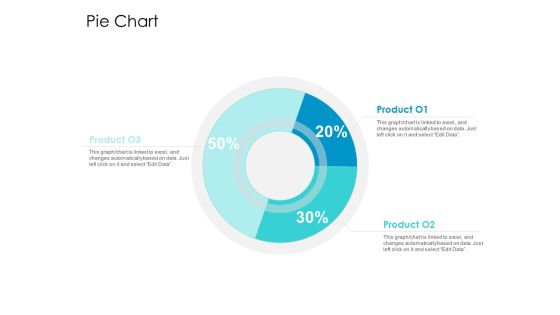
Developing New Sales And Marketing Strategic Approach Pie Chart Ppt PowerPoint Presentation Professional Example PDF
Presenting this set of slides with name developing new sales and marketing strategic approach pie chart ppt powerpoint presentation professional example pdf. The topics discussed in these slide is pie chart. This is a completely editable PowerPoint presentation and is available for immediate download. Download now and impress your audience.

Ppt Team Work Person Presentation Standing Orange Piece Of Chart PowerPoint Templates
PPT team work person presentation standing orange piece of chart PowerPoint Templates-Use this graphical approach to represent global business issues such as financial data, stock market Exchange, increase in sales, corporate presentations and more. Create captivating presentations to deliver comparative and weighted arguments.-PPT team work person presentation standing orange piece of chart PowerPoint Templates-arrow, bar, business, businessman, candidate, cartoon, character, chart, circle, circular, client, communication, company, concept, diagram, finance, financial, flow, growth, human, illustration, increase, information, iteration, man, market, marketing, process, processing, profit, sales, statistics, stats, success, target

Cyber Security Implementation Framework Bar Chart Ppt PowerPoint Presentation Slides PDF
Presenting this set of slides with name cyber security implementation framework bar chart ppt powerpoint presentation slides pdf. The topics discussed in these slide is bar chart. This is a completely editable PowerPoint presentation and is available for immediate download. Download now and impress your audience.

Business Chart PowerPoint Templates Business 3d Double Concentric Rings Pieces Ppt Slides
Business Chart PowerPoint Templates Business 3d double concentric rings pieces PPT Slides-Use this diagram to explain the contribution of each of the elements and how they provide impetus to the next phase. Highlight any anticipated problems, shortfalls or weak areas-Business Chart PowerPoint Templates Business 3d double concentric rings pieces PPT Slides-This ppt can be used for concepts relating to-3d, Abstract, Account, Achievement, Analyst, Annual, Background, Blue, Business, Capital, Chart, Circular, Conceptual, Data, Design, Diagram, Document, Earnings, Economic, Finance, Financial, Forecast, Icon, Illustration

Bar Chart Showing Data Segmentation Anylysis Ppt PowerPoint Presentation Icon Examples PDF
Presenting this set of slides with name bar chart showing data segmentation anylysis ppt powerpoint presentation icon examples pdf. The topics discussed in these slide is bar chart showing data segmentation anylysis. This is a completely editable PowerPoint presentation and is available for immediate download. Download now and impress your audience.
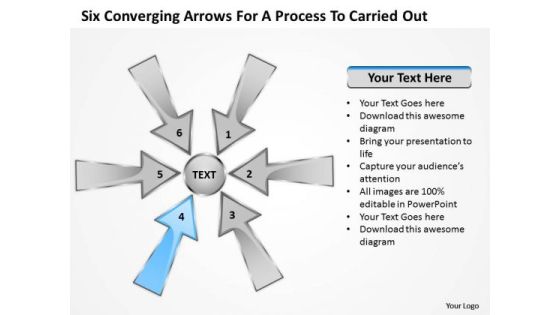
Six Coverging Arrow For Process To Carried Out Circular Chart PowerPoint Slides
We present our six coverging arrow for process to carried out Circular Chart PowerPoint Slides.Download and present our Arrows PowerPoint Templates because you can Focus on each one and investigate which one would be the best fit for your needs. Download and present our Circle Charts PowerPoint Templates because they are the tools that helped most of us evolve. Use our Shapes PowerPoint Templates because our template will help pinpoint their viability. Use our Business PowerPoint Templates because the majestic tiger lord of all it surveys.It exudes power even when it is in repose. Download our Flow Charts PowerPoint Templates because there is a vision, a need you can meet.Use these PowerPoint slides for presentations relating to 6, abstract, arrows, blank, business, central, centralized, chart, circle, circular, circulation, concept, conceptual, converging, design, diagram, empty, executive, icon, idea, illustration, management, map, mapping, mba, model, numbers, organization, outwards, pointing, procedure, process, radial, radiating, relationship, resource, sequence, sequential, six, square, strategy, template. The prominent colors used in the PowerPoint template are Blue, Gray, Black. Presenters tell us our six coverging arrow for process to carried out Circular Chart PowerPoint Slides are Wistful. The feedback we get is that our central PowerPoint templates and PPT Slides are Quaint. Presenters tell us our six coverging arrow for process to carried out Circular Chart PowerPoint Slides are Nice. You can be sure our chart PowerPoint templates and PPT Slides are Dazzling. People tell us our six coverging arrow for process to carried out Circular Chart PowerPoint Slides are Magnificent. PowerPoint presentation experts tell us our blank PowerPoint templates and PPT Slides are Nostalgic.
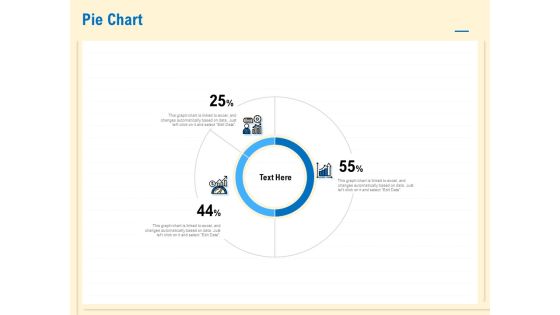
Prioritization Techniques For Software Development And Testing Pie Chart Template PDF
Presenting this set of slides with name prioritization techniques for software development and testing pie chart template pdf. The topics discussed in these slide is pie chart. This is a completely editable PowerPoint presentation and is available for immediate download. Download now and impress your audience.
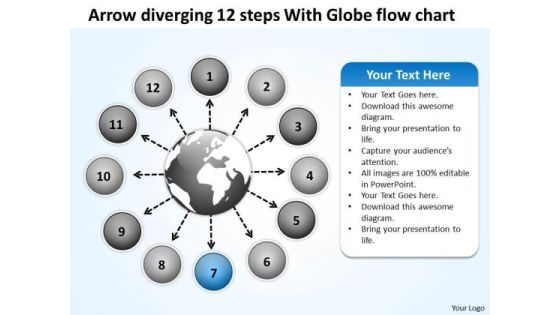
Arrow Diverging 12 Steps With Globe Flow Chart Circular PowerPoint Slides
We present our arrow diverging 12 steps with globe flow chart Circular PowerPoint Slides.Use our Circle Charts PowerPoint Templates because this diagram put it all together to form the complete picture and reach the goal. Use our Arrows PowerPoint Templates because the chart is designed to give you the flavour of the kind of tools you may need and the work that is performed in the lifecycle. Present our Globe PowerPoint Templates because you require care and diligence to function well. Use our Business PowerPoint Templates because this is the unerring accuracy in reaching the target. the effortless ability to launch into flight. Use our Flow Charts PowerPoint Templates because your marketing strategies can funnel down to the cone, stage by stage, refining as you go along.Use these PowerPoint slides for presentations relating to 3d, abstract, aim, arrow, background, business, career, chart, circle, color, concept, creative, curve, design, development, direction, financial, flowing, gain, graph, green, group, growth, higher, illustration, increase, isolated, motion, moving, moving up, path, prediction, progress, red, series, shape, sign, success, symbol, target, turn, twisted, up, upload, upward, way, white, win. The prominent colors used in the PowerPoint template are Blue, Gray, White. PowerPoint presentation experts tell us our arrow diverging 12 steps with globe flow chart Circular PowerPoint Slides are Energetic. PowerPoint presentation experts tell us our career PowerPoint templates and PPT Slides are Delightful. Presenters tell us our arrow diverging 12 steps with globe flow chart Circular PowerPoint Slides have awesome images to get your point across. Presenters tell us our background PowerPoint templates and PPT Slides are Clever. You can be sure our arrow diverging 12 steps with globe flow chart Circular PowerPoint Slides are Enchanting. We assure you our chart PowerPoint templates and PPT Slides are Bold.
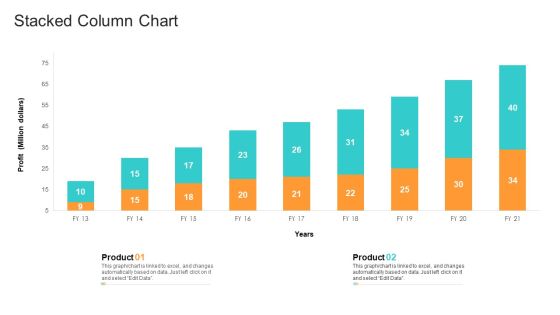
Utilization Of Current Techniques To Improve Efficiency Case Competition Stacked Column Chart Information PDF
Deliver and pitch your topic in the best possible manner with this utilization of current techniques to improve efficiency case competition stacked column chart information pdf. Use them to share invaluable insights on stacked column chart and impress your audience. This template can be altered and modified as per your expectations. So, grab it now.

Software Testing Framework For Learners Area Chart Ppt PowerPoint Presentation Infographic Template Layout PDF
Presenting this set of slides with name software testing framework for learners area chart ppt powerpoint presentation infographic template layout pdf. The topics discussed in these slide is area chart. This is a completely editable PowerPoint presentation and is available for immediate download. Download now and impress your audience.
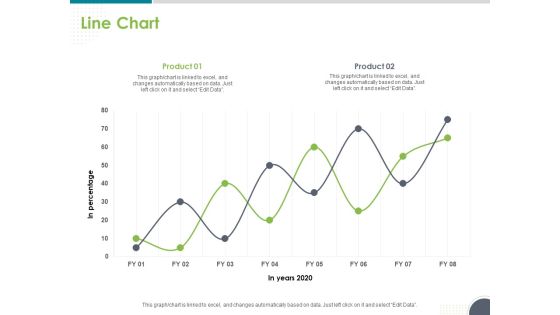
Software Testing Framework For Learners Line Chart Ppt PowerPoint Presentation Infographic Template Graphics Example PDF
Presenting this set of slides with name software testing framework for learners line chart ppt powerpoint presentation infographic template graphics example pdf. The topics discussed in these slide is line chart. This is a completely editable PowerPoint presentation and is available for immediate download. Download now and impress your audience.

Pie Chart To Compare Sales Data Ppt PowerPoint Presentation Gallery Design Templates PDF
Showcasing this set of slides titled pie chart to compare sales data ppt powerpoint presentation gallery design templates pdf. The topics addressed in these templates are pie chart to compare sales data. All the content presented in this PPT design is completely editable. Download it and make adjustments in color, background, font etc. as per your unique business setting.

Key Prioritization Techniques For Project Team Management Column Chart Ppt PowerPoint Presentation Summary Show PDF
Presenting this set of slides with name key prioritization techniques for project team management column chart ppt powerpoint presentation summary show pdf. The topics discussed in these slides are a,b,c,d, is column chart. This is a completely editable PowerPoint presentation and is available for immediate download. Download now and impress your audience.
 Home
Home