AI PPT Maker
Templates
PPT Bundles
Design Services
Business PPTs
Business Plan
Management
Strategy
Introduction PPT
Roadmap
Self Introduction
Timelines
Process
Marketing
Agenda
Technology
Medical
Startup Business Plan
Cyber Security
Dashboards
SWOT
Proposals
Education
Pitch Deck
Digital Marketing
KPIs
Project Management
Product Management
Artificial Intelligence
Target Market
Communication
Supply Chain
Google Slides
Research Services
 One Pagers
All Categories
-
Home
- Customer Favorites
- Chart Analysis
Chart Analysis
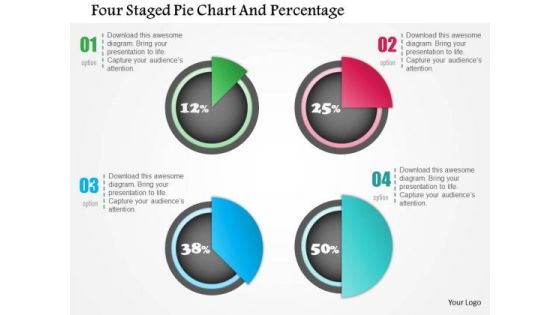
Business Diagram Four Staged Pie Chart And Percentage Presentation Template
Four staged pie chart and percentage values has been used to design this power point template. This PPT contains the concept of financial result analysis. Use this PPT for business and marketing related presentations.

Venn Business Chart With Percentage Value Powerpoint Template
This PPT slide contains Venn business chart with percentage values. This PPT diagram is suitable to present data comparison and analysis. Enlighten others on the process with this innovative PowerPoint template.

Business Plan Service Industry Chart Ppt Images Gallery
This is a business plan service industry chart ppt images gallery. This is a six stage process. The stages in this process are development, research, communication, idea generation, environmental scanning, feasibility analysis.

Circular Chart With Icons For Value Chain Powerpoint Template
This PowerPoint template has been designed with circular chart and icons. This professional PPT slide is suitable to present value chain analysis. Capture the attention of your audience using this professional slide.
Pie Chart With Seven Business Icons Powerpoint Templates
Our compelling template consists with a design of pie chart with seven business icons. This slide has been professionally designed to exhibit financial ratio analysis. This template offers an excellent background to build impressive presentation.
Five Circles Sequential Chart With Icons Powerpoint Slides
This PowerPoint template contains sequential chart of five circles with icons. You may download this PPT slide to depict corporate vision, mission and strategy analysis. Add this slide to your presentation and impress your superiors.
Market Trends Chart With Percentage And Icons Powerpoint Slides
This PowerPoint template has been designed with graphics of chart with percentage values and icons. This PowerPoint template may be used to market trends and financial analysis. Prove the viability of your ideas using this impressive slide.

Clustered Bar Chart Finance Ppt PowerPoint Presentation Icon Tips
This is a clustered bar chart finance ppt powerpoint presentation icon tips. This is a two stage process. The stages in this process are analysis, finance, marketing, management, investment.

Bubble Chart Employee Value Proposition Ppt PowerPoint Presentation Icon Sample
This is a bubble chart employee value proposition ppt powerpoint presentation icon sample. This is a two stage process. The stages in this process are business, management, strategy, analysis, marketing.

Clustered Bar Chart Finance Ppt Powerpoint Presentation Icon Graphics Template
This is a clustered bar chart finance ppt powerpoint presentation icon graphics template. This is a four stage process. The stages in this process are finance, marketing, management, investment, analysis.
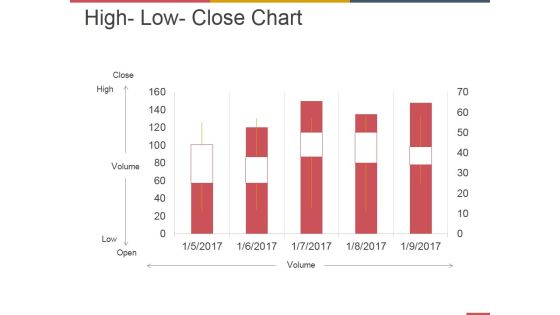
High Low Close Chart Ppt PowerPoint Presentation Summary Ideas
This is a high low close chart ppt powerpoint presentation summary ideas. This is a five stage process. The stages in this process are business, strategy, marketing, analysis, growth.
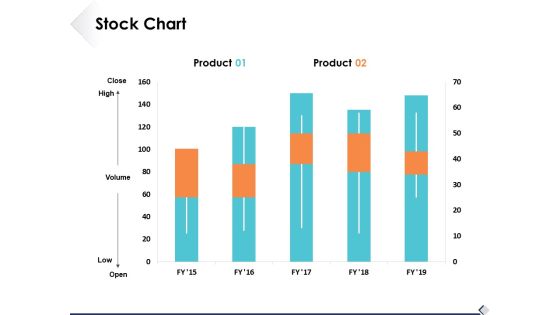
Stock Chart Finance Ppt PowerPoint Presentation Styles Background Image
This is a stock chart finance ppt powerpoint presentation styles background image. This is a two stage process. The stages in this process are analysis, marketing, icons, finance, strategy.
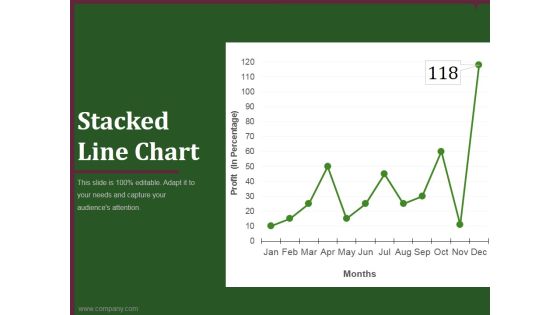
Stacked Line Chart Ppt PowerPoint Presentation Background Image
This is a stacked line chart ppt powerpoint presentation background image. This is a twelve stage process. The stages in this process are business, marketing, analysis, finance, growth strategy.

Volume High Low Close Chart Ppt PowerPoint Presentation Shapes
This is a volume high low close chart ppt powerpoint presentation shapes. This is a five stage process. The stages in this process are business, strategy, analysis, marketing, finance, growth.
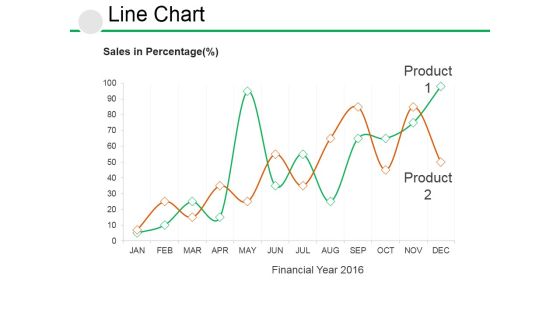
Line Chart Ppt PowerPoint Presentation Visual Aids Example File
This is a line chart ppt powerpoint presentation visual aids example file. This is a two stage process. The stages in this process are business, growth, strategy, analysis, management.
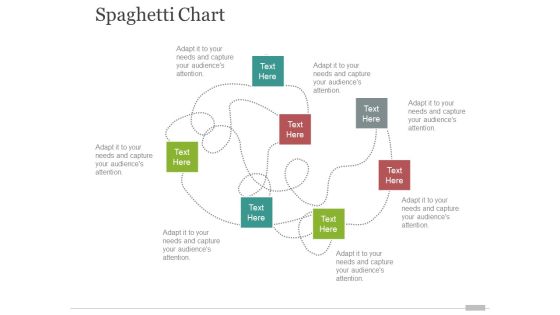
spaghetti chart template 2 ppt powerpoint presentation inspiration portfolio
This is a spaghetti chart template 2 ppt powerpoint presentation inspiration portfolio. This is a seven stage process. The stages in this process are business, marketing, management, analysis, strategy.

Brand Positioning Chart Ppt PowerPoint Presentation Show Example File
This is a brand positioning chart ppt powerpoint presentation show example file. This is a five stage process. The stages in this process are own product, business, marketing, strategy, analysis.

Bar Chart Ppt PowerPoint Presentation Infographic Template Master Slide
This is a bar chart ppt powerpoint presentation infographic template master slide. This is a two stage process. The stages in this process are growth, finance, business, analysis, marketing.

Column Chart Ppt PowerPoint Presentation Infographic Template Example File
This is a column chart ppt powerpoint presentation infographic template example file. This is a two stage process. The stages in this process are growth, finance, business, marketing, analysis.

Scatter Bubble Chart Ppt PowerPoint Presentation Inspiration Graphics Tutorials
This is a scatter bubble chart ppt powerpoint presentation inspiration graphics tutorials. This is a two stage process. The stages in this process are finance, marketing, management, investment, analysis.
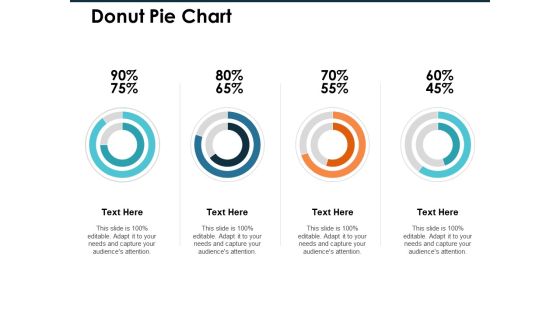
Donut Pie Chart Ppt PowerPoint Presentation Infographic Template Professional
This is a donut pie chart ppt powerpoint presentation infographic template professional. This is a four stage process. The stages in this process are finance, marketing, management, investment, analysis.

Area Chart Ppt PowerPoint Presentation Infographic Template Clipart Images
This is a area chart ppt powerpoint presentation infographic template clipart images. This is a two stage process. The stages in this process are finance, marketing, management, investment, analysis.

Bubble Chart Finance Ppt PowerPoint Presentation File Master Slide
This is a bubble chart finance ppt powerpoint presentation file master slide. This is a three stage process. The stages in this process are finance, marketing, management, investment, analysis.

Area Chart Talent Mapping Ppt PowerPoint Presentation Ideas Vector
This is a area chart talent mapping ppt powerpoint presentation ideas vector. This is a three stage process. The stages in this process are business, management, strategy, analysis, marketing.

Combo Chart Talent Mapping Ppt PowerPoint Presentation Inspiration Display
This is a combo chart talent mapping ppt powerpoint presentation inspiration display. This is a three stage process. The stages in this process are business, management, strategy, analysis, marketing.

Area Chart Product Marketing Ppt PowerPoint Presentation Layouts Portfolio
This is a area chart product marketing ppt powerpoint presentation layouts portfolio. This is a three stage process. The stages in this process are business, management, strategy, analysis, marketing.

Volume High Low Close Chart Ppt PowerPoint Presentation Pictures Objects
This is a volume high low close chart ppt powerpoint presentation pictures objects. This is a one stage process. The stages in this process are finance, marketing, management, investment, analysis.

Column Chart Sample Budget Ppt Ppt PowerPoint Presentation Infographics Brochure
This is a column chart sample budget ppt ppt powerpoint presentation infographics brochure. This is a two stage process. The stages in this process are business, management, strategy, analysis, marketing.
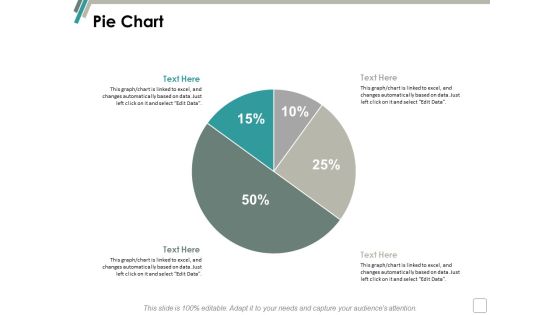
Pie Chart Finance Marketing Ppt Powerpoint Presentation Infographics Background
This is a pie chart finance marketing ppt powerpoint presentation infographics background. This is a two stage process. The stages in this process are finance, marketing, management, investment, analysis.

Volume High Low Close Chart Ppt Powerpoint Presentation Slides Images
This is a volume high low close chart ppt powerpoint presentation slides images. This is a five stage process. The stages in this process are finance, marketing, management, investment, analysis.

Area Chart Finance Marketing Ppt Powerpoint Presentation Gallery Slides
This is a area chart finance marketing ppt powerpoint presentation gallery slides. This is a three stage process. The stages in this process are finance, marketing, management, investment, analysis.
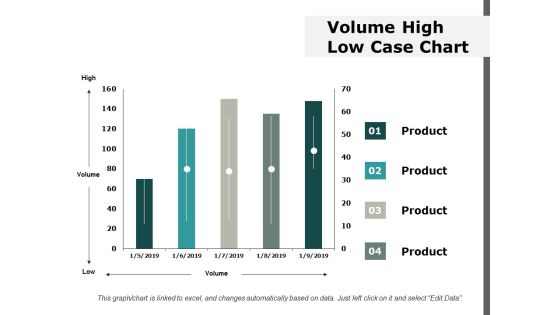
Volume High Low Case Chart Ppt Powerpoint Presentation Ideas Information
This is a volume high low case chart ppt powerpoint presentation ideas information. This is a four stage process. The stages in this process are finance, marketing, management, investment, analysis.

Bar Chart Finance Marketing Ppt Powerpoint Presentation Gallery Grid
This is a bar chart finance marketing ppt powerpoint presentation gallery grid. This is a three stage process. The stages in this process are finance, marketing, management, investment, analysis.

Donut Pie Chart Finance Ppt Powerpoint Presentation Outline Vector
This is a donut pie chart finance ppt powerpoint presentation outline vector. This is a four stage process. The stages in this process are finance, marketing, management, investment, analysis.

area chart finance ppt powerpoint presentation portfolio graphics download
This is a area chart finance ppt powerpoint presentation portfolio graphics download. This is a two stage process. The stages in this process are finance, marketing, management, investment, analysis.

Pie Chart Finance Ppt Powerpoint Presentation Layouts Design Ideas
This is a pie chart finance ppt powerpoint presentation layouts design ideas. This is a four stage process. The stages in this process are finance, marketing, management, investment, analysis.

Bubble Chart Marketing Business Ppt PowerPoint Presentation Model Sample
This is a bubble chart marketing business ppt powerpoint presentation model sample. This is a two stage process. The stages in this process are finance, business, management, strategy, analysis.
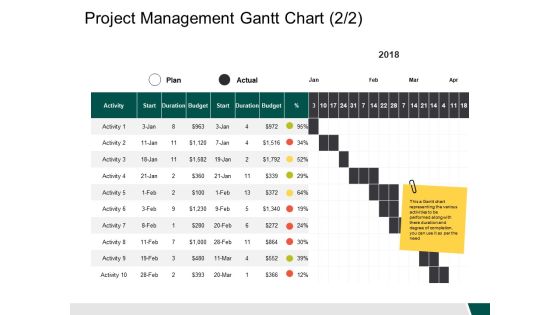
Project Management Gantt Chart Activity Ppt PowerPoint Presentation Inspiration Samples
This is a project management gantt chart activity ppt powerpoint presentation inspiration samples. This is a ten stage process. The stages in this process are business, management, strategy, analysis, marketing.
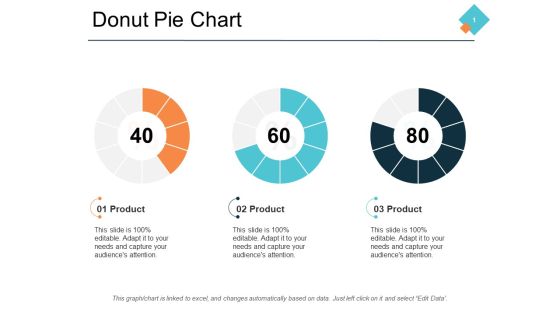
Donut Pie Chart Finance Ppt PowerPoint Presentation Portfolio Model
This is a donut pie chart finance ppt powerpoint presentation portfolio model. This is a three stage process. The stages in this process are finance, management, strategy, analysis, marketing.

Area Chart Finance Ppt PowerPoint Presentation Infographic Template Model
This is a area chart finance ppt powerpoint presentation infographic template model. This is a two stage process. The stages in this process are finance, marketing, management, investment, analysis.

Bar Chart Business Management Ppt PowerPoint Presentation Ideas Example Introduction
This is a bar chart business management ppt powerpoint presentation ideas example introduction. This is a three stage process. The stages in this process are finance, marketing, management, investment, analysis.

Column Chart And Graph Ppt PowerPoint Presentation File Introduction
This is a column chart and graph ppt powerpoint presentation file introduction. This is a three stage process. The stages in this process are finance, marketing, management, investment, analysis.

Area Chart Finance Marketing Ppt Powerpoint Presentation Show Grid
This is a area chart finance marketing ppt powerpoint presentation show grid. This is a three stage process. The stages in this process are finance, marketing, management, investment, analysis.

Area Chart Finance Ppt PowerPoint Presentation Infographic Template Graphics Template
This is a area chart finance ppt powerpoint presentation infographic template graphics template. This is a two stage process. The stages in this process are finance, marketing, management, investment, analysis.

Pie Chart Finance Ppt PowerPoint Presentation Infographics Mockup
This is a pie chart finance ppt powerpoint presentation infographics mockup . This is a four stage process. The stages in this process are finance, marketing, management, investment, analysis.

Combo Chart Finance Ppt PowerPoint Presentation Summary Design Ideas
This is a combo chart finance ppt powerpoint presentation summary design ideas. This is a three stage process. The stages in this process are finance, marketing, management, investment, analysis.

Donut Pie Chart Graph Ppt PowerPoint Presentation File Styles
This is a donut pie chart graph ppt powerpoint presentation file styles. This is a three stage process. The stages in this process are finance, marketing, management, investment, analysis.

Donut Pie Chart Graph Ppt PowerPoint Presentation Ideas Guidelines
This is a donut pie chart graph ppt powerpoint presentation ideas guidelines. This is a three stage process. The stages in this process are finance, marketing, management, investment, analysis.
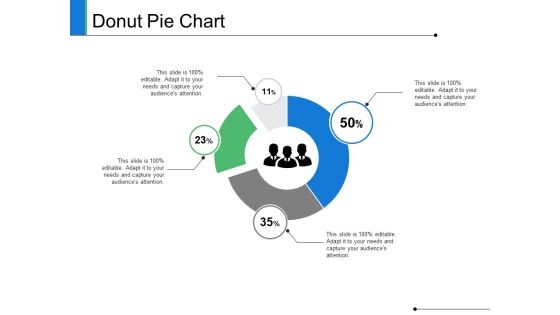
Donut Pie Chart Finance Ppt PowerPoint Presentation Styles Deck
This is a donut pie chart finance ppt powerpoint presentation styles deck. This is a four stage process. The stages in this process are finance, marketing, management, investment, analysis.
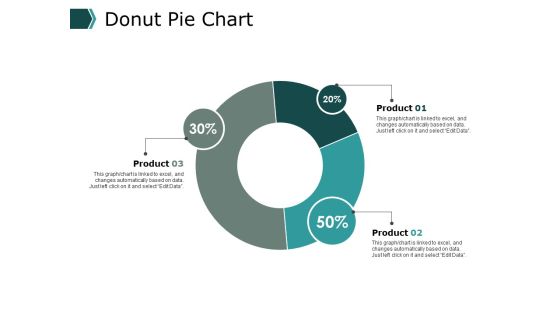
Donut Pie Chart Finance Ppt PowerPoint Presentation File Slide Download
This is a donut pie chart finance ppt powerpoint presentation file slide download. This is a three stage process. The stages in this process are finance, marketing, management, investment, analysis.

Combo Chart Graph Ppt PowerPoint Presentation Gallery Designs Download
This is a combo chart graph ppt powerpoint presentation gallery designs download. This is a three stage process. The stages in this process are finance, marketing, analysis, investment, million.
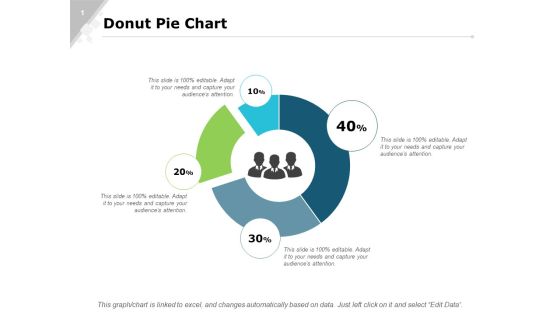
Donut Pie Chart Bar Ppt PowerPoint Presentation Infographics Slide Portrait
This is a donut pie chart bar ppt powerpoint presentation infographics slide portrait. This is a four stage process. The stages in this process are finance, marketing, analysis, investment, million.

Area Chart Graph Ppt PowerPoint Presentation Professional Format Ideas
This is a column chart graph ppt powerpoint presentation slides file formats. This is a stage three process. The stages in this process are finance, marketing, analysis, investment, million.

Combo Chart Marketing Ppt Powerpoint Presentation Ideas Format Ideas Cpb
This is a combo chart marketing ppt powerpoint presentation ideas format ideas cpb. This is a three stage process. The stages in this process are finance, marketing, management, investment, analysis.

Column Chart Marketing Management Ppt PowerPoint Presentation Professional Images
This is a column chart marketing management ppt powerpoint presentation professional images. This is a three stage process. The stages in this process are finance, marketing, management, investment, analysis.

Donut Pie Chart Finance Ppt PowerPoint Presentation Styles Summary
This is a donut pie chart finance ppt powerpoint presentation styles summary. This is a three stage process. The stages in this process are finance, marketing, management, investment, analysis.

Production Process Flow Chart In Production Firm Elements PDF
Mentioned slide demonstrates risk management process used by businesses to reduce project cost. It includes elements such as setting risk approach, identify risk, risk analysis, response planning for risk, budget allocation, response implementation and risk status communication to executives. Presenting Production Process Flow Chart In Production Firm Elements PDF to dispense important information. This template comprises Three stages. It also presents valuable insights into the topics including Formulate Risk, Management Plan, Identify Risk, Document Risk, Address Identified Risk. This is a completely customizable PowerPoint theme that can be put to use immediately. So, download it and address the topic impactfully.

Project Flow Chart Of BPO Organization Summary PDF
This slide provides diagrammatic presentation of process followed by business process outsourcing companies dealing with client projects. Key elements covered are client meetup, stating requirements, finalizing budget, team meeting, allocation of responsibility, progress tracking and project closure. Presenting Project Flow Chart Of BPO Organization Summary PDF to dispense important information. This template comprises one stages. It also presents valuable insights into the topics including Requirement Analysis, Finalizing Budget, Team Meeting. This is a completely customizable PowerPoint theme that can be put to use immediately. So, download it and address the topic impactfully.

Marketing Department Agency Departmental Organizational Chart Designs PDF
This slide covers structure chart for marketing agency team. It includes key stakeholders such as cofounder. executive assistant, marketing manager, marketing research head, marketing strategy executive, marking analysis, sales promotion, business development, vice president strategy director, etc. Persuade your audience using this Marketing Department Agency Departmental Organizational Chart Designs PDF. This PPT design covers seven stages, thus making it a great tool to use. It also caters to a variety of topics including Business Development, Finance, Technology. Download this PPT design now to present a convincing pitch that not only emphasizes the topic but also showcases your presentation skills.

Project Administration Bundle Project Gantt Chart With Duration Topics PDF
Design a highly optimized project management report using this well researched Project Administration Bundle Project Gantt Chart With Duration Topics PDF. This layout can be used to present the professional details of a task or activity. Showcase the activities allocated to the business executives with this Gantt Chart PowerPoint theme. List down the column tasks in various timeframes and allocate time for each. In addition, also monitor the actual time and make comparisons to interpret the final progress using this innovative Gantt Chart Template. Showcase the work breakdown structure to attract your audience. Download and share it using Google Slides, if it suits your requirement.
