Change Management Kpi

IT Operations Dashboard For Project Metrics Portrait PDF
This slide focuses on dashboard that provides information about the information technology operations for managing IT project which covers the investments, billed amount, time taken to complete the project, customer satisfaction, monthly expenses, service level agreement status, etc. Pitch your topic with ease and precision using this IT Operations Dashboard For Project Metrics Portrait PDF. This layout presents information on Revenues, Investments, Monthly Expenses. It is also available for immediate download and adjustment. So, changes can be made in the color, design, graphics or any other component to create a unique layout.

Business Operational Expenditure Dashboard Indicating Revenue And Costs Metrics Pictures PDF
This slide shows operating expenses OPEX dashboard indicating revenue and costs metrics which can be referred by companies to manage various operating expenses of various departments. It contains information about cost center, revenue per company, company code, etc. Pitch your topic with ease and precision using this Business Operational Expenditure Dashboard Indicating Revenue And Costs Metrics Pictures PDF. This layout presents information on Business Operational, Costs Metrics, Revenue. It is also available for immediate download and adjustment. So, changes can be made in the color, design, graphics or any other component to create a unique layout.

Third Party Vendors Risk Metrics Performance Indicators Dashboard Topics PDF
This slide illustrates graphical representation of risk key performance indicators. It includes third party vendors trust score, impact score and risk score. Pitch your topic with ease and precision using this Third Party Vendors Risk Metrics Performance Indicators Dashboard Topics PDF. This layout presents information on Third Party Vendors Risk Metrics Performance Indicators Dashboard. It is also available for immediate download and adjustment. So, changes can be made in the color, design, graphics or any other component to create a unique layout.

Monthly Employee Performance Review Report Form Sample PDF
The following slide outlines a comprehensive report form which can be used by the manager to review the employee performance on a monthly basis. It covers information about key performance indicators KPIs, description, total and actual score, and action plan. Pitch your topic with ease and precision using this Monthly Employee Performance Review Report Form Sample PDF. This layout presents information on Teamwork, Work Ethics, Work Efficiency. It is also available for immediate download and adjustment. So, changes can be made in the color, design, graphics or any other component to create a unique layout.
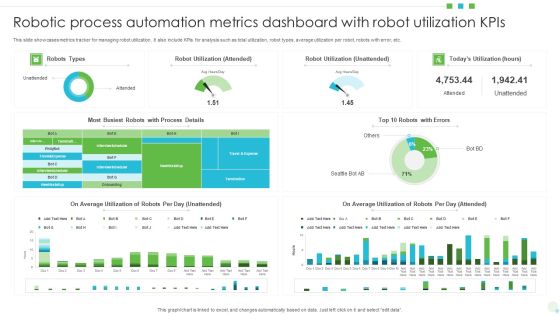
Robotic Process Automation Metrics Dashboard With Robot Utilization Kpis Background PDF
This slide showcases metrics tracker for managing robot utilization. It also include KPIs for analysis such as total utilization, robot types, average utilization per robot, robots with error, etc. Pitch your topic with ease and precision using this Robotic Process Automation Metrics Dashboard With Robot Utilization Kpis Background PDF. This layout presents information on Average Utilization, Robot Utilization, Automation Metrics Dashboard. It is also available for immediate download and adjustment. So, changes can be made in the color, design, graphics or any other component to create a unique layout.

Customer Decline Of Sales Analysis Dashboard Rules PDF
The following slide presents a key performance indicating dashboards that can be used by managers in order to analyse customer-lost sales. Major key performance indicators are lost deals rate, lost sales rate, customer data analytics, etc. Pitch your topic with ease and precision using this Customer Decline Of Sales Analysis Dashboard Rules PDF. This layout presents information on Customer Data Analytics. It is also available for immediate download and adjustment. So, changes can be made in the color, design, graphics or any other component to create a unique layout.
Small Restaurant Sales Action Plan For Fast Food Rules PDF
This slide presents an action plan which can be implemented by managers in order to increase the sales of restaurants. Key elements include products, cost dimensions, budget, distribution strategy, and performance indicators. Pitch your topic with ease and precision using this Small Restaurant Sales Action Plan For Fast Food Rules PDF. This layout presents information on Budget, Distribution Strategy, Performance Indicators. It is also available for immediate download and adjustment. So, changes can be made in the color, design, graphics or any other component to create a unique layout.
Plan Dashboard For Tracking Location Wise Revenue Diagrams PDF
This slide presents a dashboard which will assist managers to track the revenue of each branch having geographical presence in different corners of the world. The key performance indicators are total revenue, location wise rent, branch performance among many others.Pitch your topic with ease and precision using this Plan Dashboard For Tracking Location Wise Revenue Diagrams PDF. This layout presents information on Taxes Paid, Current Month, Branch Performance, Previous Quarter. It is also available for immediate download and adjustment. So, changes can be made in the color, design, graphics or any other component to create a unique layout.

Employee Key Performance Indicators With Scores Themes PDF
The following slide highlights the staff key performance Indicators with scores illustrating key headings which includes staff performance , average scores and team result areas Pitch your topic with ease and precision using this Employee Key Performance Indicators With Scores Themes PDF This layout presents information on Staff Performance, Average Scores, Team Result It is also available for immediate download and adjustment. So, changes can be made in the color, design, graphics or any other component to create a unique layout.

Ad Campaign Dashboard New Product Release Strategy Guidelines PDF
This slide depicts advertisement campaign dashboard used by fintech company managers to track effectiveness of the campaign for new product launch. The key performance indicators are ad cost, total clicks, total impressions, ad impressions etc. Pitch your topic with ease and precision using this Ad Campaign Dashboard New Product Release Strategy Guidelines PDF. This layout presents information on Impressions, Conversion, Strategy. It is also available for immediate download and adjustment. So, changes can be made in the color, design, graphics or any other component to create a unique layout.

Dashboard To Depict Robot Utilization In Robotic Desktop Automation Download PDF
This slide consists of a Dashboard which can be used by managers to depict robot utilization in attended automation. Key performance indicators relate to total utilization, robot types, hours saved etc. Pitch your topic with ease and precision using this Dashboard To Depict Robot Utilization In Robotic Desktop Automation Download PDF. This layout presents information on Dashboard, Depict Robot Utilization, Robotic Desktop Automation. It is also available for immediate download and adjustment. So, changes can be made in the color, design, graphics or any other component to create a unique layout.

Dashboard To Track Energy Efficiency After Campaign Implementation Pictures PDF
This slide consists of a Dashboard which can be used to track energy saving which will be used by managers to track effectiveness of program implementation. The key performance indicators include electric vs gas allocation, equipment activity, changes in costs, budget load etc. Showcasing this set of slides titled Dashboard To Track Energy Efficiency After Campaign Implementation Pictures PDF. The topics addressed in these templates are Equipment Activity, Budget Load, Cost Projection. All the content presented in this PPT design is completely editable. Download it and make adjustments in color, background, font etc. as per your unique business setting.

Cyber Security Key Performance Indicators Metrics Dashboard Mockup PDF
This slide covers cyber security health status dashboard . It also includes audit and compliance, controls health, project status, incident response process, vulnerability patching schedule, investigation process and training compliance. Pitch your topic with ease and precision using this Cyber Security Key Performance Indicators Metrics Dashboard Mockup PDF. This layout presents information on Cyber Security, Vulnerability Patching Schedule, Compliance Investigation Process. It is also available for immediate download and adjustment. So, changes can be made in the color, design, graphics or any other component to create a unique layout.

Risk Metrics Dashboard And Mitigation Expenditure Dashboard Ideas PDF
This slide illustrates facts and figures of expenditure incurred on different risks. It includes financial risk, operational risks and competition risks. Pitch your topic with ease and precision using this Risk Metrics Dashboard And Mitigation Expenditure Dashboard Ideas PDF. This layout presents information on Management, Expenditure, Risk. It is also available for immediate download and adjustment. So, changes can be made in the color, design, graphics or any other component to create a unique layout.
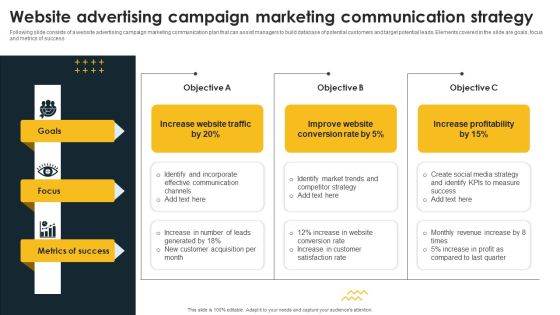
Website Advertising Campaign Marketing Communication Strategy Ideas PDF
Following slide consists of a website advertising campaign marketing communication plan that can assist managers to build database of potential customers and target potential leads. Elements covered in the slide are goals, focus and metrics of success Pitch your topic with ease and precision using this Website Advertising Campaign Marketing Communication Strategy Ideas PDF. This layout presents information on Goals, Focus, Metrics Success . It is also available for immediate download and adjustment. So, changes can be made in the color, design, graphics or any other component to create a unique layout.
Project Performance Dashboard With Tracking And Control Phase Background PDF
Following slide exhibits project performance dashboard with monitoring and control phase which can be used by project managers to review the overall project. It includes metrics like project cost performance, project performance, time vs project phase and percentage of project phase completed. Pitch your topic with ease and precision using this Project Performance Dashboard With Tracking And Control Phase Background PDF This layout presents information on Earned Value, Project Cost Performance, Project Performance. It is also available for immediate download and adjustment. So, changes can be made in the color, design, graphics or any other component to create a unique layout.
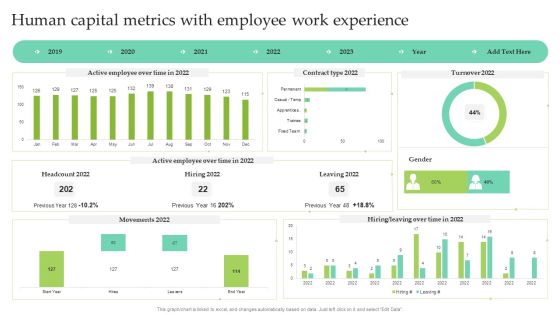
Human Capital Metrics With Employee Work Experience Ppt Show Images PDF
This graph or chart is linked to excel, and changes automatically based on data. Just left click on it and select Edit Data. Pitch your topic with ease and precision using this Human Capital Metrics With Employee Work Experience Ppt Show Images PDF. This layout presents information on Active Employee, Over Time, Contract Type 2022, Leaving 2022. It is also available for immediate download and adjustment. So, changes can be made in the color, design, graphics or any other component to create a unique layout.

Leading And Lagging Indicators Balanced Scorecard Pictures PDF
This slide showcase a balanced scorecard that enable managers to track leading lagging performance metric to improve their internal operations. It incorporates financial, customer, internal and learning and growth indicators of a organization. Pitch your topic with ease and precision using this Leading And Lagging Indicators Balanced Scorecard Pictures PDF. This layout presents information on Financial Indicator, Customer Indicator, Internal Indicator, Growth Indicator. It is also available for immediate download and adjustment. So, changes can be made in the color, design, graphics or any other component to create a unique layout.

30 60 90 Day Strategic Communication Program For Lead Generation Sample PDF
Following slide consists of a 30 60 90 day strategic communication plan that can assist managers to build database of potential customers and target potential leads. The elements covered in the slide are goals, focus and metrics of success Pitch your topic with ease and precision using this 30 60 90 Day Strategic Communication Program For Lead Generation Sample PDF. This layout presents information on Goals, Focus, Success. It is also available for immediate download and adjustment. So, changes can be made in the color, design, graphics or any other component to create a unique layout.
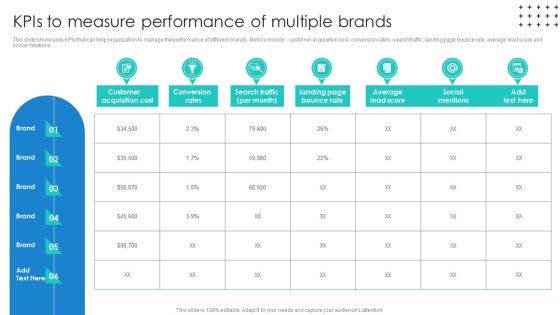
Promotional Techniques To Market Several Brands Among Target Groups Kpis To Measure Performance Mockup PDF
This slide showcases KPIs that can help organization to manage the performance of different brands. Metrics include - customer acquisition cost, conversion rates, search traffic, landing page bounce rate, average lead score and social mentions. If your project calls for a presentation, then Slidegeeks is your go-to partner because we have professionally designed, easy-to-edit templates that are perfect for any presentation. After downloading, you can easily edit Promotional Techniques To Market Several Brands Among Target Groups Kpis To Measure Performance Mockup PDF and make the changes accordingly. You can rearrange slides or fill them with different images. Check out all the handy templates
Robotic Process Automation Metrics Icon Download PDF
Pitch your topic with ease and precision using this Robotic Process Automation Metrics Icon Download PDF. This layout presents information on Automation Metrics Icon, Robotic Process. It is also available for immediate download and adjustment. So, changes can be made in the color, design, graphics or any other component to create a unique layout.

Data Quality Kpis Assessment Metrics For Operational Records Sample PDF
Pitch your topic with ease and precision using this Data Quality Kpis Assessment Metrics For Operational Records Sample PDF. This layout presents information on Data Quality, Assessment Metrics, Operational Records. It is also available for immediate download and adjustment. So, changes can be made in the color, design, graphics or any other component to create a unique layout.

Projects Data Quality Kpis Metrics Comparative Assessment Guidelines PDF
Pitch your topic with ease and precision using this Projects Data Quality Kpis Metrics Comparative Assessment Guidelines PDF. This layout presents information on Business Relevance, Value Related, Methods Related. It is also available for immediate download and adjustment. So, changes can be made in the color, design, graphics or any other component to create a unique layout.

KYC Transaction Monitoring System Business Security Mis Report Highlighting Risk And Fraud Metrics Introduction PDF
The following slide depicts management information system MIS report highlighting risk and fraud metrics. It provides information about regulatory environment, risk analysis, high risk customers, suspicious transaction reporting STR, transaction monitoring alerts, etc. Retrieve professionally designed KYC Transaction Monitoring System Business Security Mis Report Highlighting Risk And Fraud Metrics Introduction PDF to effectively convey your message and captivate your listeners. Save time by selecting pre made slideshows that are appropriate for various topics, from business to educational purposes. These themes come in many different styles, from creative to corporate, and all of them are easily adjustable and can be edited quickly. Access them as PowerPoint templates or as Google Slides themes. You do not have to go on a hunt for the perfect presentation because Slidegeeks got you covered from everywhere.

Actual Time Transaction Monitoring Software And Strategies Mis Report Highlighting Risk And Fraud Metrics Information PDF
The following slide depicts management information system MIS report highlighting risk and fraud metrics. It provides information about regulatory environment, risk analysis, high risk customers, suspicious transaction reporting STR, transaction monitoring alerts, etc. Explore a selection of the finest Actual Time Transaction Monitoring Software And Strategies Mis Report Highlighting Risk And Fraud Metrics Information PDF here. With a plethora of professionally designed and pre made slide templates, you can quickly and easily find the right one for your upcoming presentation. You can use our Actual Time Transaction Monitoring Software And Strategies Mis Report Highlighting Risk And Fraud Metrics Information PDF to effectively convey your message to a wider audience. Slidegeeks has done a lot of research before preparing these presentation templates. The content can be personalized and the slides are highly editable. Grab templates today from Slidegeeks.

Sales Risk Assessment For Profit Maximization Defining Key Metrics To Analyse Current Sales Performance Pictures PDF
The following slide showcases some metrics to evaluate existing sales performance due to execute effective risk management strategies. It includes elements such as opportunities, win rate, average time to win, average value per win, sales velocity etc. Want to ace your presentation in front of a live audience Our Sales Risk Assessment For Profit Maximization Defining Key Metrics To Analyse Current Sales Performance Pictures PDF can help you do that by engaging all the users towards you. Slidegeeks experts have put their efforts and expertise into creating these impeccable powerpoint presentations so that you can communicate your ideas clearly. Moreover, all the templates are customizable, and easy to edit and downloadable. Use these for both personal and commercial use.

Creating Transaction Monitoring Mis Report Highlighting Risk And Fraud Metrics Clipart PDF
The following slide depicts management information system MIS report highlighting risk and fraud metrics. It provides information about regulatory environment, risk analysis, high risk customers, suspicious transaction reporting STR, transaction monitoring alerts, etc. Explore a selection of the finest Creating Transaction Monitoring Mis Report Highlighting Risk And Fraud Metrics Clipart PDF here. With a plethora of professionally designed and pre-made slide templates, you can quickly and easily find the right one for your upcoming presentation. You can use our Creating Transaction Monitoring Mis Report Highlighting Risk And Fraud Metrics Clipart PDF to effectively convey your message to a wider audience. Slidegeeks has done a lot of research before preparing these presentation templates. The content can be personalized and the slides are highly editable. Grab templates today from Slidegeeks.

Supplier Scorecard Supplier Scorecard With Delivery Lead Time And Breakage Metrics Background PDF
Deliver an awe inspiring pitch with this creative supplier scorecard supplier scorecard with delivery lead time and breakage metrics background pdf bundle. Topics like delivery lead times, financial stability, prices, frequency price changes can be discussed with this completely editable template. It is available for immediate download depending on the needs and requirements of the user.
Website Leads Tracking Dashboard With Traffic Sources Infographics PDF
This slide showcases dashboard for lead generation that can help organziation to identify the traffic sources plus visitors and make changes in SEO of website. It also showcases key metrics that are bounce rate by week, visitors by user type, top channels by conversion, top campaign by conversion and top pages by conversion. Pitch your topic with ease and precision using this Website Leads Tracking Dashboard With Traffic Sources Infographics PDF. This layout presents information on Visitors User Type, Traffic Sources, Bounce Rate Week. It is also available for immediate download and adjustment. So, changes can be made in the color, design, graphics or any other component to create a unique layout.

Client Success Model With Metrics And Segmentation Ppt PowerPoint Presentation Portfolio Tips PDF
Pitch your topic with ease and precision using this client success model with metrics and segmentation ppt powerpoint presentation portfolio tips pdf. This layout presents information on people, culture, process, journey, technology. It is also available for immediate download and adjustment. So, changes can be made in the color, design, graphics or any other component to create a unique layout.
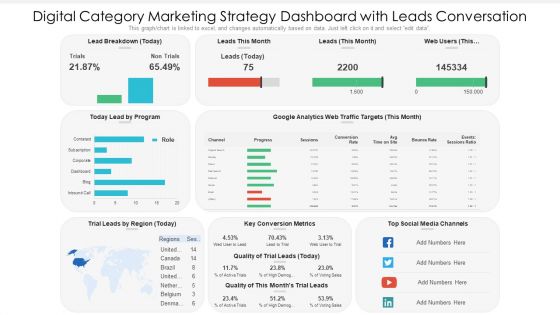
Digital Category Marketing Strategy Dashboard With Leads Conversation Ppt PowerPoint Presentation Slides Information PDF
This graph chart is linked to excel, and changes automatically based on data. Just left click on it and select edit data. Pitch your topic with ease and precision using this digital category marketing strategy dashboard with leads conversation ppt powerpoint presentation slides information pdf. This layout presents information on key conversion metrics, social media channels, lead by program. It is also available for immediate download and adjustment. So, changes can be made in the color, design, graphics or any other component to create a unique layout.

Digital Transformation Purpose And Key Performance Indicators Formats PDF
The slide shows a pie chart presenting objectives of conducting digital advancement in organization with KPIs. It includes KPIs like user satisfaction, economic, productive, trader control metrics, risk metrics, saving goals and advancements. Pitch your topic with ease and precision using this Digital Transformation Purpose And Key Performance Indicators Formats PDF. This layout presents information on Key Performance Indicators, Digital Transformation, Minimize Costs. It is also available for immediate download and adjustment. So, changes can be made in the color, design, graphics or any other component to create a unique layout.
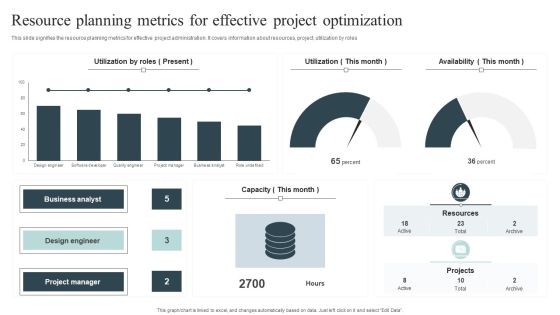
Resource Planning Metrics For Effective Project Optimization Brochure PDF
This slide signifies the resource planning metrics for effective project administration. It covers information about resources, project, utilization by roles.Pitch your topic with ease and precision using this Resource Planning Metrics For Effective Project Optimization Brochure PDF. This layout presents information on Business Analyst, Design Engineer, Project Manager. It is also available for immediate download and adjustment. So, changes can be made in the color, design, graphics or any other component to create a unique layout.
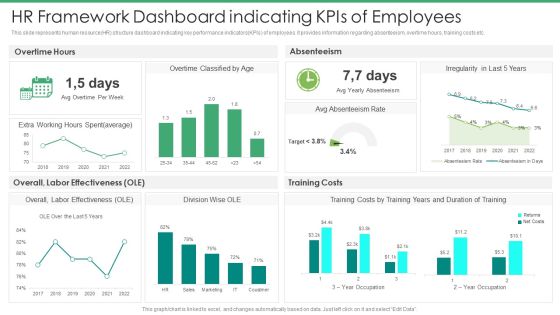
HR Framework Dashboard Indicating Kpis Of Employees Introduction PDF
This slide represents human resource HR structure dashboard indicating key performance indicators KPIs of employees. it provides information regarding absenteeism, overtime hours, training costs etc.Pitch your topic with ease and precision using this HR Framework Dashboard Indicating Kpis Of Employees Introduction PDF. This layout presents information on Absenteeism Rate, Costs, Average. It is also available for immediate download and adjustment. So, changes can be made in the color, design, graphics or any other component to create a unique layout.
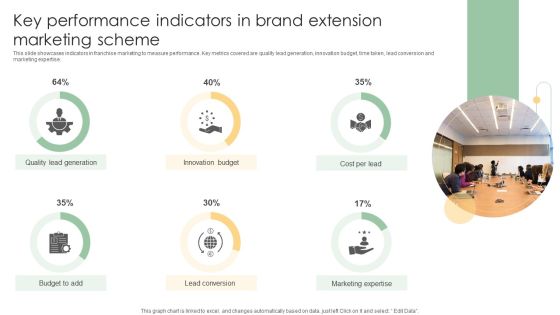
Key Performance Indicators In Brand Extension Marketing Scheme Ideas PDF
This slide showcases indicators in franchise marketing to measure performance. Key metrics covered are quality lead generation, innovation budget, time taken, lead conversion and marketing expertise.Pitch your topic with ease and precision using this Key Performance Indicators In Brand Extension Marketing Scheme Ideas PDF. This layout presents information on Quality Lead Generation, Innovation Budget, Lead Conversion. It is also available for immediate download and adjustment. So, changes can be made in the color, design, graphics or any other component to create a unique layout.

Prospective Buyer Retention Dashboard With Key Performance Indicators Themes PDF
This slide shows the dashboard representing the key performance metrics for retention of potential customers of the organization. It shows no. of active users, churn rate, cost of customer acquisition, their life time value, monthly recurring revenue etc.Pitch your topic with ease and precision using this Prospective Buyer Retention Dashboard With Key Performance Indicators Themes PDF. This layout presents information on Recurring Revenue, Revenue Growth, Customer Acquisition. It is also available for immediate download and adjustment. So, changes can be made in the color, design, graphics or any other component to create a unique layout.
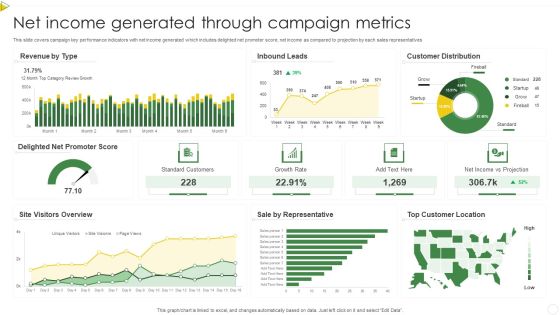
Net Income Generated Through Campaign Metrics Summary PDF
This slide covers campaign key performance indicators with net income generated which includes delighted net promoter score, net income as compared to projection by each sales representatives. Pitch your topic with ease and precision using this Net Income Generated Through Campaign Metrics Summary PDF. This layout presents information on Standard Customers, Growth Rate, Net Income. It is also available for immediate download and adjustment. So, changes can be made in the color, design, graphics or any other component to create a unique layout.

Customer NPS Metric Statistics Of Banking Industry Ppt Styles Microsoft PDF
This slide illustrates statistics of net promoter score NPS in banking industry. It provides information about summary, personal banking, business banking and wealth management. Pitch your topic with ease and precision using this Customer NPS Metric Statistics Of Banking Industry Ppt Styles Microsoft PDF. This layout presents information on Summary, Personal Banking, Business Banking, Wealth Management. It is also available for immediate download and adjustment. So, changes can be made in the color, design, graphics or any other component to create a unique layout.

Organization Financial Team Summary With Key Performance Indicators Clipart PDF
This slide represents a report prepared by the finance team showing the financial position of the organization with the help of key performance indicators. It demonstrates data related to current working capital, cash conversion cycle and vendor payment error rate of the company. Pitch your topic with ease and precision using this Organization Financial Team Summary With Key Performance Indicators Clipart PDF. This layout presents information on Current Working Capital, Cash Conversion Cycle. It is also available for immediate download and adjustment. So, changes can be made in the color, design, graphics or any other component to create a unique layout.

Marketing Team Performance Gap Assessment Professional PDF
This slide represents the performance gap analysis of the marketing team. The purpose of this slide is to demonstrate the key performance indicators of the marketing team, including their current state, desired state and gap. It also includes the reasons and solutions to achieve the desired state. Pitch your topic with ease and precision using this Marketing Team Performance Gap Assessment Professional PDF. This layout presents information on Organic Traffic, Digital Marketing ROI, Social Media Traffic. It is also available for immediate download and adjustment. So, changes can be made in the color, design, graphics or any other component to create a unique layout.

Multichannel Plan Framework With Web Spectrum Ppt Professional Background Images PDF
Pitch your topic with ease and precision using this multichannel plan framework with web spectrum ppt professional background images pdf. This layout presents information on strategy, marketing, operations, metrics, goal. It is also available for immediate download and adjustment. So, changes can be made in the color, design, graphics or any other component to create a unique layout.

HR Service Excellence Framework Role Of Centres Of Expertise In HR Transformations Professional PDF
This slide provides information regarding role of center of expertise in HR transformations in terms of risk management and compliance, inclusion and engagement, HR effectiveness, HR controller and workforce metrics and measurement. Get a simple yet stunning designed HR Service Excellence Framework Role Of Centres Of Expertise In HR Transformations Professional PDF. It is the best one to establish the tone in your meetings. It is an excellent way to make your presentations highly effective. So, download this PPT today from Slidegeeks and see the positive impacts. Our easy to edit HR Service Excellence Framework Role Of Centres Of Expertise In HR Transformations Professional PDF can be your go to option for all upcoming conferences and meetings. So, what are you waiting for Grab this template today.

Vendor Performance Assessment Matrix With Scoring Metrics Style PDF
This slide shows scoring metrics with vendor performance assessment matrix. It provides information about segments, process integration, convenience, support, performance, pricing, etc. Pitch your topic with ease and precision using this Vendor Performance Assessment Matrix With Scoring Metrics Style PDF. This layout presents information on Process Integration, Convenience, Performance. It is also available for immediate download and adjustment. So, changes can be made in the color, design, graphics or any other component to create a unique layout.
New Commodity Development Assessment Metrics Icons PDF
The following slide highlights the key metrics to evaluate product performance. It includes elements such as product wise revenue, time to the market etc.Pitch your topic with ease and precision using this New Commodity Development Assessment Metrics Icons PDF. This layout presents information on Annual Product, Wise Revenue, Shown Continuous. It is also available for immediate download and adjustment. So, changes can be made in the color, design, graphics or any other component to create a unique layout.

Ecommerce Website Performance Gap Assessment Information PDF
This slide represents the performance gap analysis of an ecommerce website. The purpose of this slide is to demonstrate the various key performance indicators used in website performance. The key components include sales, signups or leads, visit to signup rate, bounce rate, and unique visitors. Pitch your topic with ease and precision using this Ecommerce Website Performance Gap Assessment Information PDF. This layout presents information on Navigation System, Performance, Bounce Rate. It is also available for immediate download and adjustment. So, changes can be made in the color, design, graphics or any other component to create a unique layout.

Procurement Pricing Benchmarks Analysis Report With Key Metrics Designs PDF
This slide shows the report representing the procurement price benchmarks for various organizations. It represents analysis of market average, best-in-class and all others on the basis of procurement key metrics. Pitch your topic with ease and precision using this Procurement Pricing Benchmarks Analysis Report With Key Metrics Designs PDF. This layout presents information on Spend Under Management, Contract Complaint. It is also available for immediate download and adjustment. So, changes can be made in the color, design, graphics or any other component to create a unique layout.

Website Medical Checkup Key Metrics Themes PDF
The following slide showcases key metrics for checking website health score to boost performance. It includes key metrics like functionality, security, design, structure, content and engagement. Pitch your topic with ease and precision using this Website Medical Checkup Key Metrics Themes PDF. This layout presents information on Evaluate Performance, Environment, Metrics. It is also available for immediate download and adjustment. So, changes can be made in the color, design, graphics or any other component to create a unique layout.

Online Marketing Strategy For Lead Generation Types And Metrics Of Performance Metrics Rules PDF
If your project calls for a presentation, then Slidegeeks is your go-to partner because we have professionally designed, easy-to-edit templates that are perfect for any presentation. After downloading, you can easily edit Online Marketing Strategy For Lead Generation Types And Metrics Of Performance Metrics Rules PDF and make the changes accordingly. You can rearrange slides or fill them with different images. Check out all the handy templates

Quarterly Business Performance Review With Kpis And Targets Summary PDF
The following slide highlights the QBR summary to identify the performance gaps and plan future action. It constitutes of elements such as KPIs, targets, RAG status, achievements etc. Pitch your topic with ease and precision using this Quarterly Business Performance Review With Kpis And Targets Summary PDF. This layout presents information on Key Performance Indicators, Targets, Technology Service Management. It is also available for immediate download and adjustment. So, changes can be made in the color, design, graphics or any other component to create a unique layout.

Asset Assessment Dashboard With ROI Metrics Topics PDF
This slide illustrates asset valuation dashboard with return on investment metrics. It provides information about internal rate of return, investment type, deal size, asset type, Pitch your topic with ease and precision using this Asset Assessment Dashboard With ROI Metrics Topics PDF. This layout presents information on Investment Amount, Asset Valuation, Internal Return. It is also available for immediate download and adjustment. So, changes can be made in the color, design, graphics or any other component to create a unique layout.

Cash Flow Metrics To Measure Firm Operations Effectiveness Ppt Outline Infographic Template PDF
This slide showcases yearly cash conversion cycle to determine companys working capital management. It includes DSO, DIO, DPO and CCC that measure the average number of days organization takes to collect payment and pay bills. Pitch your topic with ease and precision using this Cash Flow Metrics To Measure Firm Operations Effectiveness Ppt Outline Infographic Template PDF. This layout presents information on Cash Conversion Cycle, 2019 To 2022, Cash Flow. It is also available for immediate download and adjustment. So, changes can be made in the color, design, graphics or any other component to create a unique layout.

Impact Of Feedback Received From Detractors On Customer NPS Metric Ppt Inspiration Visuals PDF
This slide illustrates statistics of net promoter score NPS in banking industry. It provides information about summary, personal banking, business banking and wealth management. Pitch your topic with ease and precision using this Impact Of Feedback Received From Detractors On Customer NPS Metric Ppt Inspiration Visuals PDF. This layout presents information on Business Environment, Feedback, Revenue. It is also available for immediate download and adjustment. So, changes can be made in the color, design, graphics or any other component to create a unique layout.

Human Resources Related Risk Metrics Dashboard Information PDF
This slide illustrates graphical representation of people key risk indicators. It includes indicators namely staff turnover, employee satisfaction, employee absenteeism etc. Pitch your topic with ease and precision using this Human Resources Related Risk Metrics Dashboard Information PDF. This layout presents information on Human Resources Related Risk Metrics Dashboard. It is also available for immediate download and adjustment. So, changes can be made in the color, design, graphics or any other component to create a unique layout.

Startup Business Financial Dashboard With Key Metrics Sample PDF
This slide represents the financial dashboard for startup company with key performance indicators. It includes details related to current working capital, cash conversion cycle in days and vendor payment error rate. Pitch your topic with ease and precision using this Startup Business Financial Dashboard With Key Metrics Sample PDF. This layout presents information on Cash Conversion Cycle, Current Working Capital, Current Liabilities Debt. It is also available for immediate download and adjustment. So, changes can be made in the color, design, graphics or any other component to create a unique layout.

Breaking Down Devops Performance Metrics Ppt Styles Template PDF
This template covers devOps breaking down performance KPIs indicators and metrics such as deployment frequency, lead time for changes etc. Deliver and pitch your topic in the best possible manner with this breaking down devops performance metrics ppt styles template pdf. Use them to share invaluable insights on service, deployment and impress your audience. This template can be altered and modified as per your expectations. So, grab it now.
Pareto Analysis Shipping Tracking Metrics Dashboard Guidelines PDF
This slide showcases dashboard for analyzing on-time delivery trends. It also includes KPIs such as Pareto analysis and on-time deliveries by shipping organizations. Pitch your topic with ease and precision using this Pareto Analysis Shipping Tracking Metrics Dashboard Guidelines PDF. This layout presents information on Pareto Analysis, Deliveries Trends, Shipping Organization. It is also available for immediate download and adjustment. So, changes can be made in the color, design, graphics or any other component to create a unique layout.

6 Level IT Security Plan Maturity Model Slides PDF
This slide represent 6 level cyber security strategy maturity model illustrating levels such as initial, developing, defined, managed, optimization and unified. Pitch your topic with ease and precision using this 6 Level IT Security Plan Maturity Model Slides PDF. This layout presents information on Awareness, Organization Security, Metrics To Measure. It is also available for immediate download and adjustment. So, changes can be made in the color, design, graphics or any other component to create a unique layout.

Design Software Playbook Engineers Software Design And Development Project Charter Slides PDF
This template covers project charter including project name, manager, timeline, problem statements, goals, success metrics, and project players. If your project calls for a presentation, then Slidegeeks is your go-to partner because we have professionally designed, easy-to-edit templates that are perfect for any presentation. After downloading, you can easily edit Design Software Playbook Engineers Software Design And Development Project Charter Slides PDF and make the changes accordingly. You can rearrange slides or fill them with different images. Check out all the handy templates.

Customer Care Employee Performance Gap Assessment Download PDF
This slide outlines performance gap analysis for customer care employees. The purpose of this slide is to showcase the various key performance indicators to measure the customer care agents performance. The main components include the number of calls, resolved issues, number of sales, and so on. Pitch your topic with ease and precision using this Customer Care Employee Performance Gap Assessment Download PDF. This layout presents information on Employee Engagement, Organize Training, Sales Numbers. It is also available for immediate download and adjustment. So, changes can be made in the color, design, graphics or any other component to create a unique layout.

Online Marketing Dashboard Showing Key Conversion Metrics Ppt PowerPoint Presentation Outline Example Topics PDF
Pitch your topic with ease and precision using this online marketing dashboard showing key conversion metrics ppt powerpoint presentation outline example topics pdf. This layout presents information on lead breakdown, leads, web user, top social media channels, key conversion metrics, trial leads by region. It is also available for immediate download and adjustment. So, changes can be made in the color, design, graphics or any other component to create a unique layout.

 Home
Home