Change Management Infographics

Onboarding Journey For Effective Client Communication Customer Onboarding Journey Survey Results Infographics PDF
This exhibits the survey results for client onboarding journey. Major results covered are customers change brands if purchase procedure is difficult, customers prefer personalization, highly engaged users make more purchases, etc. Take your projects to the next level with our ultimate collection of Onboarding Journey For Effective Client Communication Customer Onboarding Journey Survey Results Infographics PDF. Slidegeeks has designed a range of layouts that are perfect for representing task or activity duration, keeping track of all your deadlines at a glance. Tailor these designs to your exact needs and give them a truly corporate look with your own brand colors they will make your projects stand out from the rest.

Cone Layout Showing Techniques Of Market Data Analysis Ppt PowerPoint Presentation Summary Infographics PDF
Presenting this set of slides with name cone layout showing techniques of market data analysis ppt powerpoint presentation summary infographics pdf. This is a three stage process. The stages in this process are turf analysis, conjoint analysis, gap analysis. This is a completely editable PowerPoint presentation and is available for immediate download. Download now and impress your audience.
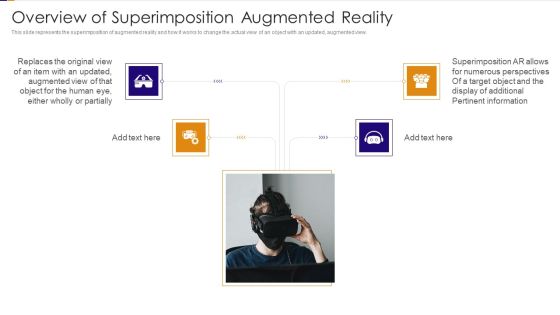
Overview Of Superimposition Augmented Reality Ppt PowerPoint Presentation File Infographics PDF
This slide represents the superimposition of augmented reality and how it works to change the actual view of an object with an updated, augmented view. This is a overview of superimposition augmented reality ppt powerpoint presentation file infographics pdf template with various stages. Focus and dispense information on four stages using this creative set, that comes with editable features. It contains large content boxes to add your information on topics like overview of superimposition augmented reality. You can also showcase facts, figures, and other relevant content using this PPT layout. Grab it now.
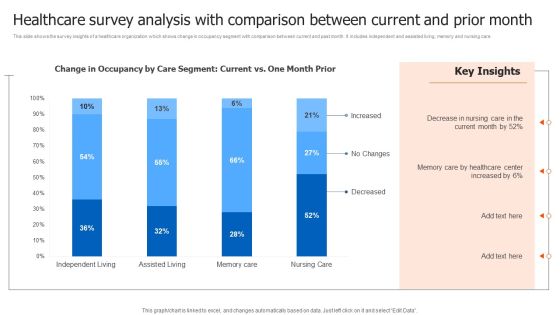
Healthcare Survey Analysis With Comparison Between Current And Prior Month Infographics PDF
This slide shows the survey insights of a healthcare organization which shows change in occupancy segment with comparison between current and past month. It includes independent and assisted living, memory and nursing care. Showcasing this set of slides titled Healthcare Survey Analysis With Comparison Between Current And Prior Month Infographics PDF. The topics addressed in these templates are Healthcare Survey Analysis, Comparison Between Current. All the content presented in this PPT design is completely editable. Download it and make adjustments in color, background, font etc. as per your unique business setting.

Project Quality Planning And Controlling Risk Assessment Matrix Ppt Infographics Portrait PDF
Presenting this set of slides with name project quality planning and controlling risk assessment matrix ppt infographics portrait pdf. This is a eight stage process. The stages in this process are risk assessment matrix. This is a completely editable PowerPoint presentation and is available for immediate download. Download now and impress your audience.

Business Assessment With Globe In Circle And Arrow Ppt PowerPoint Presentation File Infographics PDF
Presenting this set of slides with name business assessment with globe in circle and arrow ppt powerpoint presentation file infographics pdf. This is a one stage process. The stages in this process is business assessment with globe in circle and arrow. This is a completely editable PowerPoint presentation and is available for immediate download. Download now and impress your audience.
Pie Chart In Magnifying Glass For Business Performance Assessment Ppt PowerPoint Presentation Gallery Infographics PDF
Presenting this set of slides with name pie chart in magnifying glass for business performance assessment ppt powerpoint presentation gallery infographics pdf. This is a three stage process. The stages in this process are pie chart in magnifying glass for business performance assessment. This is a completely editable PowerPoint presentation and is available for immediate download. Download now and impress your audience.

3C Business Assessment Framework Infographics Ppt PowerPoint Presentation Portfolio Information PDF
Presenting this set of slides with name 3c business assessment framework infographics ppt powerpoint presentation portfolio information pdf. This is a three stage process. The stages in this process are customers, company, competitions. This is a completely editable PowerPoint presentation and is available for immediate download. Download now and impress your audience.

Strategic Business Framework For 3C Assessment Ppt PowerPoint Presentation Infographics Deck PDF
Presenting this set of slides with name strategic business framework for 3c assessment ppt powerpoint presentation infographics deck pdf. This is a three stage process. The stages in this process are customers, company, competitions. This is a completely editable PowerPoint presentation and is available for immediate download. Download now and impress your audience.
Saving Efforts Of Operation Effectiveness Vector Icon Ppt PowerPoint Presentation File Infographics PDF
Presenting saving efforts of operation effectiveness vector icon ppt powerpoint presentation file infographics pdf to dispense important information. This template comprises four stages. It also presents valuable insights into the topics including saving efforts of operation effectiveness vector icon. This is a completely customizable PowerPoint theme that can be put to use immediately. So, download it and address the topic impactfully.

Business Collaboration Problems For Effective Growth Ppt PowerPoint Presentation Gallery Infographics PDF
Presenting business collaboration problems for effective growth ppt powerpoint presentation gallery infographics pdf to dispense important information. This template comprises four stages. It also presents valuable insights into the topics including growth, analyze, invest. This is a completely customizable PowerPoint theme that can be put to use immediately. So, download it and address the topic impactfully.

Effective Milestone Scheduling Approach Comparison Ppt PowerPoint Presentation Summary Infographics PDF
Presenting effective milestone scheduling approach comparison ppt powerpoint presentation summary infographics pdf to provide visual cues and insights. Share and navigate important information on two stages that need your due attention. This template can be used to pitch topics like comparison, male, female. In addtion, this PPT design contains high-resolution images, graphics, etc, that are easily editable and available for immediate download.

Consumer Lending Procedure Basic Factors Of Credit Risk Assessment Ppt Infographics Information PDF
Presenting this set of slides with name consumer lending procedure basic factors of credit risk assessment ppt infographics information pdf. This is a four stage process. The stages in this process are character, capacity, capital, condition. This is a completely editable PowerPoint presentation and is available for immediate download. Download now and impress your audience.
Worker Annual Performance Assessment Checklist Ppt PowerPoint Presentation Infographics Maker PDF
Presenting this set of slides with name worker annual performance assessment checklist ppt powerpoint presentation infographics maker pdf. This is a three stage process. The stage in this process is worker annual performance assessment checklist. This is a completely editable PowerPoint presentation and is available for immediate download. Download now and impress your audience.

Code On Computer For Cyber Threat Assessment Ppt PowerPoint Presentation File Infographics PDF
Presenting this set of slides with name code on computer for cyber threat assessment ppt powerpoint presentation file infographics pdf. This is a three stage process. The stages in this process are code on computer for cyber threat assessment. This is a completely editable PowerPoint presentation and is available for immediate download. Download now and impress your audience.
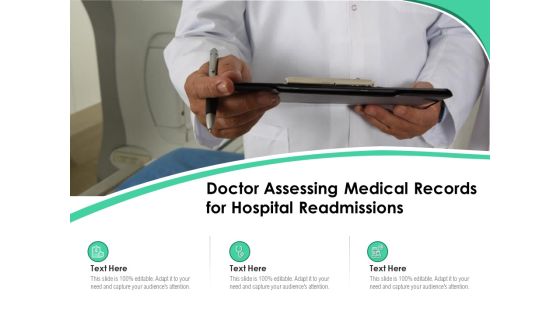
Doctor Assessing Medical Records For Hospital Readmissions Ppt PowerPoint Presentation File Infographics PDF
Presenting doctor assessing medical records for hospital readmissions ppt powerpoint presentation file infographics pdf to dispense important information. This template comprises three stages. It also presents valuable insights into the topics including doctor assessing medical records for hospital readmissions. This is a completely customizable PowerPoint theme that can be put to use immediately. So, download it and address the topic impactfully.

Performance Assessment And Sales Initiative Report Comparison Ppt Infographics Designs PDF
Presenting this set of slides with name performance assessment and sales initiative report comparison ppt infographics designs pdf. This is a three stage process. The stages in this process are whatsapp users, twitter users, facebook users. This is a completely editable PowerPoint presentation and is available for immediate download. Download now and impress your audience.
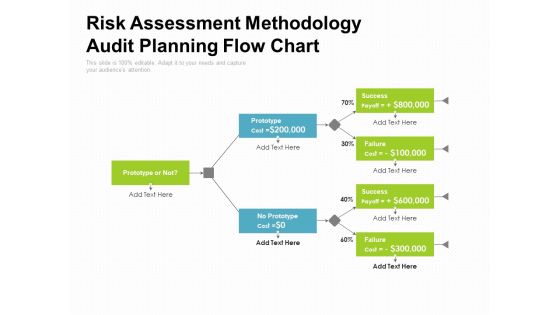
Risk Assessment Methodology Audit Planning Flow Chart Ppt PowerPoint Presentation Infographics Clipart Images PDF
Presenting this set of slides with name risk assessment methodology audit planning flow chart ppt powerpoint presentation infographics clipart images pdf. This is a three stage process. The stages in this process are prototype or not, prototype, failure, success. This is a completely editable PowerPoint presentation and is available for immediate download. Download now and impress your audience.
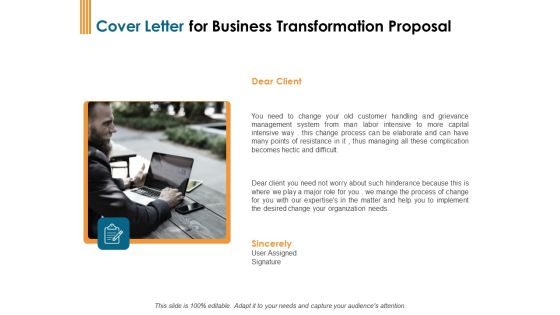
Enterprise Revamping Cover Letter For Business Transformation Proposal Ppt Inspiration Infographics PDF
This is a enterprise revamping cover letter for business transformation proposal ppt inspiration infographics pdf template with various stages. Focus and dispense information on one stages using this creative set, that comes with editable features. It contains large content boxes to add your information on topics like customer handling, management, organization needs, business. You can also showcase facts, figures, and other relevant content using this PPT layout. Grab it now.
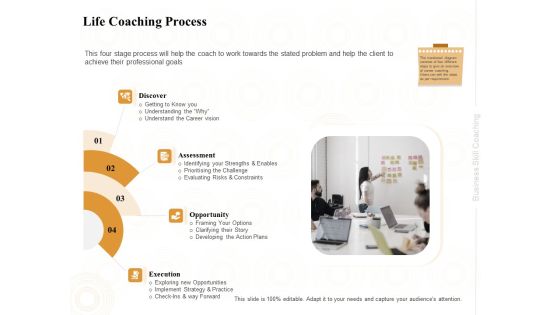
Enterprise Capabilities Training Life Coaching Process Ppt PowerPoint Presentation Infographics Guide PDF
Presenting this set of slides with name enterprise capabilities training life coaching process ppt powerpoint presentation infographics guide pdf. This is a four stage process. The stages in this process are discover, assessment, opportunity, execution, evaluating risks and constraints. This is a completely editable PowerPoint presentation and is available for immediate download. Download now and impress your audience.
Five Steps Of Suppliers Selection Process With Icons Ppt PowerPoint Presentation Infographics Information
Presenting this set of slides with name five steps of suppliers selection process with icons ppt powerpoint presentation infographics information. This is a five stage process. The stages in this process are criteria, investment evaluation, opportunity assessment. This is a completely editable PowerPoint presentation and is available for immediate download. Download now and impress your audience.
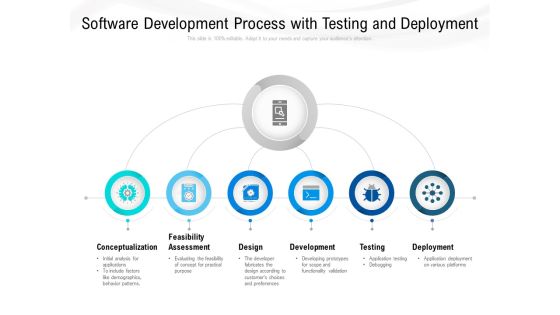
Software Development Process With Testing And Deployment Ppt PowerPoint Presentation Infographics Model
Presenting this set of slides with name software development process with testing and deployment ppt powerpoint presentation infographics model. This is a six stage process. The stages in this process are conceptualization, feasibility assessment, design, development, testing, deployment. This is a completely editable PowerPoint presentation and is available for immediate download. Download now and impress your audience.

Obsolescence Risk Mitigation Process Flow Chart Ppt PowerPoint Presentation File Infographics PDF
Persuade your audience using this obsolescence risk mitigation process flow chart ppt powerpoint presentation file infographics pdf. This PPT design covers one stages, thus making it a great tool to use. It also caters to a variety of topics including components managed reactively, risk assessment, number producers, stock available vs consumption rate, operational impact criticality, critical operation. Download this PPT design now to present a convincing pitch that not only emphasizes the topic but also showcases your presentation skills.

Agenda For WMS Application To Increase Integrated Logistics Effectiveness Infographics PDF
Presenting agenda for wms application to increase integrated logistics effectiveness infographics pdf to provide visual cues and insights. Share and navigate important information on five stages that need your due attention. This template can be used to pitch topics like management, effective logistics, management, analyzing, strategies. In addtion, this PPT design contains high resolution images, graphics, etc, that are easily editable and available for immediate download.

Enterprise Revamping 30 60 90 Days Plan For Business Transformation Proposal Ppt Infographics Template PDF
This is a enterprise revamping 30 60 90 days plan for business transformation proposal ppt infographics template pdf template with various stages. Focus and dispense information on three stages using this creative set, that comes with editable features. It contains large content boxes to add your information on topics like 30 60 90 days plan, business transformation. You can also showcase facts, figures, and other relevant content using this PPT layout. Grab it now.

Five Levels Of Business Cloud Based Technology Transfer System Ppt PowerPoint Presentation Infographics Grid PDF
Presenting five levels of business cloud based technology transfer system ppt powerpoint presentation infographics grid pdf to dispense important information. This template comprises five stages. It also presents valuable insights into the topics including current state collection and baseline, assessments and solutions options, business direction and expectations setting, future target, state development, strategy, realization development. This is a completely customizable PowerPoint theme that can be put to use immediately. So, download it and address the topic impactfully.

IT Alignment For Strategic Steps To Implement Business And IT Alignment Infographics PDF
This slide represents business and information technology alignment steps. It includes identifying business drivers, creating IT vision, assessing current alignment, identifying alignment gaps, prioritizing IT initiatives, evaluating implementation options, creating implementation options, and adjusting IT strategy. Do you have an important presentation coming up Are you looking for something that will make your presentation stand out from the rest Look no further than IT Alignment For Strategic Steps To Implement Business And IT Alignment Infographics PDF. With our professional designs, you can trust that your presentation will pop and make delivering it a smooth process. And with Slidegeeks, you can trust that your presentation will be unique and memorable. So why wait Grab IT Alignment For Strategic Steps To Implement Business And IT Alignment Infographics PDF today and make your presentation stand out from the rest.

Successful Corporate Technique Enhancing Firms Performance Strategic Digital Transformation Infographics PDF
This slide provides information regarding digital transformation initiative roadmap deployed by firm. Initiatives include consolidation of enterprise data centres, workforce optimization, financial transparency enhancement, etc. Whether you have daily or monthly meetings, a brilliant presentation is necessary. Successful Corporate Technique Enhancing Firms Performance Strategic Digital Transformation Infographics PDF can be your best option for delivering a presentation. Represent everything in detail using Successful Corporate Technique Enhancing Firms Performance Strategic Digital Transformation Infographics PDF and make yourself stand out in meetings. The template is versatile and follows a structure that will cater to your requirements. All the templates prepared by Slidegeeks are easy to download and edit. Our research experts have taken care of the corporate themes as well. So, give it a try and see the results.

Breakeven Assessment Chart With Unit Produced Ppt PowerPoint Presentation Infographics Clipart Images PDF
Presenting breakeven assessment chart with unit produced ppt powerpoint presentation infographics clipart images pdf to dispense important information. This template comprises four stages. It also presents valuable insights into the topics including key metric, pmo, fmo, difference, fixed costs, retail price per unit, unit produced, variable costs per unit. This is a completely customizable PowerPoint theme that can be put to use immediately. So, download it and address the topic impactfully.

Agile Best Practices For Effective Team Automation Processes In Agile Operations Infographics PDF
This is a agile best practices for effective team automation processes in agile operations infographics pdf template with various stages. Focus and dispense information on three stages using this creative set, that comes with editable features. It contains large content boxes to add your information on topics like manual testing, deployment, automated testing, manual deployment. You can also showcase facts, figures, and other relevant content using this PPT layout. Grab it now.

Agile Best Practices For Effective Team Table Of Contents Ppt Infographics Graphics Pictures PDF
This is a agile best practices for effective team table of contents ppt infographics graphics pictures pdf template with various stages. Focus and dispense information on nine stages using this creative set, that comes with editable features. It contains large content boxes to add your information on topics like performance, planning, development, methodologies, cost. You can also showcase facts, figures, and other relevant content using this PPT layout. Grab it now.

Agile Best Practices For Effective Team Scrum Methodology In Agile Operations Infographics PDF
This is a agile best practices for effective team scrum methodology in agile operations infographics pdf template with various stages. Focus and dispense information on three stages using this creative set, that comes with editable features. It contains large content boxes to add your information on topics like planning, scrum master, team, product owner. You can also showcase facts, figures, and other relevant content using this PPT layout. Grab it now.

Effectivity Associated To Target Market Create Brand Equity Ppt Infographics Demonstration PDF
This is a effectivity associated to target market create brand equity ppt infographics demonstration pdf template with various stages. Focus and dispense information on five stages using this creative set, that comes with editable features. It contains large content boxes to add your information on topics like brand loyalty, brand awareness, perceived quality, brand association, marketing. You can also showcase facts, figures, and other relevant content using this PPT layout. Grab it now.

Business Investigation To Assess The Market Size Ppt PowerPoint Presentation Infographics Graphic Images
Presenting this set of slides with name business investigation to assess the market size ppt powerpoint presentation infographics graphic images. This is a four stage process. The stages in this process are measure company health, identify technological assets and intellectual property roadmap, understand market and industry landscape, assess the market size and market opportunity. This is a completely editable PowerPoint presentation and is available for immediate download. Download now and impress your audience.

Vicious Circle Effect On Quality Assurance Post It Notes Ppt Infographics Brochure PDF
This is a vicious circle effect on quality assurance post it notes ppt infographics brochure pdf template with various stages. Focus and dispense information on three stages using this creative set, that comes with editable features. It contains large content boxes to add your information on topics like post it notes. You can also showcase facts, figures, and other relevant content using this PPT layout. Grab it now.
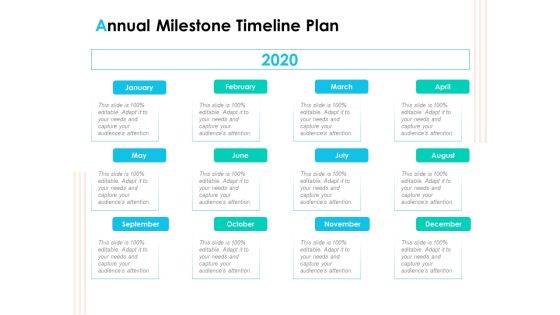
Effective Milestone Scheduling Approach Annual Milestone Timeline Plan Ppt PowerPoint Presentation Infographics Aids PDF
This is a effective milestone scheduling approach annual milestone timeline plan ppt powerpoint presentation infographics aids pdf template with various stages. Focus and dispense information on twelve stages using this creative set, that comes with editable features. It contains large content boxes to add your information on topics like annual milestone, timeline, plan, 2020. You can also showcase facts, figures, and other relevant content using this PPT layout. Grab it now.

Five Steps Of Effective Investment Plan Ppt PowerPoint Presentation Portfolio Infographics PDF
Presenting five steps of effective investment plan ppt powerpoint presentation portfolio infographics pdf to dispense important information. This template comprises five stages. It also presents valuable insights into the topics including margin of safety, invest in assets you understand, measuring success by the underlying operating, performance of the business, not the stock price, be rational about price, minimize costs. This is a completely customizable PowerPoint theme that can be put to use immediately. So, download it and address the topic impactfully.
Enterprise Assessment Strategy Performance Ppt PowerPoint Presentation Infographics Design Ideas Cpb
Presenting this set of slides with name enterprise assessment strategy performance ppt powerpoint presentation infographics design ideas cpb. This is an editable Powerpoint four stages graphic that deals with topics like enterprise assessment strategy performance to help convey your message better graphically. This product is a premium product available for immediate download and is 100 percent editable in Powerpoint. Download this now and use it in your presentations to impress your audience.
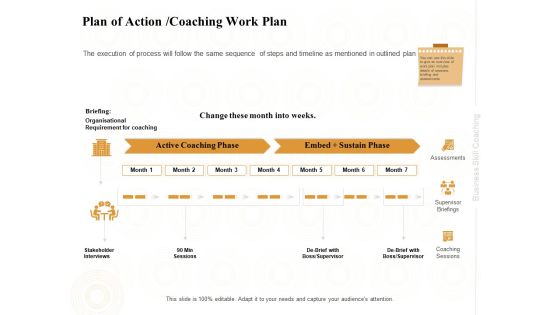
Enterprise Capabilities Training Plan Of Action Coaching Work Plan Ppt PowerPoint Presentation Infographics Structure PDF
Presenting this set of slides with name enterprise capabilities training plan of action coaching work plan ppt powerpoint presentation infographics structure pdf. This is a seven stage process. The stages in this process are active coaching phase, embed sustain phase, stakeholder interviews, 90 min sessions, de brief boss, supervisor, coaching sessions, supervisor briefings, assessments. This is a completely editable PowerPoint presentation and is available for immediate download. Download now and impress your audience.

Capacity Building With Critical Thinking And Evaluation Ppt Infographics Sample PDF
Presenting this set of slides with name capacity building with critical thinking and evaluation ppt infographics sample pdf. This is a eight stage process. The stages in this process are creativity, critical thinking and evaluation, cultural and social understanding, collaboration, functional skill, e safety, effective communication, the ability to find and select information. This is a completely editable PowerPoint presentation and is available for immediate download. Download now and impress your audience.

Brand Personality Improvement To Increase Profits Types Of Branding Personal Product Infographics PDF
This slide provides information regarding different kinds of branding in terms of personal, product, geographic, corporate. They are assessed over goal, impact and ideal for. This Brand Personality Improvement To Increase Profits Types Of Branding Personal Product Infographics PDF is perfect for any presentation, be it in front of clients or colleagues. It is a versatile and stylish solution for organizing your meetings. The Brand Personality Improvement To Increase Profits Types Of Branding Personal Product Infographics PDF features a modern design for your presentation meetings. The adjustable and customizable slides provide unlimited possibilities for acing up your presentation. Slidegeeks has done all the homework before launching the product for you. So, do not wait, grab the presentation templates today.

Components Of Sales Training Program With Stage Gate Program Ppt PowerPoint Presentation Infographics Format Ideas PDF
Presenting this set of slides with name components of sales training program with stage gate program ppt powerpoint presentation infographics format ideas pdf. This is a three stage process. The stages in this process are advance sales force assessment program, sales improvement program, stage gate program. This is a completely editable PowerPoint presentation and is available for immediate download. Download now and impress your audience.

HR Technology Capability Model Human Resource Information System For Organizational Effectiveness Infographics PDF
These focus areas must keep on priority in order to deal the technology disruption in HR system. This is a Hr Technology Capability Model Human Resource Information System For Organizational Effectiveness Infographics Pdf template with various stages. Focus and dispense information on two stages using this creative set, that comes with editable features. It contains large content boxes to add your information on topics like employee, recruitment, sourcing, organization, analytics. You can also showcase facts, figures, and other relevant content using this PPT layout. Grab it now.

Training To Become Effective Hybrid Team Leader Training Program Infographics PDF
This slide covers training to become effective hybrid team leader. It involves strategies such as build trust and inclusion, communicate, create strong team culture and drive accountability.Presenting Training To Become Effective Hybrid Team Leader Training Program Infographics PDF to dispense important information. This template comprises four stages. It also presents valuable insights into the topics including Communicate Well, Drive Accountability, Working Environment. This is a completely customizable PowerPoint theme that can be put to use immediately. So, download it and address the topic impactfully.
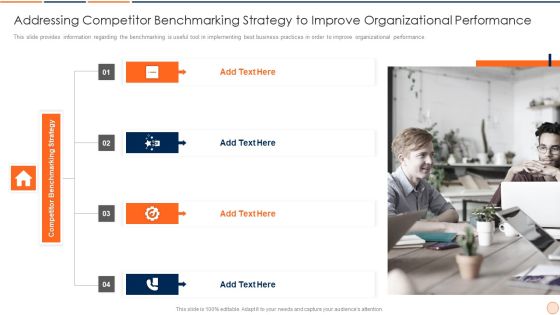
Strategic Business Plan Effective Tools And Templates Set 1 Addressing Competitor Benchmarking Strategy Infographics PDF
This slide provides information regarding the benchmarking is useful tool in implementing best business practices in order to improve organizational performance. This is a strategic business plan effective tools and templates set 1 addressing competitor benchmarking strategy infographics pdf template with various stages. Focus and dispense information on four stages using this creative set, that comes with editable features. It contains large content boxes to add your information on topics like addressing competitor benchmarking strategy to improve organizational performance . You can also showcase facts, figures, and other relevant content using this PPT layout. Grab it now.

Ascertain Primary Stage For Successful Application Development Impact Of Effective Product Infographics PDF
This slide provides information regarding double diamond approach for implementing product discovery with different phases including problem reframing, delivering solutions. This is a ascertain primary stage for successful application development impact of effective product infographics pdf template with various stages. Focus and dispense information on three stages using this creative set, that comes with editable features. It contains large content boxes to add your information on topics like communicate, customers, teams, techniques. You can also showcase facts, figures, and other relevant content using this PPT layout. Grab it now.
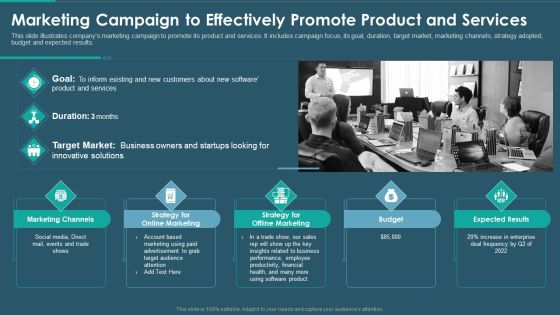
Sales And Promotion Playbook Marketing Campaign To Effectively Promote Infographics PDF
This slide illustrates companys marketing campaign to promote its product and services. It includes campaign focus, its goal, duration, target market, marketing channels, strategy adopted, budget and expected results. This is a sales and promotion playbook marketing campaign to effectively promote infographics pdf template with various stages. Focus and dispense information on three stages using this creative set, that comes with editable features. It contains large content boxes to add your information on topics like marketing channels, strategy for online marketing, strategy for offline marketing, budget, expected results. You can also showcase facts, figures, and other relevant content using this PPT layout. Grab it now.

Strategic Options Assessment And Selection Criteria Ppt PowerPoint Presentation File Infographics PDF
The slide contains evaluation criteria to select and prioritize best strategic options for effective organisational decision making. It includes three criteria such as suitability, acceptability and feasibility. Persuade your audience using this Strategic Options Assessment And Selection Criteria Ppt PowerPoint Presentation File Infographics PDF. This PPT design covers three stages, thus making it a great tool to use. It also caters to a variety of topics including Acceptability, Suitability, Feasibility. Download this PPT design now to present a convincing pitch that not only emphasizes the topic but also showcases your presentation skills.
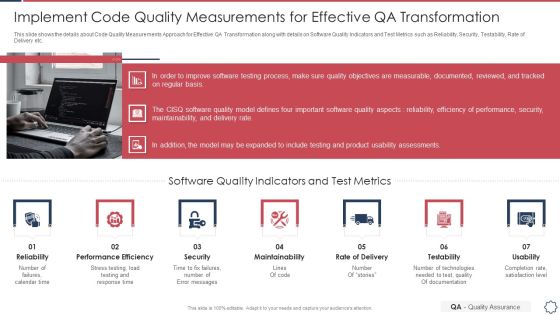
Quality Assurance Transformation Strategies To Improve Business Performance Efficiency Implement Code Quality Measurements Infographics PDF
This slide shows the details about Code Quality Measurements Approach for Effective QA Transformation along with details on Software Quality Indicators and Test Metrics such as Reliability, Security, Testability, Rate of Delivery etc. Presenting quality assurance transformation strategies to improve business performance efficiency implement code quality measurements infographics pdf to provide visual cues and insights. Share and navigate important information on seven stages that need your due attention. This template can be used to pitch topics like performance efficiency, maintainability, rate of delivery, testability, usability. In addtion, this PPT design contains high resolution images, graphics, etc, that are easily editable and available for immediate download.

Tactical Planning For Marketing And Commercial Advancement Impact Of PESTLE Infographics PDF
In the following slide Analyze the Political, Economical, Social, Technological, Legal and Environmental factors that may effect your company. This is a tactical planning for marketing and commercial advancement impact of pestle infographics pdf template with various stages. Focus and dispense information on six stages using this creative set, that comes with editable features. It contains large content boxes to add your information on topics like political, economical, social, technological, legal. You can also showcase facts, figures, and other relevant content using this PPT layout. Grab it now.

Strategies To Deploy Diversity In Workplace Training Plan To Inculcate Inclusive Leadership Traits Infographics PDF
This slide showcase the training plan to inculcate inclusive leadership traits in existing managers and team leaders. It also provides information regarding the training module, expected benefits, training duration, mode of training along with commence and expected completion date.Are you searching for a Strategies To Deploy Diversity In Workplace Training Plan To Inculcate Inclusive Leadership Traits Infographics PDF that is uncluttered, straightforward, and original. Its easy to edit, and you can change the colors to suit your personal or business branding. For a presentation that expresses how much effort youve put in, this template is ideal With all of its features, including tables, diagrams, statistics, and lists, its perfect for a business plan presentation. Make your ideas more appealing with these professional slides. Download Strategies To Deploy Diversity In Workplace Training Plan To Inculcate Inclusive Leadership Traits Infographics PDF from Slidegeeks today.
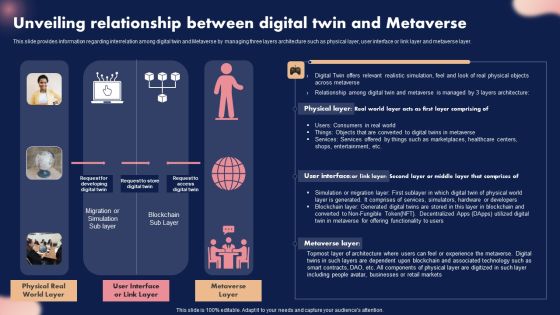
Unveiling Relationship Between Digital Twin And Metaverse Ppt Infographics Background Designs PDF
This slide provides information regarding interrelation among digital twin and Metaverse by managing three layers architecture such as physical layer, user interface or link layer and metaverse layer. Find highly impressive Unveiling Relationship Between Digital Twin And Metaverse Ppt Infographics Background Designs PDF on Slidegeeks to deliver a meaningful presentation. You can save an ample amount of time using these presentation templates. No need to worry to prepare everything from scratch because Slidegeeks experts have already done a huge research and work for you. You need to download Unveiling Relationship Between Digital Twin And Metaverse Ppt Infographics Background Designs PDF for your upcoming presentation. All the presentation templates are 100 percent editable and you can change the color and personalize the content accordingly. Download now.

Checklist To Implement Digital Twin Technology Ppt PowerPoint Presentation File Infographics PDF
This slide represents the checklist to implement digital twin technology in the company, including updating data security protocols, managing data quality, and training the team. Are you searching for a Checklist To Implement Digital Twin Technology Ppt PowerPoint Presentation File Infographics PDF that is uncluttered, straightforward, and original Its easy to edit, and you can change the colors to suit your personal or business branding. For a presentation that expresses how much effort you have put in, this template is ideal. With all of its features, including tables, diagrams, statistics, and lists, its perfect for a business plan presentation. Make your ideas more appealing with these professional slides. Download Checklist To Implement Digital Twin Technology Ppt PowerPoint Presentation File Infographics PDF from Slidegeeks today.

Enterprise Service Bus System Integration And Deployment Model Themes PDF Infographics PDF
This slide covers enterprise service bus system and integration model to enhance operations. It highlights human resource management system, customer relationship management, resource planning and content management system. Pitch your topic with ease and precision using this Enterprise Service Bus System Integration And Deployment Model Themes PDF Infographics PDF. This layout presents information on Enterprise Service Bus, Complex Maintenance. It is also available for immediate download and adjustment. So, changes can be made in the color, design, graphics or any other component to create a unique layout.

Business Research Model For Strategy Formulation Ppt PowerPoint Presentation Slides Infographics
Presenting this set of slides with name business research model for strategy formulation ppt powerpoint presentation slides infographics. This is a five stage process. The stages in this process are due diligence, market analysis, competitive benchmarking, internal analysis, technology assessment, strategy formulation. This is a completely editable PowerPoint presentation and is available for immediate download. Download now and impress your audience.

Company Introduction And Segment Impact Shareholder Decisions With Stakeholder Administration Infographics PDF
This slide shows the introduction related to the company with its segments details and other details such as incorporated year, headquarter details, CEO name, total revenue, etc.Find highly impressive Company Introduction And Segment Impact Shareholder Decisions With Stakeholder Administration Infographics PDF on Slidegeeks to deliver a meaningful presentation. You can save an ample amount of time using these presentation templates. No need to worry to prepare everything from scratch because Slidegeeks experts have already done a huge research and work for you. You need to download Company Introduction And Segment Impact Shareholder Decisions With Stakeholder Administration Infographics PDF for your upcoming presentation. All the presentation templates are 100 precent editable and you can change the color and personalize the content accordingly. Download now.

Design Software Playbook Engineers Software Development Source Control Rules And Process Infographics PDF
This template covers product development resource planning. It includes the projects roles responsibilities, task allocated, name, status, starting and ending date.Are you searching for a Design Software Playbook Engineers Software Development Source Control Rules And Process Infographics PDF that is uncluttered, straightforward, and original Its easy to edit, and you can change the colors to suit your personal or business branding. For a presentation that expresses how much effort you ve put in, this template is ideal With all of its features, including tables, diagrams, statistics, and lists, its perfect for a business plan presentation. Make your ideas more appealing with these professional slides. Download Design Software Playbook Engineers Software Development Source Control Rules And Process Infographics PDF from Slidegeeks today.

Evaluating Sales Revenue Budget To Control Risks Ppt Slides Infographics PDF
The following slide depicts the projected five year sales revenue budget to evaluate companys future performance. It mainly includes elements such as total units in pipeline, growth and conversion rate, annual units to be sold, price per unit, total revenue etc. Are you searching for a Evaluating Sales Revenue Budget To Control Risks Ppt Slides Infographics PDF that is uncluttered, straightforward, and original Its easy to edit, and you can change the colors to suit your personal or business branding. For a presentation that expresses how much effort you have put in, this template is ideal With all of its features, including tables, diagrams, statistics, and lists, its perfect for a business plan presentation. Make your ideas more appealing with these professional slides. Download Evaluating Sales Revenue Budget To Control Risks Ppt Slides Infographics PDF from Slidegeeks today.
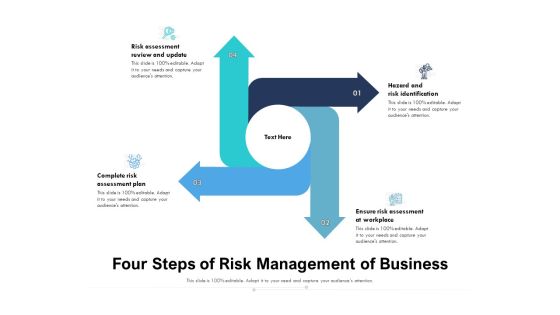
Four Steps Of Risk Management Of Business Ppt PowerPoint Presentation Infographic Template Infographic Template PDF
Persuade your audience using this four steps of risk management of business ppt powerpoint presentation infographic template infographic template pdf. This PPT design covers four stages, thus making it a great tool to use. It also caters to a variety of topics including risk assessment review and update, complete risk assessment plan, hazard and risk identification, ensure risk assessment at workplace. Download this PPT design now to present a convincing pitch that not only emphasizes the topic but also showcases your presentation skills.

CRM Pipeline Administration Determine Essential Pipeline Metrics Ppt Infographics Show PDF
This slide provides information regarding the essential pipeline metrics such as opportunity dollar size vs. average won deal size, opportunity age vs. win cycle and win rate. Find highly impressive CRM Pipeline Administration Determine Essential Pipeline Metrics Ppt Infographics Show PDF on Slidegeeks to deliver a meaningful presentation. You can save an ample amount of time using these presentation templates. No need to worry to prepare everything from scratch because Slidegeeks experts have already done a huge research and work for you. You need to download CRM Pipeline Administration Determine Essential Pipeline Metrics Ppt Infographics Show PDF for your upcoming presentation. All the presentation templates are 100 percent editable and you can change the color and personalize the content accordingly. Download now.

 Home
Home