AI PPT Maker
Templates
PPT Bundles
Design Services
Business PPTs
Business Plan
Management
Strategy
Introduction PPT
Roadmap
Self Introduction
Timelines
Process
Marketing
Agenda
Technology
Medical
Startup Business Plan
Cyber Security
Dashboards
SWOT
Proposals
Education
Pitch Deck
Digital Marketing
KPIs
Project Management
Product Management
Artificial Intelligence
Target Market
Communication
Supply Chain
Google Slides
Research Services
 One Pagers
All Categories
-
Home
- Customer Favorites
- Capital Market
Capital Market

Business Model Innovation Ppt PowerPoint Presentation File Infographic Template
This is a business model innovation ppt powerpoint presentation file infographic template. This is a three stage process. The stages in this process are revenue model innovation, customer model innovation, organizational model innovation.
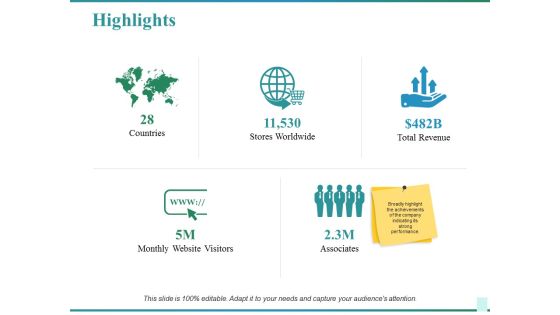
Highlights Ppt PowerPoint Presentation Slides Styles
This is a highlights ppt powerpoint presentation slides styles. This is a five stage process. The stages in this process are countries, stores worldwide, total revenue, associates, monthly website visitors.
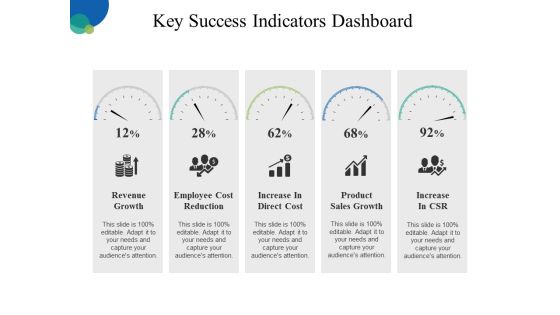
Key Success Indicators Dashboard Ppt PowerPoint Presentation Outline Slideshow
This is a key success indicators dashboard ppt powerpoint presentation outline slideshow. This is a five stage process. The stages in this process are revenue growth, employee cost reduction, increase in direct cost, product sales growth, increase in csr.

Customer Success Vs Customer Service Ppt PowerPoint Presentation Ideas Design Templates
This is a customer success vs customer service ppt powerpoint presentation ideas design templates. This is a two stage process. The stages in this process are proactive, customer goal achievement, revenue generating, reactive, cost centre.

Cost And Benefits Of New Product Ppt PowerPoint Presentation Professional Summary
This is a cost and benefits of new product ppt powerpoint presentation professional summary. This is a three stage process. The stages in this process are revenue increasing, cost decreasing, recurrent costs, total benefits, business.

Barriers To Digital Transformation Ppt PowerPoint Presentation Styles Backgrounds
This is a barriers to digital transformation ppt powerpoint presentation styles backgrounds. This is a six stage process. The stages in this process are processes, digital skills shortage, data issues, short term revenue targets, employee training.
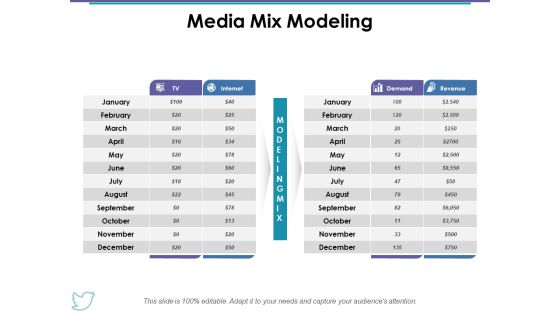
Media Mix Modeling Ppt PowerPoint Presentation Gallery Example
This is a media mix modeling ppt powerpoint presentation gallery example. This is a two stage process. The stages in this process are media mix modeling, demand, revenue, business, table.
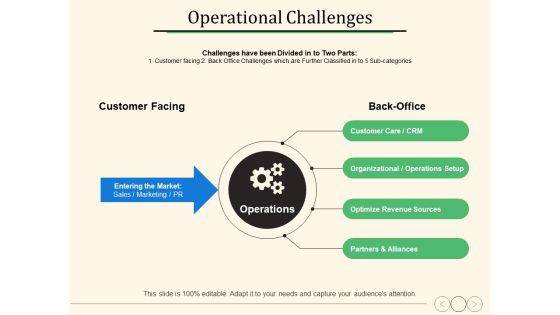
Operational Challenges Ppt PowerPoint Presentation Layouts Themes
This is a operational challenges ppt powerpoint presentation layouts themes. This is a four stage process. The stages in this process are optimize revenue sources, partners and alliances, business, management.

Eight Stages Of Business Timeline With Addition Of New Strategy Ppt PowerPoint Presentation File Graphics
Presenting this set of slides with name eight stages of business timeline with addition of new strategy ppt powerpoint presentation file graphics. This is a eight stage process. The stages in this process are sales revenue target, gross sales revenue, addition of new strategy, complete, review plan. This is a completely editable PowerPoint presentation and is available for immediate download. Download now and impress your audience.

Objectives Project Management Information System Ppt PowerPoint Presentation Ideas Deck Cpb
Presenting this set of slides with name new revenue recognition rules ppt powerpoint presentation model picture cpb. This is an editable Powerpoint four stages graphic that deals with topics like new revenue recognition rules to help convey your message better graphically. This product is a premium product available for immediate download and is 100 percent editable in Powerpoint. Download this now and use it in your presentations to impress your audience.
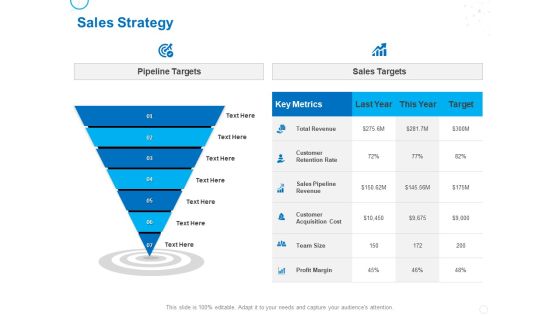
Service Strategy And Service Lifecycle Implementation Sales Strategy Ppt Layouts Master Slide PDF
Presenting this set of slides with name service strategy and service lifecycle implementation sales strategy ppt layouts master slide pdf. This is a seven stage process. The stages in this process are pipeline targets, sales targets, key metrics, customer retention rate, sales pipeline revenue, sales pipeline revenue, customer acquisition cost, team size, profit margin. This is a completely editable PowerPoint presentation and is available for immediate download. Download now and impress your audience.

Financial Ppt PowerPoint Presentation Inspiration
This is a financial ppt powerpoint presentation inspiration. This is a six stage process. The stages in this process are total assets, total tax paid, loan, revenue, deposits, net income.

Business Framework Shareholder Value PowerPoint Presentation
Display the shareholder value and financial perspectives in your financial presentation by using this exclusive PPT. this business framework PPT contains the graphic of sequential network of shareholders. Use this PPT and build exclusive presentation for share value and customer perspective related topics.

Management Buyout Strategy Sample Diagram Presentation Powerpoint
This is a management buyout strategy sample diagram presentation powerpoint. This is a three stage process. The stages in this process are target, venture capitalist, lenders, debit equity for purchase, cash flows, income, assets, equity stake, profit, debit repayment, debit financial, financial sponsor.\n\n\n\n\n\n\n\n

Cost Assessment Diagram Example Of Ppt
This is a cost assessment diagram example of ppt. This is a eight stage process. The stages in this process are define the scope of the decision or option, analyze financial performance, identify relevant costs and saving inventory, interpret the results make the decision, full cost assessment, total cost assessment, recognized contingent costs, direct and indirect financial costs.

Business Strategy Of Financing Sources Ppt PowerPoint Presentation Summary Background Images
Presenting this set of slides with name business strategy of financing sources ppt powerpoint presentation summary background images. This is a four stage process. The stages in this process are financial strategy, business financial trend, business strategy. This is a completely editable PowerPoint presentation and is available for immediate download. Download now and impress your audience.
Finance Growth Plan Vector Icon Ppt PowerPoint Presentation Model Layouts
Presenting this set of slides with name finance growth plan vector icon ppt powerpoint presentation model layouts. This is a one stage process. The stages in this process are financial strategy, business financial trend, business strategy. This is a completely editable PowerPoint presentation and is available for immediate download. Download now and impress your audience.

Picture Of Chess Game For Strategic Planning Ppt PowerPoint Presentation Summary Deck
Presenting this set of slides with name picture of chess game for strategic planning ppt powerpoint presentation summary deck. This is a seven stage process. The stages in this process are financial strategy, business financial trend, business strategy. This is a completely editable PowerPoint presentation and is available for immediate download. Download now and impress your audience.
Four Perspectives In Strategy Map With Icons Ppt PowerPoint Presentation Guidelines
Presenting this set of slides with name four perspectives in strategy map with icons ppt powerpoint presentation guidelines. This is a four stage process. The stages in this process are financial perspective involves roi, growth, profit and more, learning and growth perspective that handles training of employees in terms of new technology, business process perspective that deals with company internal processes, customer perspective that involve reviews and feedback from customers. This is a completely editable PowerPoint presentation and is available for immediate download. Download now and impress your audience.

Project Goal For Request For Quotation Proposal Ppt PowerPoint Presentation Samples
Presenting this set of slides with name project goal for request for quotation proposal ppt powerpoint presentation samples. This is a three stage process. The stages in this process are increase revenue, global partnership promotion, goal. This is a completely editable PowerPoint presentation and is available for immediate download. Download now and impress your audience.

Brand Identity How Build It Brand Loyalty Ppt Ideas Slide Portrait PDF
Presenting this set of slides with name brand identity how build it brand loyalty ppt ideas slide portrait pdf. This is a six stage process. The stages in this process are the potential revenue up for grabs from switching among consumer brands, a 80 percent of a business profits come from 20 percent of its customers, 77 percent of customers still say they have no relationship with a brand. This is a completely editable PowerPoint presentation and is available for immediate download. Download now and impress your audience.

Customer Lifetime Value Calculations Powerpoint Layout
This is a customer lifetime value calculations powerpoint layout. This is a six stage process. The stages in this process are average acquisition cost, average customer revenue, average customer profit, customer retention rate, discount rate.

Companys Strength With Brand Equity Ppt PowerPoint Presentation Outline Infographics PDF
Persuade your audience using this companys strength with brand equity ppt powerpoint presentation outline infographics pdf. This PPT design covers four stages, thus making it a great tool to use. It also caters to a variety of topics including loyalty, revenue, brand equity, ownership, prospecting. Download this PPT design now to present a convincing pitch that not only emphasizes the topic but also showcases your presentation skills.
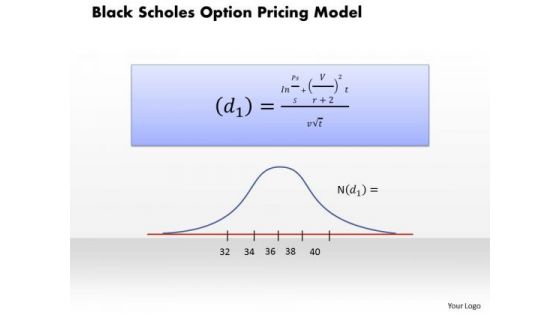
Business Framework Black Scholes Ption Pricing Model PowerPoint Presentation
This power point diagram has been crafted with graphic of black scholes ption pricing model. Use this model for various pricing valuation. Explain its graphical representation with our exclusive model. Use this diagram slide for financial presentation.

Business Framework Bond Prices And Yields PowerPoint Presentation
This power point diagram slide has been crafted with graphic of statistics of bond price and yields. Display the dependency in-between these two fields with this innovative diagram slide. This slide is very useful for financial presentations.
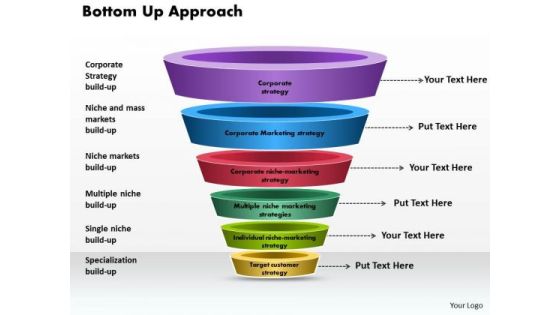
Business Framework Bottom Up Approach PowerPoint Presentation
This power point diagram slide has been crafted with bottom up approach. In this diagram, we have used multilevel funnel diagram with individual state. Use this diagram for your financial presentations and display bottom up approach in an graphical manner.
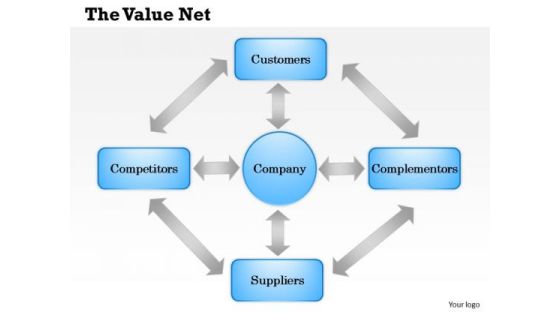
Business Framework The Value Net PowerPoint Presentation
This business power point diagram template has been designed with graphic of multiple staged. This diagram template can be used for value net calculation display in any financial and business presentations.
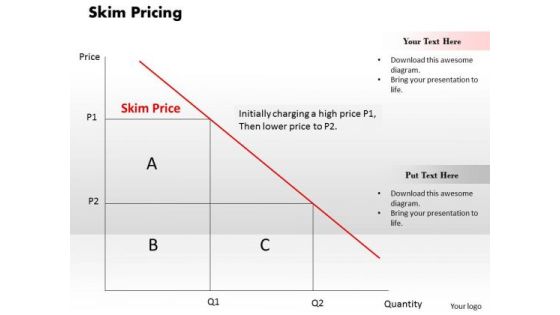
Business Framework Skim Pricing PowerPoint Presentation
This business framework power point template contains the graphic of graph. This PPT has been created with concept of skim pricing. Explain the skim pricing in your business and financial presentations by using this unique PPT.
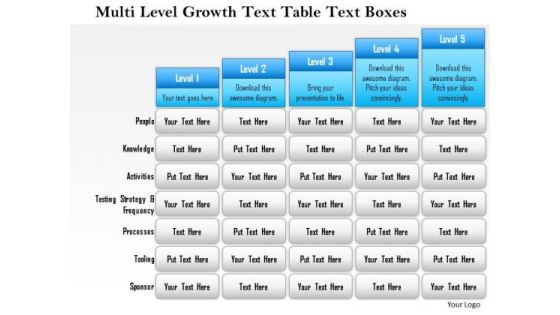
Business Framework Multi Level Growth Text Table Text Boxes 2 PowerPoint Presentation
Five staged text box style chart in bar graph design has been used to decorate this power point template slide. This diagram slide contains the multilevel growth concept. Use this PPT slide for financial growth and result analysis related topics.

Business Framework Phases Of The Credit Cycle PowerPoint Presentation
Four arrows with interconnection in circular design has been used to design this power Point template slide. This diagram slide contains the concept of credit phases. This PPT slide can be used for financial presentations.

Business Framework Poverty Index PowerPoint Presentation
A linear growth chart with text boxes has been used to decorate this Power Point template slide. This diagram slide contains the concept of poverty index. Use this index in your financial presentations to show poverty based calculation.

Business Framework Equity Valuation PowerPoint Presentation
This business framework Power Point template diagram has been crafted with graphic of three stage diagram. This PPT diagram contains the concept of equity valuation. Use this PPT diagram for your financial system related presentations.
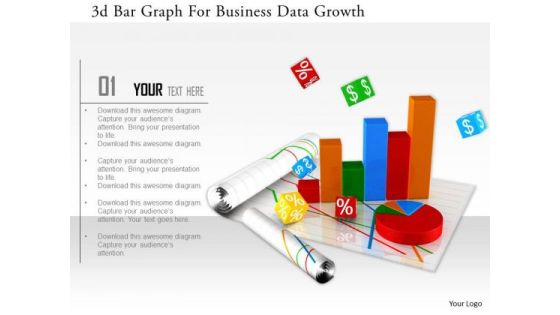
Stock Photo 3d Bar Graph For Business Data Growth Image Graphics For PowerPoint Slide
This image slide has graphics of financial charts and reports. This contains bar graph and pie chart to present business reports. Build an innovative presentations using this professional image slide.

Business Diagram Silver Capsule For Medication And Treatment Presentation Template
This business diagram displays graphics of capsule with currency symbol. It contains silver capsule with different currency signs inside it. Use this slide for health care and financial topics. Get professional with this exclusive business slide.

3d Man On The Top Of Puzzle Bar Graph
This PPT has been designed with graphic of 3d man and puzzle are graph. This PPT displays the concept of result analysis and financial growth. Use this PPT for your business and finance related presentations.
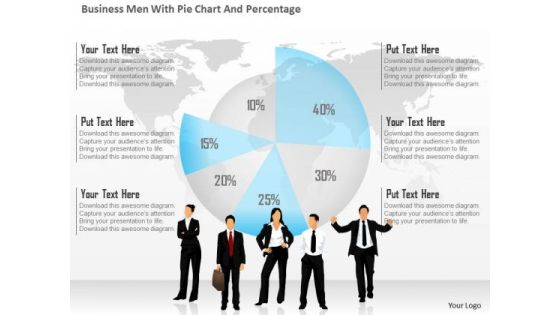
Business Diagram Business Men With Pie Chart And Percentage Presentation Template
This business diagram has been designed with graphic of business people and pie chart with percentage. This diagram is designed to depict team meeting on financial matter. This diagram offers a way for your audience to visually conceptualize the process.
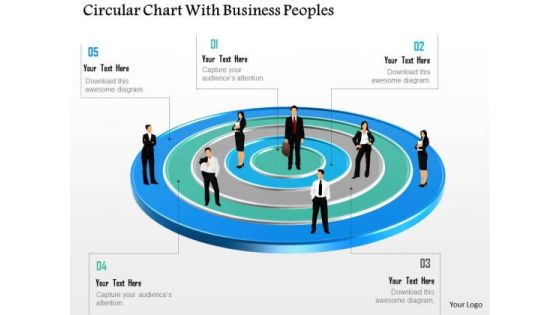
Business Diagram Circular Chart With Business Peoples Presentation Template
This business diagram has been designed with graphic of business people on circular chart. This diagram is designed to depict team meeting on financial matter. This diagram offers a way for your audience to visually conceptualize the process.
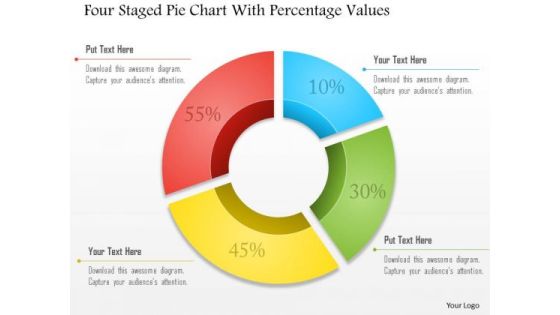
Business Diagram Four Staged Pie Chart With Percentage Values Presentation Template
Four staged pie chart and percentage values are used to design this business slide. Download this diagram to make business and financial reports. Use our above diagram to express information in a visual way.
Four Icons In Vertical Order PowerPoint Template
Concept of financial planning can be explained with this diagram. It contains graphics of four icons in vertical order. You can use this design to complement your business presentation.

Growth Graph With Design Elements PowerPoint Templates
The above template displays growth bar graph. This PowerPoint template signifies the concept of business and financial planning. Adjust the above diagram in your business presentations to visually support your content.

Dashboard Diagram For Finance And Strategic Analysis Powerpoint Slides
This PowerPoint template display graphics of clock with arrows around it and dollar symbol in center. You may use this PPT slide for financial and strategic analysis. This dashboard slide may useful for multilevel status report creation and approval process.

Four Companies With Web Services Powerpoint Slides
This PowerPoint template display graphics of four corporate buildings. You may use this PPT slide for financial and strategic analysis for web services companies. This dashboard slide may useful for multilevel status report creation and approval process.

Pie Chart Infographic Diagram Powerpoint Templates
This Power Point template has been designed with pie chart infographic. This business slide is useful to present financial ratio analysis. Use this diagram to make business presentation. Illustrate these thoughts with this slide.

Four Directional Arrows Road Infographics Powerpoint Template
Download this exclusive business diagram to present four steps of financial reporting. This slide contains the four directional arrows road infographic. This PPT diagram slide is useful for business presentations.
Four Twisted Arrows With Creative Icons Powerpoint Template
This PowerPoint template has been designed with four twisted arrows and creative icons. This business diagram helps to exhibit financial accounting systems. Use this diagram to build an exclusive presentation.
Roadmap With Year Based Timeline And Icons Powerpoint Slides
This infographic roadmap template can be used for multiple purposes including financial planning, new milestones and tasks. It contains year based timeline diagram. Download this PowerPoint timeline template to make impressive presentations.

Three Human Faces In Question Mark Shape Powerpoint Templates
Adjust the above image into your Presentations to visually support your content. This slide has been professionally designed to financial targets. This template offers an excellent background to build impressive presentation.

Infographic Of Puzzle Bag Powerpoint Templates
Adjust the above image into your presentations to visually support your content. This slide has been professionally designed with puzzle bag infographic. This template offers an excellent background to build financial target related presentation.
Pie Chart With Seven Business Icons Powerpoint Templates
Our compelling template consists with a design of pie chart with seven business icons. This slide has been professionally designed to exhibit financial ratio analysis. This template offers an excellent background to build impressive presentation.

Five Steps Of Successful Strategies For Teams Powerpoint Templates
Our above business diagram has been designed with graphics of six tags with icons. This slide is suitable to present financial management. Use this business diagram to present your work in a more smart and precise manner.
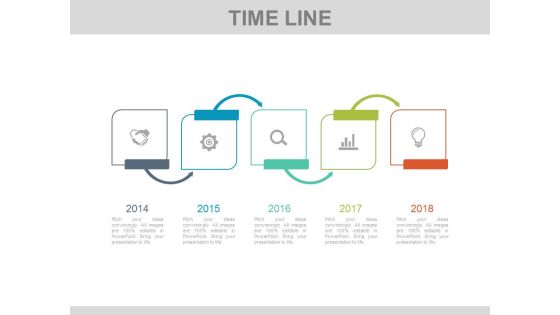
Five Steps Linear Timeline Infographic Diagram Powerpoint Slides
This infographic timeline template can be used for multiple purposes including financial planning, new milestones and tasks. It contains linear timeline infographic diagram. Download this PowerPoint timeline template to make impressive presentations.
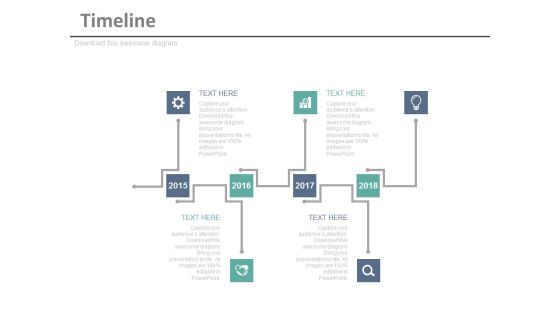
Timeline Infographic Diagram For Business Achievements Powerpoint Slides
This timeline infographic template can be used for multiple purposes including event planning, new milestones and tasks. This PPT slide may be helpful to display financial strategy timeline. Download this PowerPoint timeline template to make impressive presentations.
Four Circles With Percentage Values And Icons Powerpoint Slides
This PowerPoint template displays info graphic diagram of linear circles. This diagram may be used to exhibit financial growth and analysis. Grab center stage with this slide and capture the attention of your audience.

Arrow Steps Chart For Business Success Powerpoint Template
This PowerPoint template has been designed with graphics of arrow steps chart. Download this slide for planning of financial targets. Grab the attention of your listeners with this PPT slide.
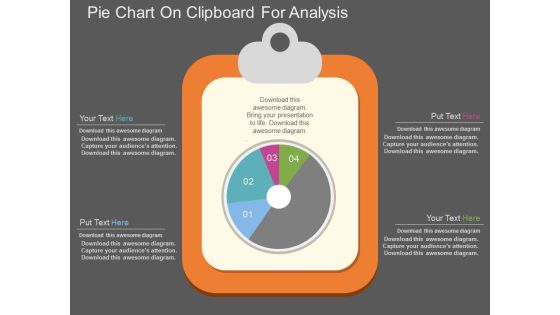
Pie Chart On Clipboard For Analysis Powerpoint Template
This PowerPoint template has been designed with graphics of pie chart on clipboard. Download this PPT slide for business and financial analysis. You may also use this professional template to depict statistical analysis.
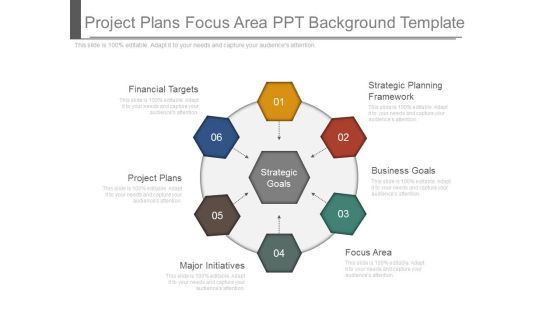
Project Plans Focus Area Ppt Background Template
This is a project plans focus area ppt background template. This is a six stage process. The stages in this process are financial targets, strategic planning framework, project plans, business goals, major initiatives, focus area.

Business Necessity Capabilities Powerpoint Slides Rules
This is a business necessity capabilities powerpoint slides rules. This is a six stage process. The stages in this process are greater financial impact, strategic support capabilities, advantage capabilities, greater strategic, essential capabilities, business necessity capabilities.
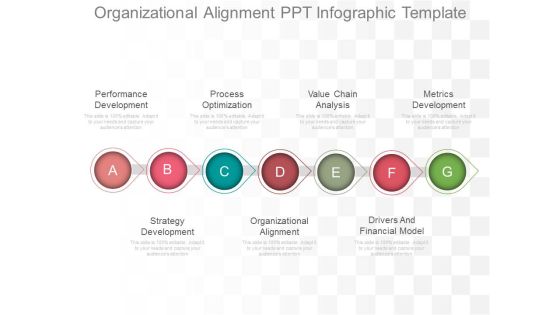
Organizational Alignment Ppt Infographic Template
This is a organizational alignment ppt infographic template. This is a seven stage process. The stages in this process are performance development, process optimization, value chain analysis, metrics development, strategy development, organizational alignment, drivers and financial model.

Lower Costs Powerpoint Show
This is a lower costs powerpoint show. This is a six stage process. The stages in this process are learning and growth perspective, lower costs, product offering, financial perspective, customer perspective, business process perspective.

Objectives Of Corporate Governance Ppt Diagrams
This is a objectives of corporate governance ppt diagrams. This is a five stage process. The stages in this process are legal and financial discipline, delivering values, accountability, transparency, stakeholder analysis.
