AI PPT Maker
Templates
PPT Bundles
Design Services
Business PPTs
Business Plan
Management
Strategy
Introduction PPT
Roadmap
Self Introduction
Timelines
Process
Marketing
Agenda
Technology
Medical
Startup Business Plan
Cyber Security
Dashboards
SWOT
Proposals
Education
Pitch Deck
Digital Marketing
KPIs
Project Management
Product Management
Artificial Intelligence
Target Market
Communication
Supply Chain
Google Slides
Research Services
 One Pagers
All Categories
-
Home
- Customer Favorites
- Capital Market
Capital Market

Identify Insights Diagram Powerpoint Slides
This is a identify insights diagram powerpoint slides. This is a five stage process. The stages in this process are identify insights, establish design criteria, brainstorm ideas, develop concept, surface key assumption.
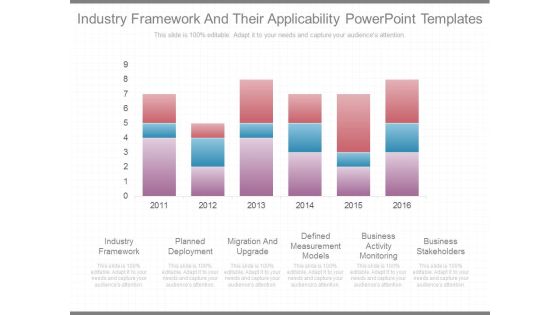
Industry Framework And Their Applicability Powerpoint Templates
This is a industry framework and their applicability powerpoint templates. This is a six stage process. The stages in this process are industry framework, planned deployment, migration and upgrade, defined measurement models, business activity monitoring, business stakeholders.

Key Metrics Presentation Powerpoint Example
This is a key metrics presentation powerpoint example. This is a two stage process. The stages in this process are residential customer churn, broadband availability.

Factors Impacting Job Satisfaction Diagram Powerpoint Guide
This is a factors impacting job satisfaction diagram powerpoint guide. This is a five stage process. The stages in this process are workplace support, earnings and benefits, job demands, individual virility, job quality.

Reporting Dashboard Ppt Presentation Powerpoint
This is a reporting dashboard ppt presentation powerpoint. This is a four stage process. The stages in this process are dashboard, visual analysis tools, scorecards, reports.
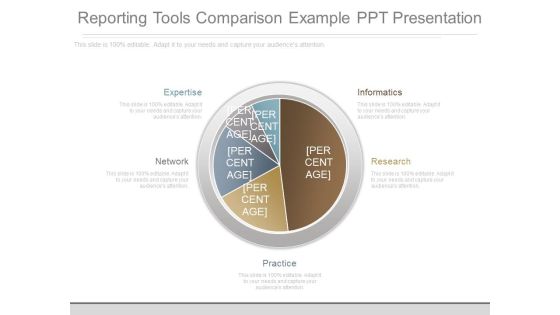
Reporting Tools Comparison Example Ppt Presentation
This is a reporting tools comparison example ppt presentation. This is a five stage process. The stages in this process are expertise, informatics, research, network, practice.
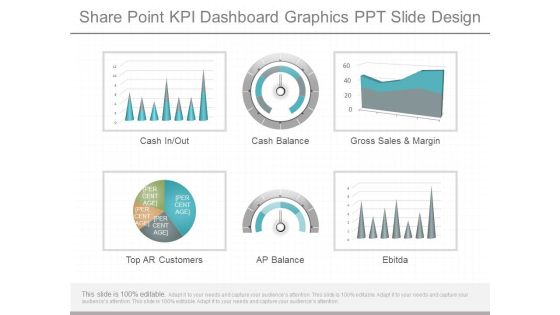
Share Point Kpi Dashboard Graphics Ppt Slide Design
This is a share point kpi dashboard graphics ppt slide design. This is a six stage process. The stages in this process are cash in out, cash balance, gross sales and margin, top ar customers, ap balance, ebitda.

Supply Chain Metrics And Kpi Examples Presentation Visuals
This is a supply chain metrics and kpi examples presentation visuals. This is a four stage process. The stages in this process are carrying cost of inventory, inventory turnover, order tracking, rate of return.
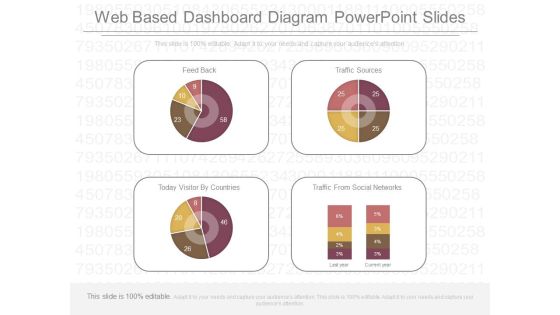
Web Based Dashboard Diagram Powerpoint Slides
This is a web based dashboard diagram powerpoint slides. This is a four stage process. The stages in this process are feed back, traffic sources, today visitor by countries, traffic from social networks.

Executive Dashboard Sample For Analysis Example
This is a executive dashboard sample for analysis example. This is a four stage process. The stages in this process are topper, step.

Executive Dashboards Solution Diagram Powerpoint Slides
This is a executive dashboards solution diagram powerpoint slides. This is a two stage process. The stages in this process are change visibility, business environment.
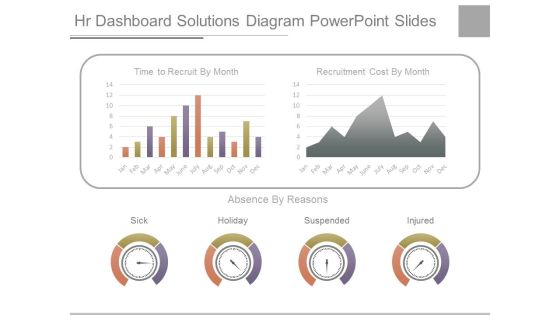
Hr Dashboard Solutions Diagram Powerpoint Slides
This is a hr dashboard solutions diagram powerpoint slides. This is a two stage process. The stages in this process are time to recruit by month, recruitment cost by month, sick, holiday, suspended, injured.
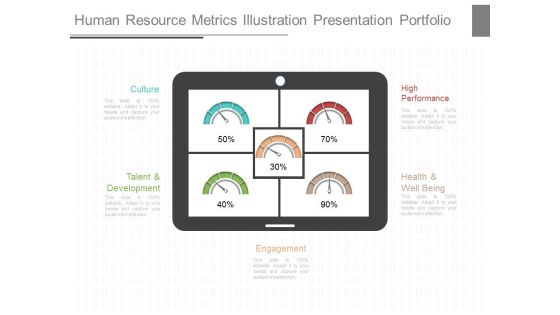
Human Resource Metrics Illustration Presentation Portfolio
This is a human resource metrics illustration presentation portfolio. This is a five stage process. The stages in this process are culture, high performance, talent and development, health and well being, engagement.

Project Kpi Sample Dashboard Diagram Powerpoint Images
This is a project kpi sample dashboard diagram powerpoint images. This is a four stage process. The stages in this process are costs thousands, employee names, burndown, project status.
Project Tracking Dashboard Template Ppt Sample
This is a project tracking dashboard template ppt sample. This is a five stage process. The stages in this process are requirements, analytics, needs, performance, analysis.

Average Days Sales Outstanding Analysis Ppt Example
This is a average days sales outstanding analysis ppt example. This is a four stage process. The stages in this process are target for week, inventory, sales vs quotes, sales vs quotes.

Bi Dashboard Gallery Diagram Powerpoint Presentation
This is a bi dashboard gallery diagram powerpoint presentation. This is a four stage process. The stages in this process are business intelligence, month.

Build Dashboard For Business Diagram Powerpoint Show
This is a build dashboard for business diagram powerpoint show. This is a four stage process. The stages in this process are average internal pv examination lead time, average entry variance, average internal audit lead time, amount contribution.

Business Company Dashboards Ppt Powerpoint Slide Show
This is a business company dashboards ppt powerpoint slide show. This is a four stage process. The stages in this process are presentation, finance, management, business, strategy, success.

Business Intelligence Dashboard Design Ppt Powerpoint Topics
This is a business intelligence dashboard design ppt powerpoint topics. This is a four stage process. The stages in this process are sales analysis, sales forecasting, global distribution, sales by region, latin america, north america, eastern europe, western europe.

Business Kpi Dashboard Diagram Powerpoint Templates
This is a business kpi dashboard diagram powerpoint templates. This is a six stage process. The stages in this process are analytics, cost per sales, reporting, kpis, dashboard, visualization.

Competitive Intelligence Dashboard Diagram Ppt Slides
This is a competitive intelligence dashboard diagram ppt slides. This is a four stage process. The stages in this process are monthly sales, inventory turns, customer complaints, company, subject area.

Cool Dashboards For Product Showcase Ppt Powerpoint Slides
This is a cool dashboards for product showcase ppt powerpoint slides. This is a three stage process. The stages in this process are product showcase, product information, products variety.

Dashboard Design And Development For Travel Diagram Background
This is a dashboard design and development for travel diagram background. This is a five stage process. The stages in this process are number of trips, sales, delayed flights, regional load, flight expense.

Dashboard Design Sample Ppt Powerpoint Slide Ideas
This is a dashboard design sample ppt powerpoint slide ideas. This is a four stage process. The stages in this process are your current setup, message board, quick stats, progress towards goals, total posts, comments, social reactions, new users, hourly visits, bounce rate.

Dashboard For Six Sigma Ppt Powerpoint Templates
This is a dashboard for six sigma ppt powerpoint templates. This is a four stage process. The stages in this process are program savings, project count, project cycle time, six sigma training.

Dashboard Program Ppt Presentation Powerpoint
This is a dashboard program ppt presentation powerpoint. This is a six stage process. The stages in this process are tasks, progress, matrix, resource, utilization, time, safety, progress, sales rate.

Dashboard Reporting Tool Diagram Powerpoint Slides
This is a dashboard reporting tool diagram powerpoint slides. This is a two stage process. The stages in this process are data visualization, mobile analytics.

Dashboard Visualization Ppt Presentation Powerpoint
This is a dashboard visualization ppt presentation powerpoint. This is a three stage process. The stages in this process are design, category.

Data Dashboard Diagram Presentation Powerpoint Example
This is a data dashboard diagram presentation powerpoint example. This is a seven stage process. The stages in this process are root cause, incident trends and their status, contributing cause, incident by category and severity, incident by category, incident by facilities, incident severity by.

Annual Pipeline Value Presentation Visual Aids
This is a annual pipeline value presentation visual aids. This is a seven stage process. The stages in this process are safety inspection score, avg cost hour, on time shipment, ndt acceptance rate, ncr customer accept, annual pipeline value, indirect man hours.

Average Profit Margin Examples Presentation Slides
This is a average profit margin examples presentation slides. This is a five stage process. The stages in this process are sales growth, sales opportunities, product performance, average profit margin, sales target.

Event Policy Planning Template Ppt Slides
This is a event policy planning template ppt slides. This is a five stage process. The stages in this process are direction, security, policy, planning, event.
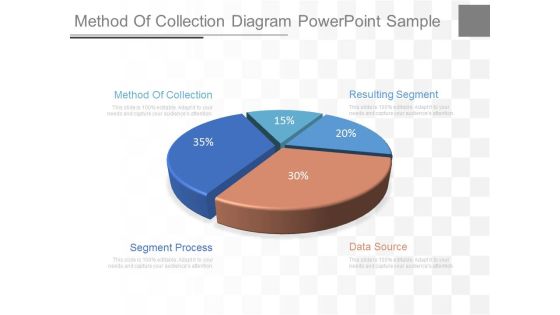
Method Of Collection Diagram Powerpoint Sample
This is a method of collection diagram powerpoint sample. This is a five stage process. The stages in this process are method of collection, segment process, data source, resulting segment.

Project Managers Executives Ppt Slides
This is a project managers executives ppt slides. This is a four stage process. The stages in this process are team members, resource managers, project managers, executives.
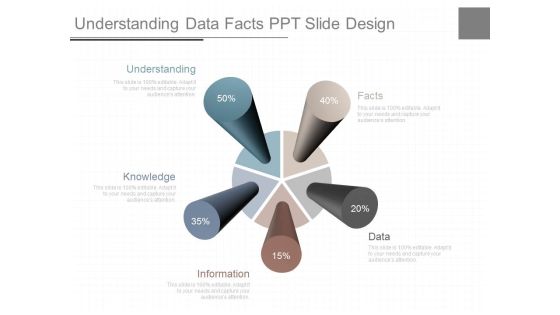
Understanding Data Facts Ppt Slide Design
This is a understanding data facts ppt slide design. This is a five stage process. The stages in this process are understanding, knowledge, information, data, facts.

Bank Dashboards Sample Ppt Templates
This is a bank dashboards sample ppt templates. This is a four stage process. The stages in this process are bank pipeline, loans pipeline, lead by source campaign, deposit pipeline, january, february, march, april.

Business Management Dashboard Ppt Example
This is a business management dashboard ppt example. This is a three stage process. The stages in this process are sales figure, regional sales breakdown, product break.

Cpi Spi Dashboard Sample Diagram Powerpoint Slide Designs
This is a cpi spi dashboard sample diagram powerpoint slide designs. This is a four stage process. The stages in this process are cpi spi, performance summary, cost schedule variance, task matrix.

Customer Service Kpi Diagram Powerpoint Slide Design
This is a customer service kpi diagram powerpoint slide design. This is a three stage process. The stages in this process are information desk, valet damage claims, gift shop sales.
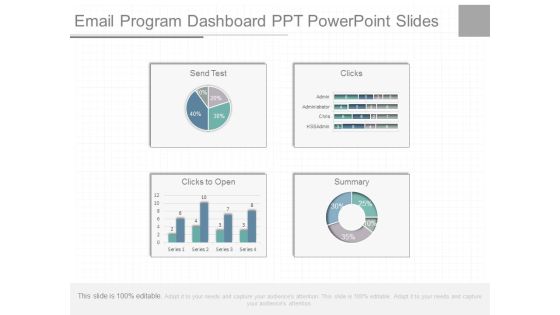
Email Program Dashboard Ppt Powerpoint Slides
This is a email program dashboard ppt powerpoint slides. This is a four stage process. The stages in this process are send test, clicks, clicks to open, summary, admin, administrator, chris, hssadmin.
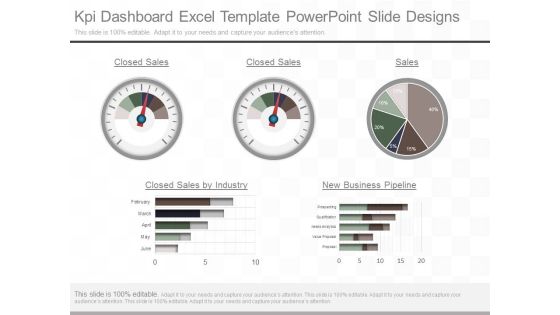
Kpi Dashboard Excel Template Powerpoint Slide Designs
This is a kpi dashboard excel template powerpoint slide designs. This is a five stage process. The stages in this process are closed sales, closed sales, sales, closed sales by industry, new business pipeline, february, march april, may, june, prospecting, qualification, needs analytics, value proposal, proposal.
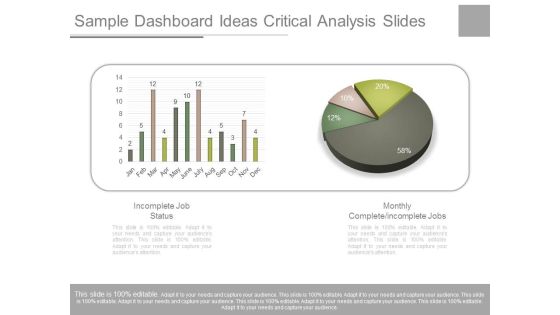
Sample Dashboard Ideas Critical Analysis Slides
This is a sample dashboard ideas critical analysis slides. This is a two stage process. The stages in this process are incomplete job status, monthly complete incomplete jobs, jan feb, mar, apr, may, june, july, aug, sep, oct, nov, dec.
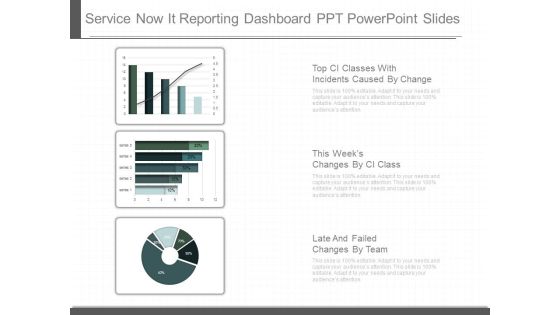
Service Now It Reporting Dashboard Ppt Powerpoint Slides
This is a service now it reporting dashboard ppt powerpoint slides. This is a three stage process. The stages in this process are top ci classes with incidents caused by change, this weeks changes by ci class, late and failed changes by team.

Web Based Dashboard Ppt Powerpoint Slides Design
This is a web based dashboard ppt powerpoint slides design. This is a four stage process. The stages in this process are feedback, traffic sources, today visitor by countries, traffic from social network.

Core Competence Of The Organization Template Ppt Sample File
This is a core competence of the organization template ppt sample file. This is a three stage process. The stages in this process are technical competencies, behavioral competences, contextual competences.

Leadership Development Process Diagram Presentation Visual Aids
This is a leadership development process diagram presentation visual aids. This is a three stage process. The stages in this process are leadership, teamwork, business.

Supporter Progress Model Ppt Diagram Powerpoint Slide
This is a supporter progress model ppt diagram powerpoint slide. This is a five stage process. The stages in this process are resource, activity, support, evaluation, design.

Automating Tasks Example Ppt Examples Professional
This is a automating tasks example ppt examples professional. This is a five stage process. The stages in this process are build targeted lists, score leads, execute campaigns, train the team, documentation.

Analytical Access Example Sample Presentation Ppt
This is a analytical access example sample presentation ppt. This is a four stage process. The stages in this process are hypothesis, collect facts, optimize, measure.
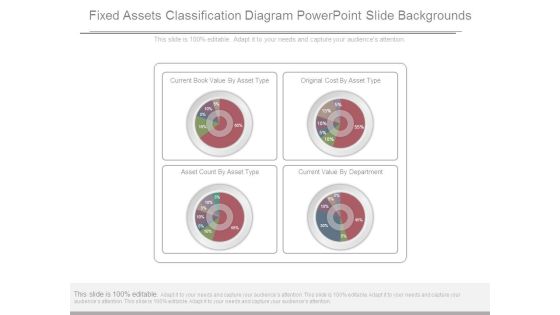
Fixed Assets Classification Diagram Powerpoint Slide Backgrounds
This is a fixed assets classification diagram powerpoint slide backgrounds. This is a four stage process. The stages in this process are current book value by asset type, original cost by asset type, asset count by asset type, current value by department.

Fundraising Tips Diagram Ppt Slide Template
This is a fundraising tips diagram ppt slide template. This is a four stage process. The stages in this process are social events, grants, vision, motivate.

Home Statistics Dashboard Ppt Presentation Background Images
This is a home statistics dashboard ppt presentation background images. This is a two stage process. The stages in this process are compare power, finance, growth.

Interactive Dashboard Examples Ppt Samples Download
This is a interactive dashboard examples ppt samples download. This is a two stage process. The stages in this process are call quality, network utilization.
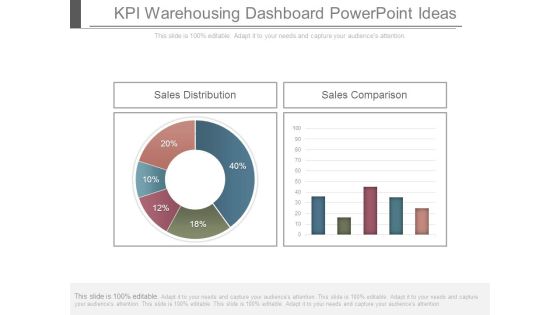
Kpi Warehousing Dashboard Powerpoint Ideas
This is a kpi warehousing dashboard powerpoint ideas. This is a two stage process. The stages in this process are sales distribution, sales comparison.

Kpis And Operations Metrics Presentation Powerpoint Example
This is a kpis and operations metrics presentation powerpoint example. This is a five stage process. The stages in this process are customer class, affiliate, sales by warehouse, warehouse, profit by affiliate.
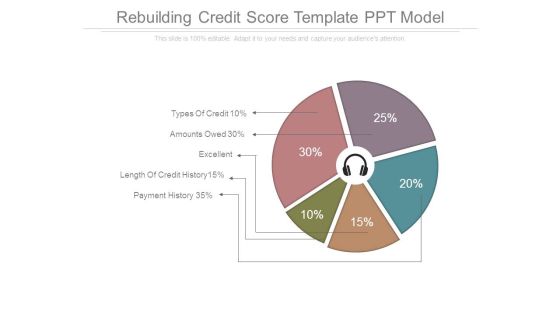
Rebuilding Credit Score Template Ppt Model
This is a rebuilding credit score template ppt model. This is a five stage process. The stages in this process are types of credit, amounts owed, excellent, length of credit history, payment history.
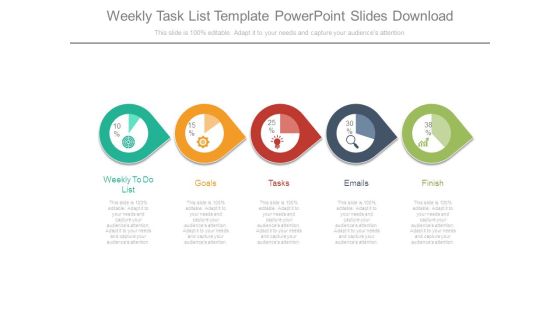
Weekly Task List Template Powerpoint Slides Download
This is a weekly task list template powerpoint slides download. This is a five stage process. The stages in this process are weekly to do list, goals, tasks, emails, finish.

Health Scorecard Table Chart Powerpoint Ideas
This is a health scorecard table chart powerpoint ideas. This is a two stage process. The stages in this process are overall score, qualitative aspects, quantitative aspects.

Demand Planning Chart Ppt Inspiration
This is a demand planning chart ppt inspiration. This is a one stage process. The stages in this process are jan, feb, mar, apr, may, jun, jul, aug, sep, oct, nov, dec.
Quality Issues And Solutions Action Plan Ppt Icon
This is a quality issues and solutions action plan ppt icon. This is a one stage process. The stages in this process are sales stage, opportunity age.
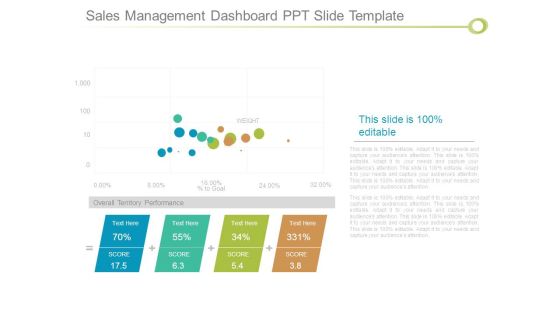
Sales Management Dashboard Ppt Slide Template
This is a sales management dashboard ppt slide template. This is a four stage process. The stages in this process are weight, goal, overall territory performance, score.
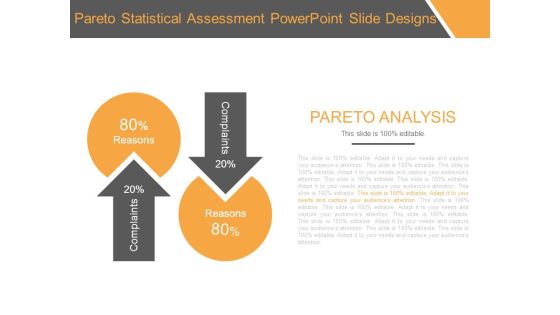
Pareto Statistical Assessment Powerpoint Slide Designs
This is a pareto statistical assessment powerpoint slide designs. This is a two stage process. The stages in this process are pareto analysis, reasons, complaints.
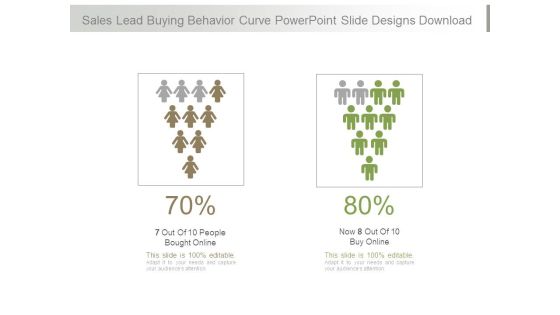
Sales Lead Buying Behavior Curve Powerpoint Slide Designs Download
This is a sales lead buying behavior curve powerpoint slide designs download. This is a two stage process. The stages in this process are 7 out of 10 people bought online, now 8 out of 10 buy online.
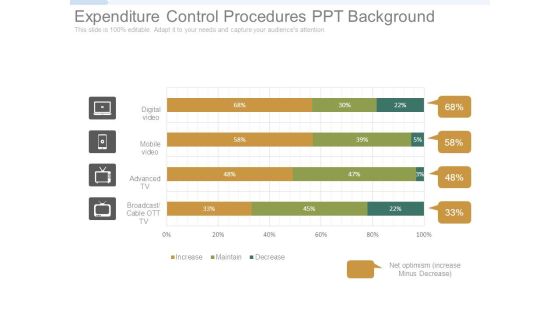
Expenditure Control Procedures Ppt Background
This is a expenditure control procedures ppt background. This is a four stage process. The stages in this process are digital video, mobile video, advanced tv, broadcast cable ott tv, increase, maintain, decrease, net optimism increase minus decrease.
Expenditure Management Powerpoint Slides Design
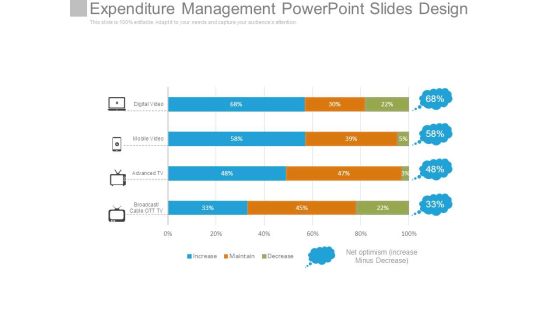
This is a expenditure management powerpoint slides design. This is a four stage process. The stages in this process are digital video, mobile video, advanced tv, broadcast cable ott tv, increase, maintain, decrease, net optimism increase minus decrease.
Expenditure Management Process Powerpoint Guide
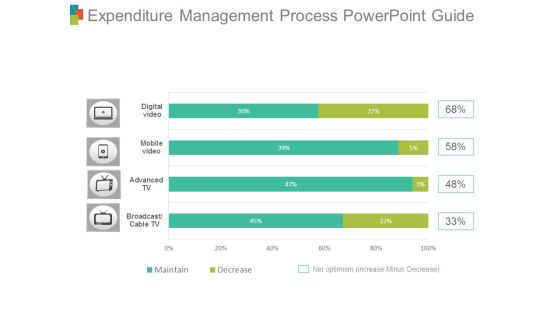
This is a expenditure management process powerpoint guide. This is a four stage process. The stages in this process are digital video, mobile video, advanced tv, broadcast cable ott tv, increase, maintain, decrease, net optimism increase minus decrease.

Optimal Portfolio Selection Process Ppt Templates
This is a optimal portfolio selection process ppt templates. This is a six stage process. The stages in this process are type of investment, stocks, bonds, real estate.

Optimization Algorithm For Portfolio Selection Ppt Slides Download
This is a optimization algorithm for portfolio selection ppt slides download. This is a four stage process. The stages in this process are grand total, alternatives, intl bonds, intl stocks, cash, alternatives.
Portfolio Decision Analysis Ppt Slide Themes
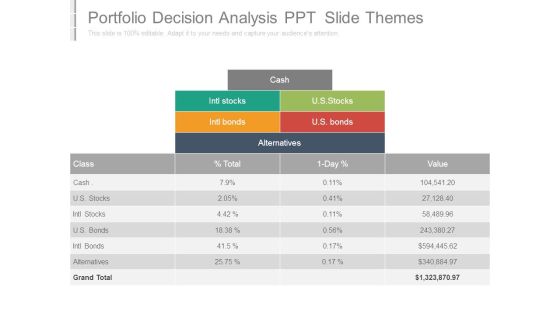
This is a portfolio decision analysis ppt slide themes. This is a four stage process. The stages in this process are cash, intl stocks, intl bonds, us stocks.
Performance Management New Trends Example Of Ppt
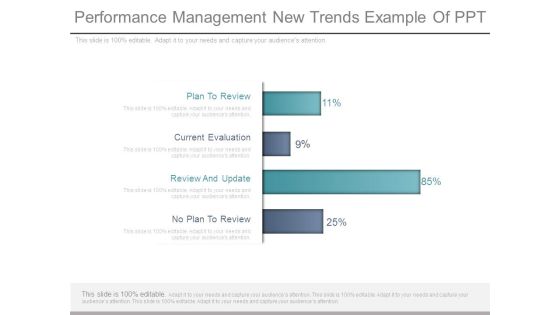
This is a performance management new trends example of ppt. This is a four stage process. The stages in this process are plan to review, current evaluation, review and update, no plan to review.
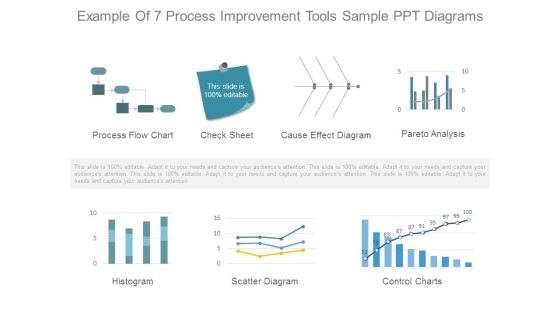
Example Of 7 Process Improvement Tools Sample Ppt Diagrams
This is a example of 7 process improvement tools sample ppt diagrams. This is a seven stage process. The stages in this process are process flow chart, check sheet, cause effect diagram, pareto analysis, histogram, scatter diagram, control charts.

Project Management Gantt Chart Ppt Powerpoint Images
This is a project management gantt chart ppt powerpoint images. This is a seven stage process. The stages in this process are requirement, setup, development, testing, deployment, training, support, project ma, review, coding, integration tests, customer tests, go live, training, support, project management.

80 20 Rule For Project Management Ppt Powerpoint Layout
This is a 80 20 rule for project management ppt powerpoint layout. This is a two stage process. The stages in this process are 80 percent results, 20 percent effort.

7 Tools For Total Quality Management Diagram Powerpoint Guide
This is a 7 tools for total quality management diagram powerpoint guide. This is a six stage process. The stages in this process are pareto chart, histogram, run chart, check sheet, fishbone, flow chart, scatter diagram.

Quality Management Tools Ppt Powerpoint Guide
This is a quality management tools ppt powerpoint guide. This is a seven stage process. The stages in this process are control chart, flow chart, cause effect diagram, pareto chart, the 7 quality tools, for process improvement, check sheet, histogram, scatter plot.

Graphical Exploratory Data Analysis Powerpoint Slides Clipart
This is a graphical exploratory data analysis powerpoint slides clipart. This is a five stage process. The stages in this process are techniques, information, predictive, focuses, business.
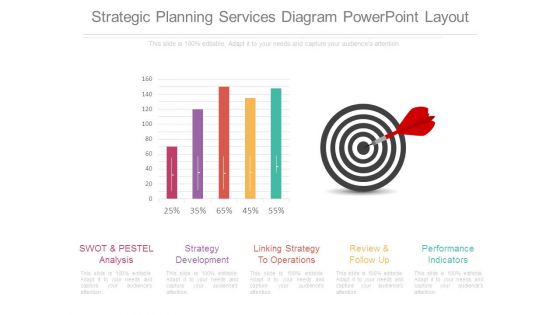
Strategic Planning Services Diagram Powerpoint Layout
This is a strategic planning services diagram powerpoint layout. This is a five stage process. The stages in this process are swot and pestel analysis, strategy development, linking strategy to operations, review and follow up, performance indicators.

Product Roadmap Product Launch Deliverables Powerpoint Slide Images
This is a product roadmap product launch deliverables powerpoint slide images. This is a five stage process. The stages in this process are business, planning, years, timeline, strategy.
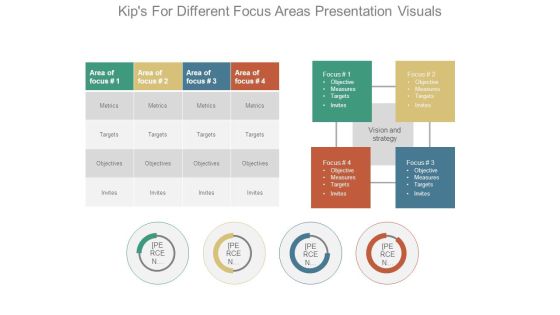
Kips For Different Focus Areas Presentation Visuals
This is a kips for different focus areas presentation visuals. This is a four stage process. The stages in this process are area of focus, metrics, targets, objectives, invites, vision and strategy, focus.

Gross Margin Improvement Bar Charts Powerpoint Slide Images
This is a gross margin improvement bar charts powerpoint slide images. This is a two stage process. The stages in this process are chart title.

Gross Margin Improvement Bar Graph Dashboard Powerpoint Slide Download
This is a gross margin improvement bar graph dashboard powerpoint slide download. This is a two stage process. The stages in this process are chart title.

Gross Margin Improvement Line Chart Powerpoint Templates
This is a gross margin improvement line chart powerpoint templates. This is a two stage process. The stages in this process are chart.
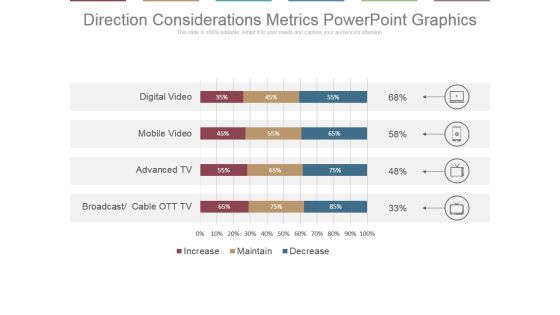
Direction Considerations Metrics Powerpoint Graphics
This is a direction considerations metrics powerpoint graphics. This is a four stage process. The stages in this process are digital video, mobile video, advanced tv, broadcast, cable ott tv.
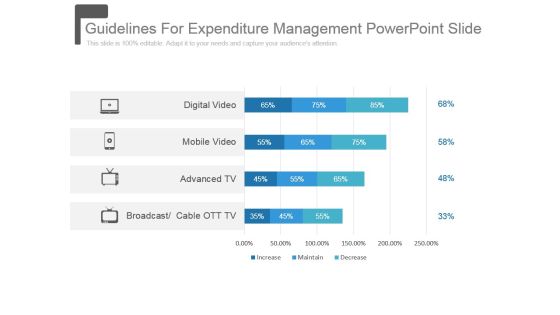
Guidelines For Expenditure Management Powerpoint Slide
This is a guidelines for expenditure management powerpoint slide. This is a four stage process. The stages in this process are digital video, mobile video, advanced tv, broadcast, cable ott tv.
Spending Directions For Media Channels Ppt Icon
This is a spending directions for media channels ppt icon. This is a four stage process. The stages in this process are digital video, mobile video, advanced tv, broadcast, cable ott tv.

Data Driven Analytics Chart Powerpoint Presentation Templates
This is a data driven analytics chart powerpoint presentation templates. This is a five stage process. The stages in this process are category.
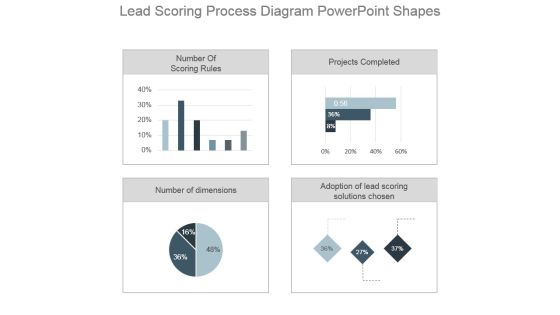
Lead Scoring Process Diagram Powerpoint Shapes
This is a lead scoring process diagram powerpoint shapes. This is a four stage process. The stages in this process are number of scoring rules, projects completed, number of dimensions, adoption of lead scoring solutions chosen.

Lead Scoring Lead Nurturing Ideas Dashboard Ppt Sample Download
This is a lead scoring lead nurturing ideas dashboard ppt sample download. This is a four stage process. The stages in this process are adoption of lead scoring solutions chosen, number of dimensions, projects completed, number of scoring rules.
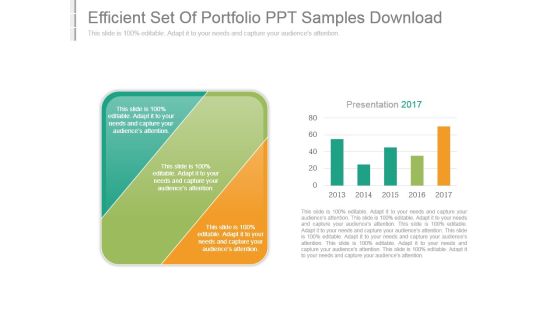
Efficient Set Of Portfolio Ppt Samples Download
This is a efficient set of portfolio ppt samples download. This is a two stage process. The stages in this process are presentation.
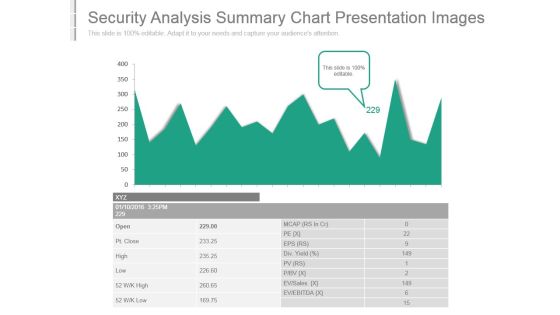
Security Analysis Summary Chart Presentation Images
This is a security analysis summary chart presentation images. This is a one stage process. The stages in this process are ev ebitda, ev sales, div yield, open, pt close, high, low, mcap, eps.

Possible Set Of Investments Ppt Background
This is a possible set of investments ppt background. This is a two stage process. The stages in this process are presentation.

Security Analysis Trends Ppt Example
This is a security analysis trends ppt example. This is a one stage process. The stages in this process are open, pt close, high, low, mcap, pe, eps, div, pv, p bv, ev sales, ev ebidta.
Group Of Investments Powerpoint Images
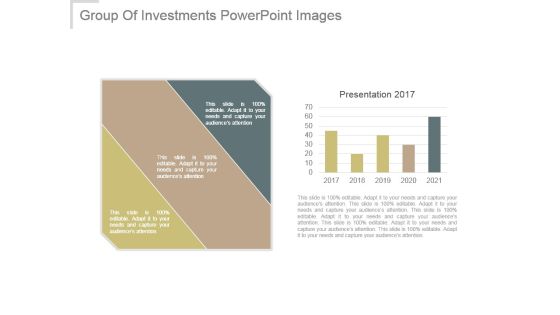
This is a group of investments powerpoint images. This is a two stage process. The stages in this process are presentation.

Security Analysis And Portfolio Management Powerpoint Slide Designs
This is a security analysis and portfolio management powerpoint slide designs. This is a one stage process. The stages in this process are xyz, open, pt close, high, low, mcap, pe, eps , div yield, pv, p bv, ev sales, ev ebitda, security analysis.
Lead Scoring And Grading Ppt Images
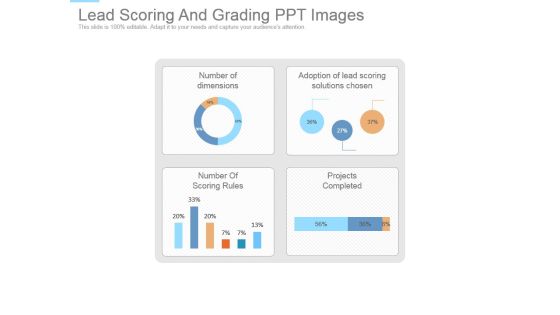
This is a lead scoring and grading ppt images. This is a four stage process. The stages in this process are number of dimensions, adoption of lead scoring solutions chosen, number of scoring rules, projects completed.

Big Data Opportunities And Challenges In Construction Ppt PowerPoint Presentation Outline
This is a big data opportunities and challenges in construction ppt powerpoint presentation outline. This is a three stage process. The stages in this process are finance, management, growth, percentage, business.

Company Cost Structure Ppt PowerPoint Presentation Influencers
This is a company cost structure ppt powerpoint presentation influencers. This is a five stage process. The stages in this process are online courses, virtual classroom, company business, one on one tutoring, e learning app.
Key Results For Search Engine Ranking Improvement Good Ppt PowerPoint Presentation Model
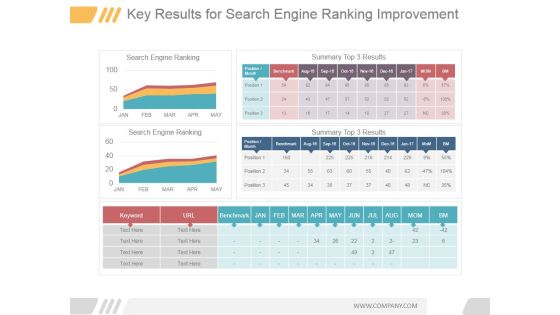
This is a key results for search engine ranking improvement good ppt powerpoint presentation model. This is a three stage process. The stages in this process are search engine ranking, summary top 3 results, jan, feb, mar, apr.
Organic Search Traffic Insights Ppt PowerPoint Presentation Files
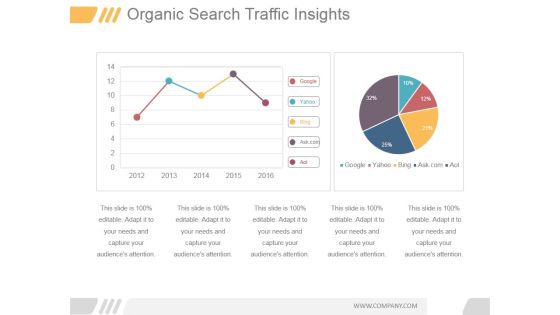
This is a organic search traffic insights ppt powerpoint presentation files. This is a five stage process. The stages in this process are google, yahoo, bing, ask com, aol.
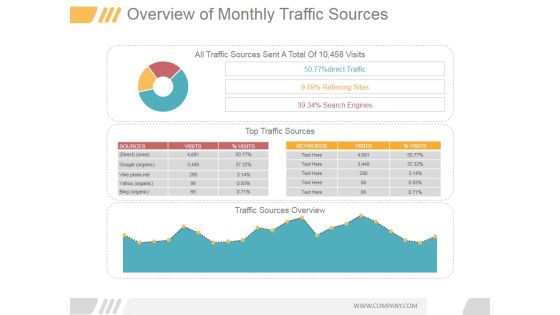
Overview Of Monthly Traffic Sources Ppt PowerPoint Presentation Visuals
This is a overview of monthly traffic sources ppt powerpoint presentation visuals. This is a three stage process. The stages in this process are all traffic sources sent a total of 10 458 visits, 50 77 percentage direct traffic, 9 89 percentage referring sites, 39 34 percentage search engines, sources, visits.
Sales Performance Tracking Ppt PowerPoint Presentation Deck
This is a sales performance tracking ppt powerpoint presentation deck. This is a four stage process. The stages in this process are top opportunities, sales goal ytd, sales funnel, company, value, company.

Web Traffic Management Ppt PowerPoint Presentation Picture
This is a web traffic management ppt powerpoint presentation picture. This is a four stage process. The stages in this process are website ranks in july, weekly, traffic reach in last 12 months share of internet users who visited the site in july 2016, jan, feb, mar, apr.

Website Performance Analytics Ppt PowerPoint Presentation Show
This is a website performance analytics ppt powerpoint presentation show. This is a three stage process. The stages in this process are conversion rate, visits, average visit value goal, return on investment ric, total visits, cost.
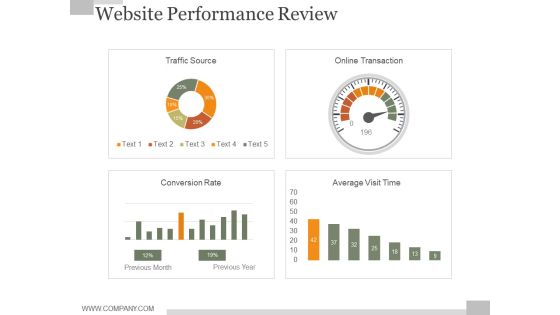
Website Performance Review Ppt PowerPoint Presentation Background Designs
This is a website performance review ppt powerpoint presentation background designs. This is a stage process. The stages in this process are conversion rate, visits.

Crm Dashboard Current Lead Status Ppt PowerPoint Presentation Influencers
This is a crm dashboard current lead status ppt powerpoint presentation influencers. This is a five stage process. The stages in this process are new, assigned, process, converted, recycle.

Funnel Ppt PowerPoint Presentation Visuals
This is a funnel ppt powerpoint presentation visuals. This is a seven stage process. The stages in this process are evaluation, relations, familiarity, awareness, planning, intent, goals.
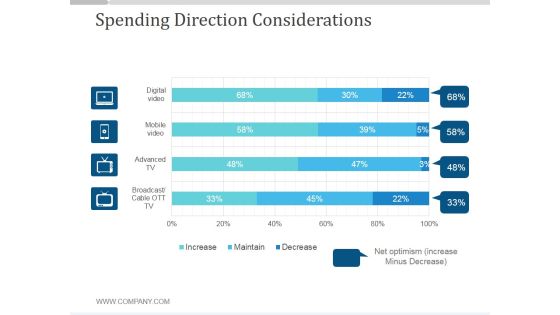
Spending Direction Considerations Ppt PowerPoint Presentation Sample
This is a spending direction considerations ppt powerpoint presentation sample. This is a four stage process. The stages in this process are business, increase, maintain, decrease, finance.

Core Strategic Audience Ppt PowerPoint Presentation Inspiration
This is a core strategic audience ppt powerpoint presentation inspiration. This is a seven stage process. The stages in this process are percentage, finance, management, business.

Team Target And Achievements Slide Ppt PowerPoint Presentation Themes
This is a team target and achievements slide ppt powerpoint presentation themes. This is a six stage process. The stages in this process are jan, feb ,mar, apr, may, jun.

Geographic Segmentation Ppt PowerPoint Presentation Good
This is a geographic segmentation ppt powerpoint presentation good. This is a five stage process. The stages in this process are climate, counties, counties, region, city, density.

Milestones For The Next Reporting Period Ppt PowerPoint Presentation Files
This is a milestones for the next reporting period ppt powerpoint presentation files. This is a seven stage process. The stages in this process are jan, feb, mar, apr, may, jun.

Target Modelling Ppt PowerPoint Presentation Layout
This is a target modelling ppt powerpoint presentation layout. This is a six stage process. The stages in this process are goal, conservative growth, moderate growth, moderate aggressive, growth, aggressive growth, more diversification, concentrated growth, concentrated, aggressive growth.

Demand Forecasting Ppt PowerPoint Presentation Guidelines
This is a demand forecasting ppt powerpoint presentation guidelines. This is a one stage process. The stages in this process are dynamic demand, trend, stable demand, demand quantity.
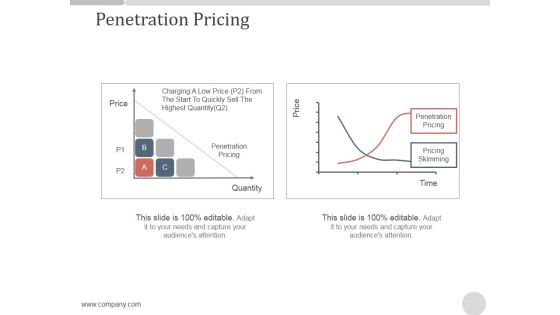
Penetration Pricing Ppt PowerPoint Presentation Background Designs
This is a penetration pricing ppt powerpoint presentation background designs. This is a two stage process. The stages in this process are penetration pricing, pricing skimming, time, quantity, penetration pricing.

Measurement Of Portfolio Analysis Ppt PowerPoint Presentation Clipart
This is a measurement of portfolio analysis ppt powerpoint presentation clipart. This is a two stage process. The stages in this process are your current portfolio, holding, current weight, current value, data analysis.

Portfolio Evaluation Ppt PowerPoint Presentation Topics
This is a portfolio evaluation ppt powerpoint presentation topics. This is a five stage process. The stages in this process are govt debt securities, foreign govt debt securities, corporate debt securities, corporate debt securities, equity.
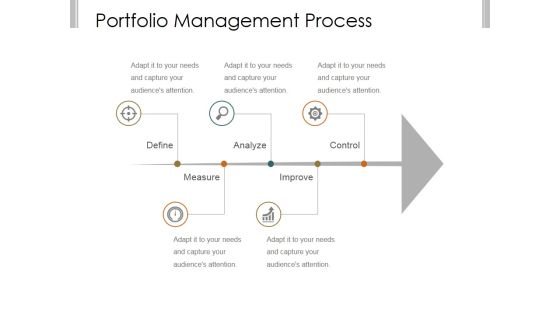
Portfolio Management Process Ppt PowerPoint Presentation Backgrounds
This is a portfolio management process ppt powerpoint presentation backgrounds. This is a five stage process. The stages in this process are define, analyze, control, improve, measure.
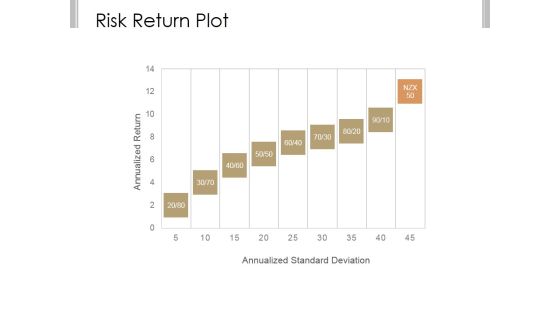
Risk Return Plot Ppt PowerPoint Presentation Styles
This is a risk return plot ppt powerpoint presentation styles. This is a nine stage process. The stages in this process are annualized return, annualized standard deviation.

Right Tools For Disaster Management Job Ppt PowerPoint Presentation Infographic Template
This is a right tools for disaster management job ppt powerpoint presentation infographic template. This is a three stage process. The stages in this process are bachelors degree, masters degree, some college, no degree.
