AI PPT Maker
Templates
PPT Bundles
Design Services
Business PPTs
Business Plan
Management
Strategy
Introduction PPT
Roadmap
Self Introduction
Timelines
Process
Marketing
Agenda
Technology
Medical
Startup Business Plan
Cyber Security
Dashboards
SWOT
Proposals
Education
Pitch Deck
Digital Marketing
KPIs
Project Management
Product Management
Artificial Intelligence
Target Market
Communication
Supply Chain
Google Slides
Research Services
 One Pagers
All Categories
-
Home
- Customer Favorites
- Capital Market
Capital Market
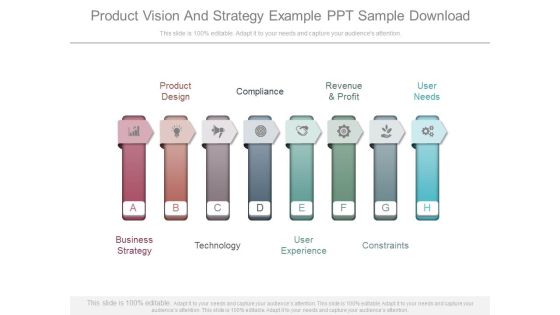
Product Vision And Strategy Example Ppt Sample Download
This is a product vision and strategy example ppt sample download. This is a eight stage process. The stages in this process are product design, compliance, revenue and profit, user needs, constraints, user experience, technology, business strategy.

Extreme Customer Engagement Ppt Powerpoint Show
This is a extreme customer engagement ppt powerpoint show. This is a four stage process. The stages in this process are extreme engagement, new customer, generate revenue, reduce inbound, loyalty.
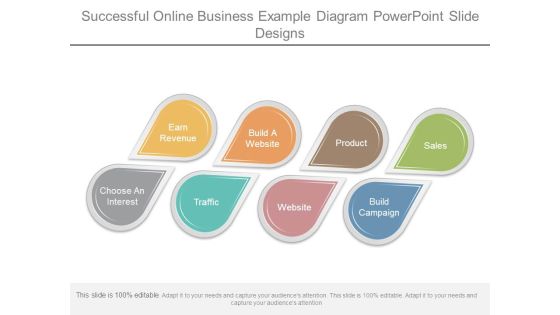
Successful Online Business Example Diagram Powerpoint Slide Designs
This is a successful online business example diagram powerpoint slide designs. This is a eight stage process. The stages in this process are earn revenue, build a website, product, sales, choose an interest, traffic, website, build campaign.
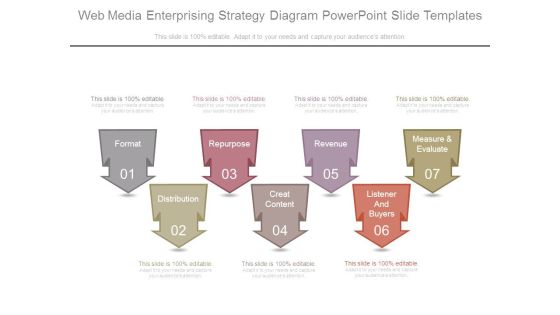
Web Media Enterprising Strategy Diagram Powerpoint Slide Templates
This is a web media enterprising strategy diagram powerpoint slide templates. This is a seven stage process. The stages in this process are format, repurpose, revenue, measure and evaluate, listener and buyers, creat content, distribution.

Corporate Strategic Objectives Framework Ppt Slides Template
This is a corporate strategic objectives framework ppt slides template. This is a three stage process. The stages in this process are supply chain strategies, restore customer service leading level, improve revenue, corporate strategic objectives framework.

Customer Interaction Analysis Diagram Powerpoint Slide Inspiration
This is a customer interaction analysis diagram powerpoint slide inspiration. This is a four stage process. The stages in this process are referral, paid search, revenue enhancement, real time performance measurement.

Prospect Need Assessment Example Ppt Slide
This is a prospect need assessment example ppt slide. This is a eight stage process. The stages in this process are analysis, preferences, habit, income, needs, change in profits, change in costs, change in revenues, change in quantity.
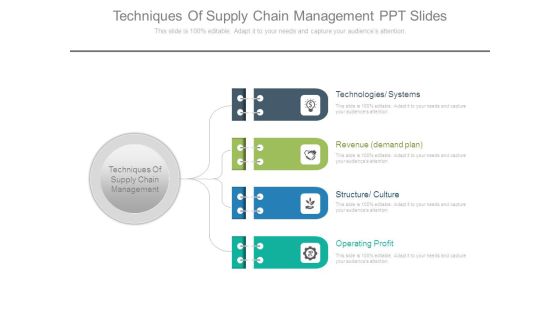
Techniques Of Supply Chain Management Ppt Slides
This is a techniques of supply chain management ppt slides. This is a four stage process. The stages in this process are techniques of supply chain management, technologies systems, revenue demand plan, structure culture, operating profit.

Clear Conversion Goal Example Diagram Ppt Examples Professional
This is a clear conversion goal example diagram ppt examples professional. This is a five stage process. The stages in this process are result and analysis, conversion rate, repeat, unique users, revenue.

Progress Action Strategy Diagram Powerpoint Slide Graphics
This is a progress action strategy diagram powerpoint slide graphics. This is a six stage process. The stages in this process are lower inventory costs, self assessment, formative assessment evaluation, find alternative revenue streams, summative evaluation, implementing of the plan.

Price Elasticity Measurement Example Powerpoint Images
This is a price elasticity measurement example powerpoint images. This is a four stage process. The stages in this process are change in price, change in quantity, change in revenues, optimal price.

Research Customer Satisfaction Template Powerpoint Slide Download
This is a research customer satisfaction template powerpoint slide download. This is a four stage process. The stages in this process are timely delivery, increase customer loyalty, reasonable price, secure future revenues.

Business Model Canvas Chart Ppt Images
This is a business model canvas chart ppt images. This is a five stage process. The stages in this process are key partners, key activities, value propositions, customer relationships, customer segments, key resources, channels, cost structure, revenue streams.

Business Model Rules Table Powerpoint Slide Rules
This is a business model rules table powerpoint slide rules. This is a five stage process. The stages in this process are key partners, key activities, value propositions, customer relationships, customer segments, key resources, channels, cost structure, revenue streams.
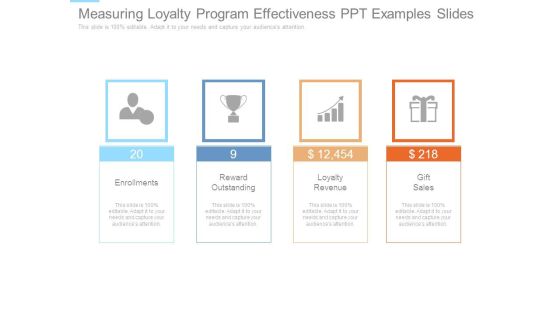
Measuring Loyalty Program Effectiveness Ppt Examples Slides
This is a measuring loyalty program effectiveness ppt examples slides. This is a four stage process. The stages in this process are enrollments, reward outstanding, loyalty revenue, gift sales.

Business Model Segmentation Powerpoint Slides
This is a business model segmentation powerpoint slides. This is a nine stage process. The stages in this process are key partners, key resources, key activities, value, propositions, customer, relationships, customer segments, cost structure, revenue streams.

Business Model Canvas For Process Analysis Powerpoint Images
This is a business model canvas for process analysis powerpoint images. This is a seven stage process. The stages in this process are key partners, key activities, value, propositions, customer relationships, customer segments, key resources, channels, cost structure, revenue streams.

New Business Model Chart Presentation Powerpoint Example
This is a new business model chart presentation powerpoint example. This is a five stage process. The stages in this process are key partners, key activities, value propositions, customer, relationships, customer segments, key resources, channels, cost structure, revenue streams.

Table Of Contents Ppt PowerPoint Presentation Background Image
This is a table of contents ppt powerpoint presentation background image. This is a three stage process. The stages in this process are our team, the problem, business model, revenue streams.
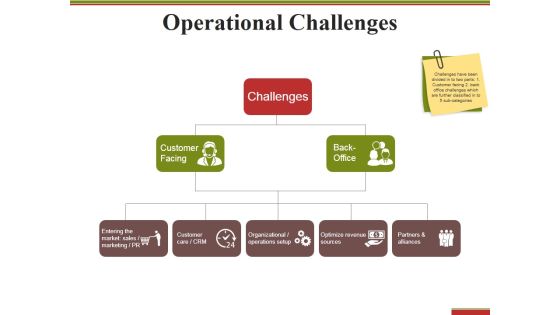
Operational Challenges Ppt PowerPoint Presentation Infographics Slideshow
This is a operational challenges ppt powerpoint presentation infographics slideshow. This is a three stage process. The stages in this process are challenges, customer facing, optimize revenue sources, back office.
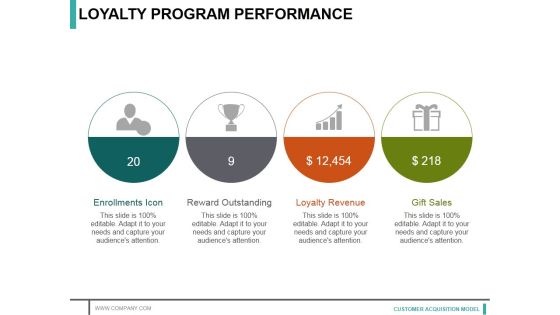
Loyalty Program Performance Ppt PowerPoint Presentation Styles Example
This is a loyalty program performance ppt powerpoint presentation styles example. This is a four stage process. The stages in this process are enrollments icon, reward outstanding, loyalty revenue, gift sales.

Consequences Of Poor Quality Ppt PowerPoint Presentation Show Grid
This is a consequences of poor quality ppt powerpoint presentation show grid. This is a six stage process. The stages in this process are lost revenue, lost customers, increased costs, lost productivity, lower profits.

Table Of Contents Ppt PowerPoint Presentation Summary Slide Portrait
This is a table of contents ppt powerpoint presentation summary slide portrait. This is a three stage process. The stages in this process are the problem, our team, the solution, business model, revenue streams.
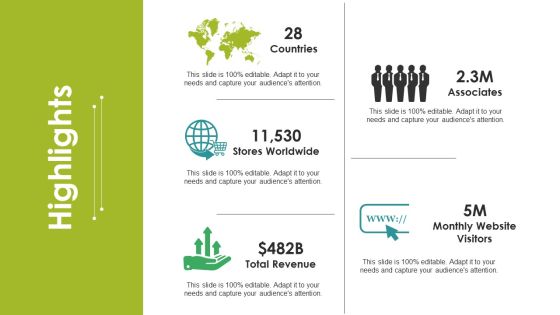
Highlights Ppt PowerPoint Presentation Infographic Template Outline
This is a highlights ppt powerpoint presentation infographic template outline. This is a five stage process. The stages in this process are stores worldwide, countries, total revenue, associates, monthly website visitors.

Sales Performance Ppt PowerPoint Presentation Pictures Format Ideas
This is a sales performance ppt powerpoint presentation pictures format ideas. This is a six stage process. The stages in this process are quarterly sales review, sales by region, sales performance dashboard, sales revenue by product.
Sales Performance Ppt PowerPoint Presentation Visual Aids Icon
This is a sales performance ppt powerpoint presentation visual aids icon. This is a six stage process. The stages in this process are quarterly sales review, sales performance dashboard, sales by region, sales revenue by product.

Setting The M And A Criteria Ppt PowerPoint Presentation Portfolio Shapes
This is a setting the m and a criteria ppt powerpoint presentation portfolio shapes. This is a six stage process. The stages in this process are deal size, industry, country, target company revenue, new analytical tool.

Business Model Innovation Segments Ppt PowerPoint Presentation Professional Example Topics
This is a business model innovation segments ppt powerpoint presentation professional example topics. This is a three stage process. The stages in this process are revenue model innovation, customer model innovation, organizational model innovation.
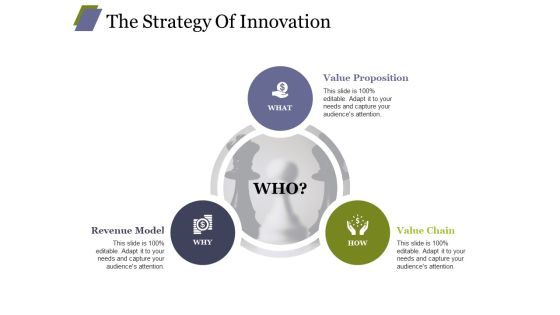
The Strategy Of Innovation Ppt PowerPoint Presentation Model Templates
This is a the strategy of innovation ppt powerpoint presentation model templates. This is a three stage process. The stages in this process are value proposition, value chain, revenue model.

Business Model Innovation Segments Ppt PowerPoint Presentation Summary Introduction
This is a business model innovation segments ppt powerpoint presentation summary introduction. This is a three stage process. The stages in this process are customer model innovation, business model innovation, revenue model innovation.

Customer Success Vs Customer Service Ppt PowerPoint Presentation Portfolio Professional
This is a customer success vs customer service ppt powerpoint presentation portfolio professional. This is a six stage process. The stages in this process are reactive, proactive, cost centre, revenue generating, customer service, customer success.

Corporate Finance Management Diagram Powerpoint Presentation
This is a corporate finance management diagram powerpoint presentation. This is a eight stage process. The stages in this process are corporate finance management system, general ledger, payroll, accounts payable, financial analytics, accounts receivable, asset lifecycle management, financial planning, governance risk compliance.
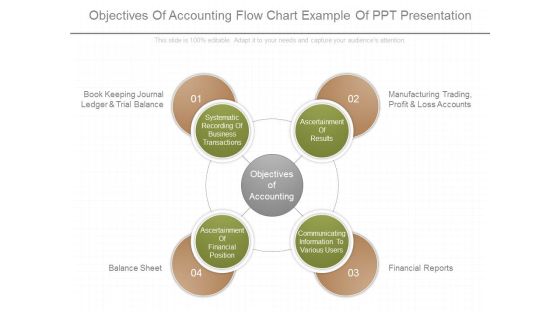
Objectives Of Accounting Flow Chart Example Of Ppt Presentation
This is a objectives of accounting flow chart example of ppt presentation. This is a four stage process. The stages in this process are book keeping journal ledger and trial balance, manufacturing trading profit and loss accounts, balance sheet, financial reports, systematic recording of business transactions, ascertainment of results, ascertainment of financial position, communicating information to various users, objectives of accounting.

Business Case Development Tools Presentation Images
This is a business case development tools presentation images. This is a nine stage process. The stages in this process are user guide, business profile, it spending tco, initiative costs, initiative benefits, financial analysis, non financial kpls optional, business case reports, initiative descriptions reference only.
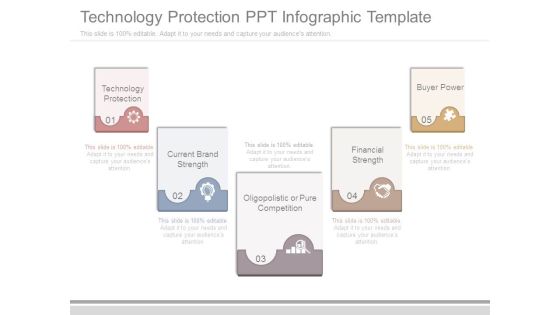
Technology Protection Ppt Infographic Template
This is a technology protection ppt infographic template. This is a five stage process. The stages in this process are technology protection, current brand strength, oligopolistic or pure competition, financial strength, buyer power.
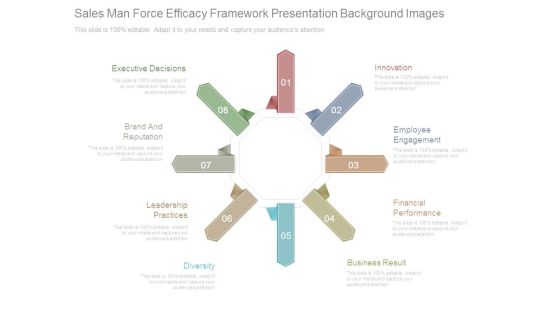
Sales Man Force Efficacy Framework Presentation Background Images
This is a sales man force efficacy framework presentation background images. This is a eight stage process. The stages in this process are innovation, employee engagement, financial performance, business result, diversity, leadership practices, brand and reputation, executive decisions.

Stock Photo Graphics For Business Reports And Charts PowerPoint Slide
This image contains graphics of business reports and charts. Download this image for business and sales presentations where you have to focus on financial growth. Dazzle the audience with your thoughts.
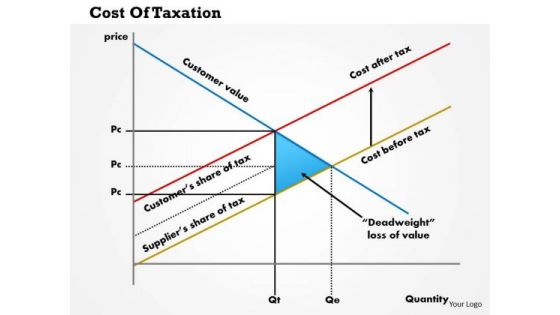
Business Framework Cost Of Taxation PowerPoint Presentation
This innovative image slide has been designed to display coat of taxation graph. This business framework template may be used to display financial ratios of taxation in your presentations. This image slide will impart professional appearance to your presentations.

Business Framework Marshall Lerner Condition Ju Curve PowerPoint Presentation
Explain the Marshall Lerner condition and J-curve with suitable graphics. This business framework has been crafted with j-curve graphics. Use this PPT in your financial presentation to explain the depreciation and devaluation of currency for any country.
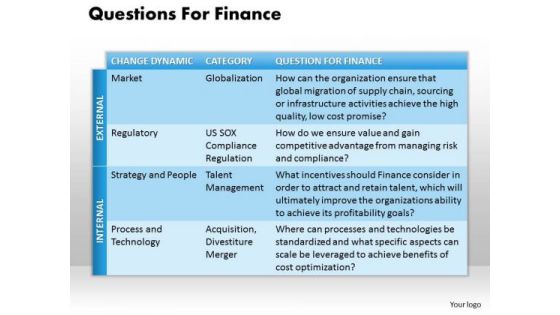
Business Framework Questions For Finance PowerPoint Presentation
This diagram depicts concepts of financial planning. Download this business diagram for your business and finance planning projects. This pre designed high quality business diagram will make your presentation simply the best.
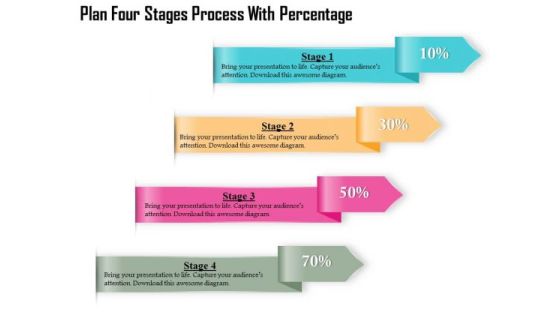
Business Diagram Four Stages Process With Percentage Presentation Template
Four multicolored tags in vertical order has been used to decorate this business diagram. This diagram contains the concept of financial data display with percent values. This diagram can be used for management and finance related presentations.

Business Diagram Three Stages Process Percentage Presentation Template
Three multicolored tags in vertical order has been used to decorate this business diagram. This diagram contains the concept of financial data display with percent values. This diagram can be used for management and finance related presentations.
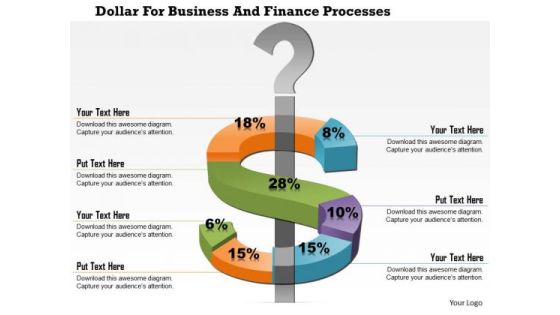
Business Diagram Dollar For Business And Finance Processes Presentation Template
This business diagram displays dollar symbol around a question mark. This diagram depicts change in dollar currency value. Use this slide to make financial and business reports and presentations.
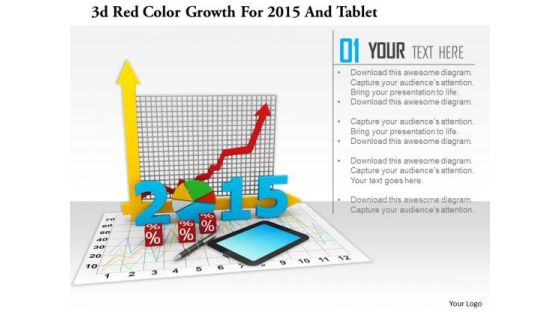
Stock Photo 3d Red Color Growth For 2015 And Tablet PowerPoint Slide
This image slide has graphics of financial charts and reports. This contains bar graph and pie chart to present business reports. Build an innovative presentation using this professional image slide.

Business Diagram Eight Staged Circular Puzzle Bar Graph Presentation Template
This Power Point template has been crafted with graphic of eight staged circular puzzle and bar graph. This PPT contains the financial result analysis related concept. Use this PPT for your business and success related presentations.
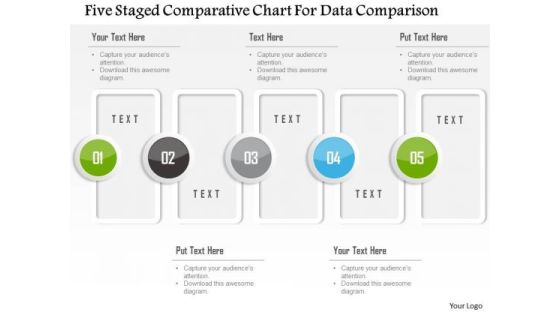
Business Diagram Five Staged Comparative Chart For Data Comparison Presentation Template
Five staged comparative chart has been used to design this power point template. This PPT contains the concept of data comparison. Use this PPT for your business and finance based data comparison in any financial presentation.

Stock Photo Dollars Covered With Lock And Chain PowerPoint Slide
This Power Point image template has been designed with graphic of dollar and chain. In this image dollar is covered with chain which shows the concept of safety. Use this image template financial security related presentations.
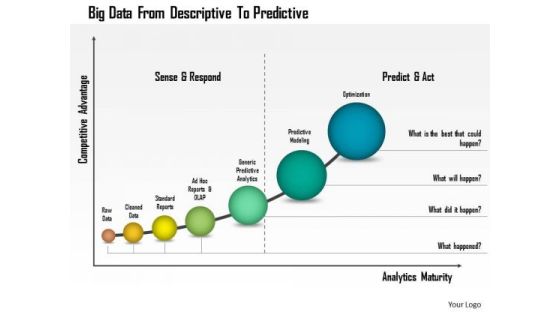
Business Diagram Big Data From Descriptive To Predictive Presentation Template
This business diagram has been designed with graphic of linear bar graph. This growing bar graph depicts the concept of big data analysis. Use this professional diagram for your financial and business analysis.
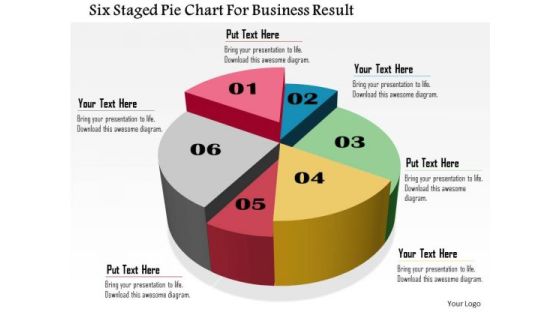
Business Daigram Six Staged Pie Chart For Business Result Presentation Templets
Six staged pie chart is used to design this business slide. Download this diagram to make business and financial reports. Use our above diagram to express information in a visual way.

People Thoughts For Business Planning PowerPoint Templates
This creative slide has been designed with graphics of team icons. Use this unique slide in presentations related to business and financial planning. This template adds value to your idea.

Illustration Of Dollar Growth Graph PowerPoint Template
This business slide contains graphics of dollar symbols on graph. This diagram helps to portray concept of financial planning. Present your views using this innovative slide and be assured of leaving a lasting impression.
Five Pointers With Science And Education Icons Powerpoint Template
Our professionally designed business diagram is as an effective tool for communicating concept of science and education. It contains five pointers infographic diagram. Above slide is also suitable to display financial planning and strategy.
Seven Staged Business Cubes And Icons Powerpoint Template
This PowerPoint template has been designed with graphics of seven cubes and business icons. Download this PPT slide for business and financial analysis. You may also use this professional template to depict statistical analysis.

Leading And Lagging Indicators Diagram Example Of Ppt
This is a leading and lagging indicators diagram example of ppt. This is a two stage process. The stages in this process are legging indicator, management ability, employee engagement, leading indicator, process improvement, financial performance, customer loyalty.

Customer Relationship Management Ppt Images
This is a customer relationship management ppt images. This is a four stage process. The stages in this process are customer relationship management, enterprise resource planning, business process redesign, financial management.
Partnerships And Joint Ventures Ppt Images Gallery
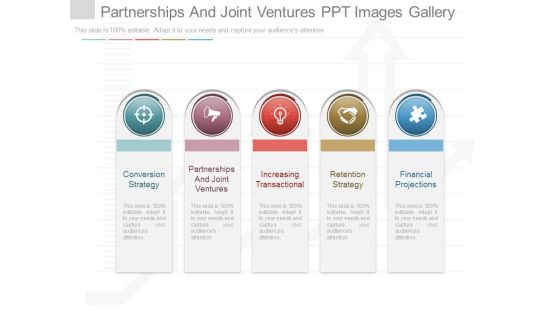
This is a partnerships and joint ventures ppt images gallery. This is a five stage process. The stages in this process are conversion strategy, partnerships and joint ventures, increasing transactional, retention strategy, financial projections.

Erp Systems Implementation Ppt Ideas
This is a erp systems implementation ppt ideas. This is a five stage process. The stages in this process are crm, financial management, supply chain management, resource planning, hrm, erp systems implementation.\n\n\n \n
Service Oriented Architecture Presentation Ideas
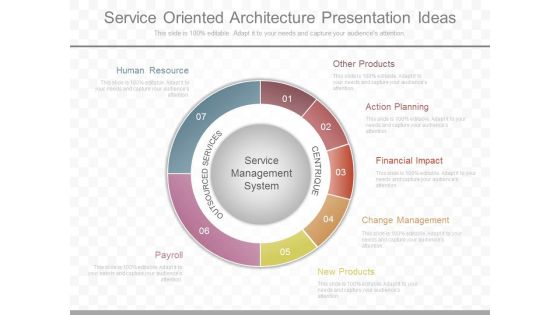
This is a service oriented architecture presentation ideas. This is a seven stage process. The stages in this process are service management system, outsourced services, centrique, other products, action planning, financial impact, change management, new products, payroll, human resource.

Customer Relationship Management Diagram Ppt Sample
This is a customer relationship management diagram ppt sample. This is a four stage process. The stages in this process are business process redesign, customer relationship management, financial management, enterprises resources planning.

Basic Accounting And Bookkeeping Chart Ppt Slides
This is a basic accounting and bookkeeping chart ppt slides. This is a five stage process. The stages in this process are financial statements, source documents, accounting cycle, journals, ledger, trial balance.
