AI PPT Maker
Templates
PPT Bundles
Design Services
Business PPTs
Business Plan
Management
Strategy
Introduction PPT
Roadmap
Self Introduction
Timelines
Process
Marketing
Agenda
Technology
Medical
Startup Business Plan
Cyber Security
Dashboards
SWOT
Proposals
Education
Pitch Deck
Digital Marketing
KPIs
Project Management
Product Management
Artificial Intelligence
Target Market
Communication
Supply Chain
Google Slides
Research Services
 One Pagers
All Categories
-
Home
- Customer Favorites
- Capital Investment
Capital Investment

Business Model Template 2 Ppt PowerPoint Presentation Good
This is a business model template 2 ppt powerpoint presentation good. This is a three stage process. The stages in this process are business, marketing, management, finance, analysis.
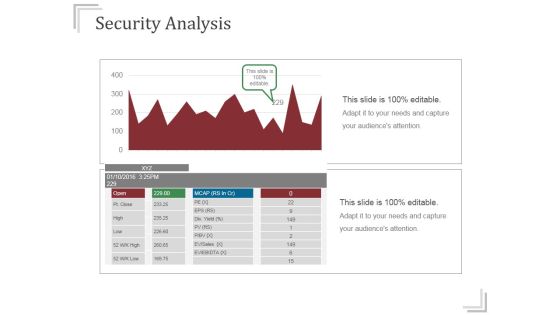
Security Analysis Ppt PowerPoint Presentation Infographics
This is a security analysis ppt powerpoint presentation infographics. This is a two stage process. The stages in this process are business, finance, growth, analysis, success.
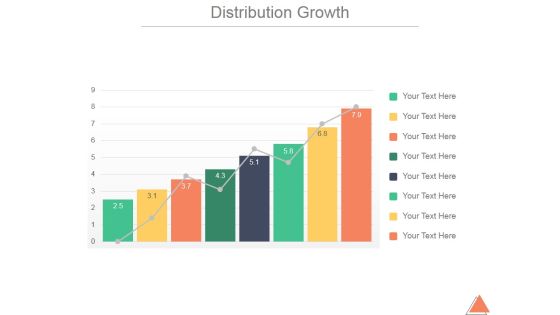
Distribution Growth Ppt PowerPoint Presentation Slide Download
This is a distribution growth ppt powerpoint presentation slide download. This is a nine stage process. The stages in this process are business, marketing, management, growth, finance.
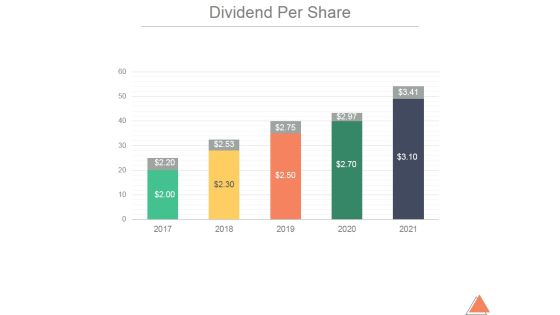
Dividend Per Share Ppt PowerPoint Presentation Pictures
This is a dividend per share ppt powerpoint presentation pictures. This is a five stage process. The stages in this process are business, marketing, management, growth, finance.
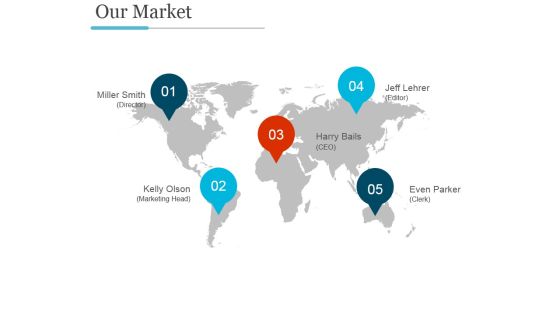
Our Market Template Ppt PowerPoint Presentation Design Templates
This is a our market template ppt powerpoint presentation design templates. This is a four stage process. The stages in this process are pie, percentage, finance, division, analysis.

Pie Chart Ppt PowerPoint Presentation Portfolio Maker
This is a pie chart ppt powerpoint presentation portfolio maker. This is a five stage process. The stages in this process are business, pie chart, finance, process, planning.
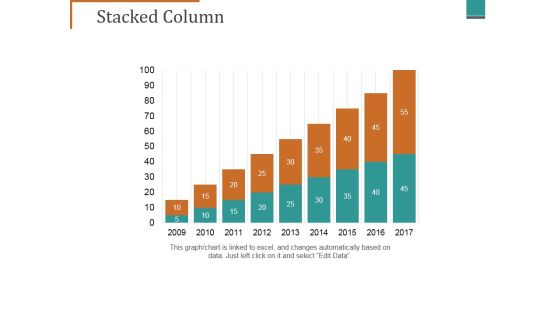
Stacked Column Ppt PowerPoint Presentation Pictures Graphics Design
This is a stacked column ppt powerpoint presentation pictures graphics design. This is a nine stage process. The stages in this process are business, finance, growth, analysis, marketing.

Bar Graph Ppt PowerPoint Presentation File Graphic Images
This is a bar graph ppt powerpoint presentation file graphic images. This is a three stage process. The stages in this process are business, marketing, chart, finance, product.
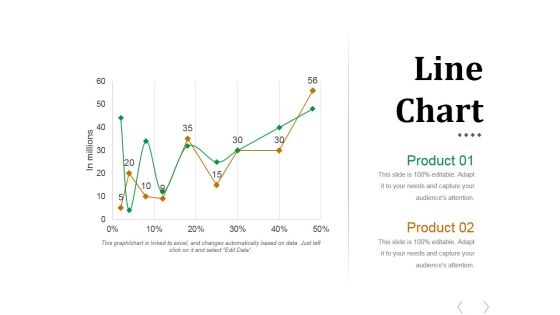
Line Chart Ppt PowerPoint Presentation Styles Outfit
This is a line chart ppt powerpoint presentation styles outfit. This is a two stage process. The stages in this process are business, finance, management, growth, planning.

Comparison Ppt PowerPoint Presentation Portfolio Inspiration
This is a comparison ppt powerpoint presentation portfolio inspiration. This is a two stage process. The stages in this process are business, marketing, comparison, finance, management.

Stacked Column Ppt PowerPoint Presentation Layouts Guidelines
This is a stacked column ppt powerpoint presentation layouts guidelines. This is a nine stage process. The stages in this process are stacked column, finance, marketing, strategy, business.

Dashboard Ppt PowerPoint Presentation Outline Grid
This is a dashboard ppt powerpoint presentation outline grid. This is a two stage process. The stages in this process are business, strategy, analysis, planning, dashboard, finance.

Column Chart Ppt PowerPoint Presentation Influencers
This is a column chart ppt powerpoint presentation influencers. This is a two stage process. The stages in this process are column chart, finance, marketing, strategy, analysis, business.
Pie Chart Ppt PowerPoint Presentation Infographics Icons
This is a pie chart ppt powerpoint presentation infographics icons. This is a three stage process. The stages in this process are pie chart, finance, analysis, marketing, strategy.

Stacked Column Ppt PowerPoint Presentation Ideas Pictures
This is stacked column ppt powerpoint presentation ideas pictures. This is a two stage process. The stages in this process are product, in million, strategy management, business, finance.
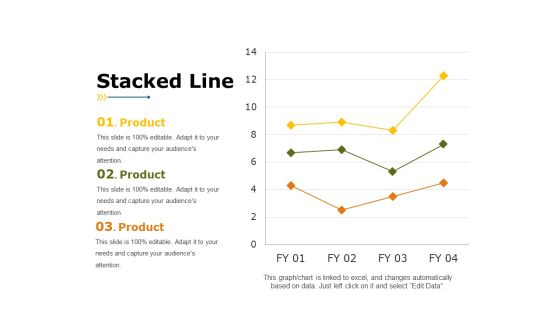
Stacked Line Ppt PowerPoint Presentation Background Image
This is a stacked line ppt powerpoint presentation background image. This is a three stage process. The stages in this process are product, stacked line, business, marketing, finance.

Competitor Positioning Ppt PowerPoint Presentation Outline Tips
This is a competitor positioning ppt powerpoint presentation outline tips. This is a two stage process. The stages in this process are company growth, business, marketing, finance, graph.

Clustered Column Ppt PowerPoint Presentation Icon Professional
This is a clustered column ppt powerpoint presentation icon professional. This is a two stage process. The stages in this process are product, business, marketing, finance, planning, graph.
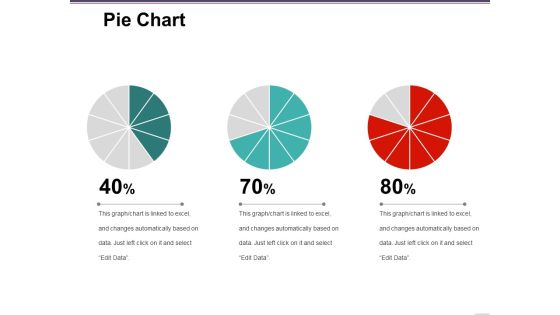
Pie Chart Ppt PowerPoint Presentation Layouts Good
This is a pie chart ppt powerpoint presentation layouts good. This is a three stage process. The stages in this process are finance, marketing, management, process, business.

Clustered Column Ppt PowerPoint Presentation Ideas Show
This is a clustered column ppt powerpoint presentation ideas show. This is a two stage process. The stages in this process are product, percentage, finance, business, bar graph.

Pie Chart Ppt PowerPoint Presentation Ideas Microsoft
This is a pie chart ppt powerpoint presentation ideas microsoft. This is a four stage process. The stages in this process are pie chart, finance, marketing, strategy, business.
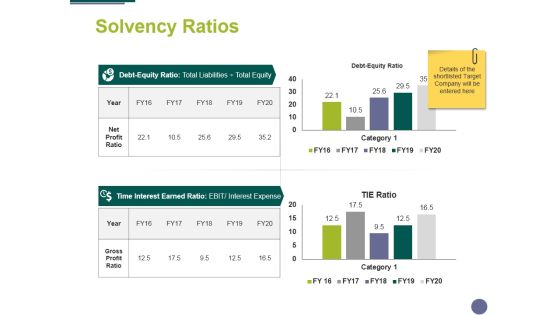
Solvency Ratios Ppt PowerPoint Presentation Infographics Portrait
This is a solvency ratios ppt powerpoint presentation infographics portrait. This is a two stage process. The stages in this process are compere, finance, marketing, analysis, business.

Clustered Bar Ppt PowerPoint Presentation Pictures Demonstration
This is a clustered bar ppt powerpoint presentation pictures demonstration. This is a two stage process. The stages in this process are clustered bar, finance, marketing, analysis, business.
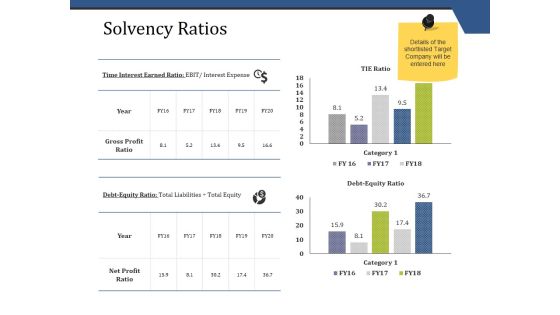
Solvency Ratios Ppt PowerPoint Presentation Summary Samples
This is a solvency ratios ppt powerpoint presentation summary samples. This is a two stage process. The stages in this process are business, compare, finance, marketing, strategy, analysis.

Solvency Ratios Ppt PowerPoint Presentation Summary Shapes
This is a solvency ratios ppt powerpoint presentation summary shapes. This is a two stage process. The stages in this process are compere, analysis, finance, business, marketing.

Column Chart Ppt PowerPoint Presentation Ideas Visual Aids
This is a column chart ppt powerpoint presentation ideas visual aids. This is a two stage process. The stages in this process are growth, business, finance, marketing, analysis.

Combo Chart Ppt PowerPoint Presentation Styles Example File
This is a combo chart ppt powerpoint presentation styles example file. This is a three stage process. The stages in this process are finance, growth, business, analysis, marketing.

Column Chart Ppt PowerPoint Presentation File Graphics
This is a column chart ppt powerpoint presentation file graphics. This is a two stage process. The stages in this process are column chart, finance, analysis, marketing, business.
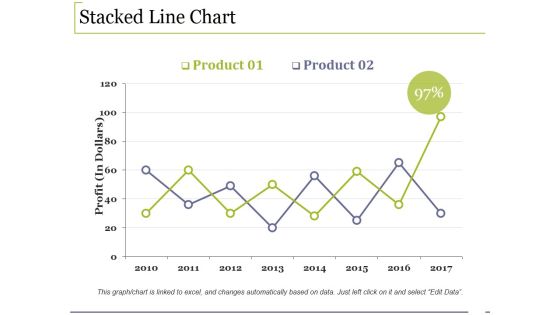
Stacked Line Chart Ppt PowerPoint Presentation Ideas Styles
This is a stacked line chart ppt powerpoint presentation ideas styles. This is a two stage process. The stages in this process are growth, finance, analysis, management, business.

Clustered Column Ppt PowerPoint Presentation Layouts Ideas
This is a clustered column ppt powerpoint presentation layouts ideas. This is a two stage process. The stages in this process are product, profit, bar graph, growth, finance.
Pie Chart Ppt PowerPoint Presentation Outline Icons
This is a pie chart ppt powerpoint presentation outline icons. This is a three stage process. The stages in this process are pie chart, finance, marketing, strategy, business.

Pie Chart Ppt PowerPoint Presentation Outline Gallery
This is a pie chart ppt powerpoint presentation outline gallery. This is a five stage process. The stages in this process are pie chart, finance, marketing, strategy, analysis.
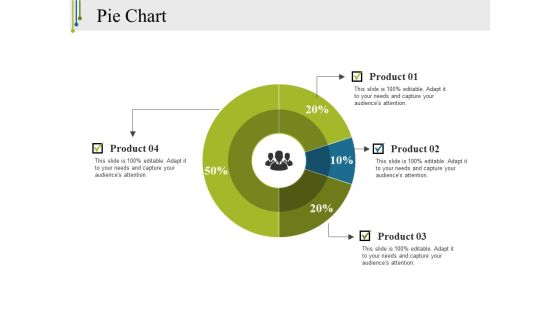
Pie Chart Ppt PowerPoint Presentation Infographics Clipart
This is a pie chart ppt powerpoint presentation infographics clipart. This is a four stage process. The stages in this process are pie chart, finance, marketing, strategy, business.

Area Stacked Ppt PowerPoint Presentation Show Mockup
This is a area stacked ppt powerpoint presentation show mockup. This is a two stage process. The stages in this process are area stacked, product, percentage, year, finance.

Financial Growth Analysis Diagram Powerpoint Template
Develop competitive advantage with our above template which contains coins stacks with blue arrow. This diagram may be used to exhibit financial growth analysis. You can edit text, color, shade and style as per you need.

Assessing Stocks In Financial Market Historical Share Price Performance For Equity Research Ppt PowerPoint Presentation Ideas Picture PDF
Presenting this set of slides with name assessing stocks in financial market historical share price performance for equity research ppt powerpoint presentation ideas picture pdf. The topics discussed in these slides are stock price performance, key events, service line launch, equity research, cfo appointed. This is a completely editable PowerPoint presentation and is available for immediate download. Download now and impress your audience.

Financial Planning Chart Showing Difference Between Actual And Estimated Figures Ppt PowerPoint Presentation Show Infographic Template PDF
Presenting this set of slides with name financial planning chart showing difference between actual and estimated figures ppt powerpoint presentation show infographic template pdf. The topics discussed in these slides are estimated, actual, difference, miscellaneous payments, transportation. This is a completely editable PowerPoint presentation and is available for immediate download. Download now and impress your audience.

Circular Steps For Market Entry Strategy Powerpoint Slides
This PowerPoint template contains graphics of circular steps. You may download this PPT slide design to display market entry strategy. You can easily customize this template to make it more unique as per your need.

Circle Chart For Value Analysis Powerpoint Slides
This PowerPoint template has been designed for business presentations and corporate slides. The PowerPoint template has a high quality design. You can download this PowerPoint slide for corporate presentations or annual meeting and business plans.

Target Chart For Strategic Management Process Powerpoint Slides
This PowerPoint template has been designed with four steps target chart. The PowerPoint template may be used to display strategic management process. You can download this PowerPoint slide for corporate presentations or annual meeting and business plans.

Bar Graph For Year Based Analysis Powerpoint Slides
This PowerPoint template has been designed with year based bar graph. This diagram may be used to display yearly statistical analysis. Use this PPT slide design to make impressive presentations.

Business Steps Diagram With Icons Powerpoint Slides
Visually support your presentation with our above template containing graphics of stairs diagram. It helps to portray directions of business actions. Etch your views in the brains of your audience with this diagram slide.
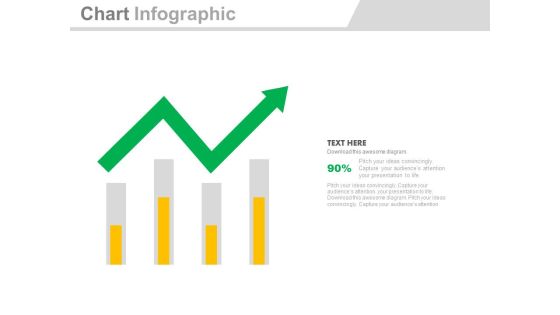
Four Bars With Green Growth Arrow Powerpoint Slides
Four bars with green arrow have been displayed in this business slide. This business diagram helps to exhibit process of business planning. Use this diagram to build an exclusive presentation.

Four Circles With Percentage Data Display Powerpoint Slides
This PowerPoint template has been designed with graphics of four circles. Download this PPT slide to display percentage data display. Use this professional template to build an exclusive presentation.
Four Colored Text Boxes With Icons Powerpoint Slides
This PowerPoint template has been designed with graphics of four text boxes. Download this PPT slide to display percentage data display. Use this professional template to build an exclusive presentation.
Four Linear Steps And Icons Powerpoint Slides
This PPT slide has been designed with four linear text boxes with icons. This PowerPoint template helps to exhibit process of business planning. Use this diagram slide to build an exclusive presentation.

Four Steps For Organizational Learning Methods Powerpoint Slides
Four text boxes have been displayed in this business slide. This PowerPoint template helps to exhibit organizational learning methods. Use this diagram slide to build an exclusive presentation.

Infographic Diagram For Business Process Analysis Powerpoint Slides
This PowerPoint slide contains business infographic diagram. This professional slide may be used to display business process analysis. Use this business template to make impressive presentations.
Mountain Chart With Social Media Icons Powerpoint Slides
The above PPT template displays mountain chart with social media icons. This PowerPoint template has been designed to exhibit users of social media. Download this PPT slide to attract the attention of your audience.
Process Flow Diagram With Business Icons Powerpoint Slides
Emphatically define your message with our above infographic template. This PowerPoint template may be used to display business process flow. Grab the attention of your listeners with this slide.
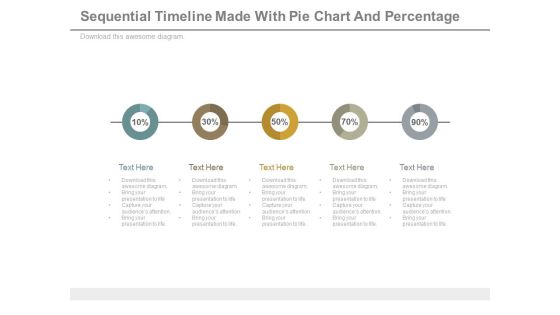
Sequential Timeline Diagram With Percentage Values Powerpoint Slides
This diagram contains graphics of linear circles timeline diagram. Download this diagram slide to display business planning and management. This diagram is editable you can edit text, color, shade and style as per you need.
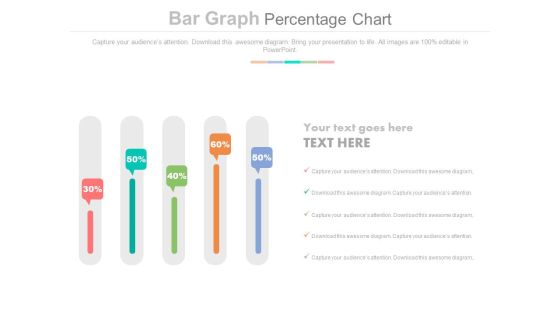
Sliders Percentage Data Chart Powerpoint Slides
This PowerPoint slide has been designed with slider chart and percentage data. This PPT diagram may be used to display business trends. This diagram slide can be used to make impressive presentations.
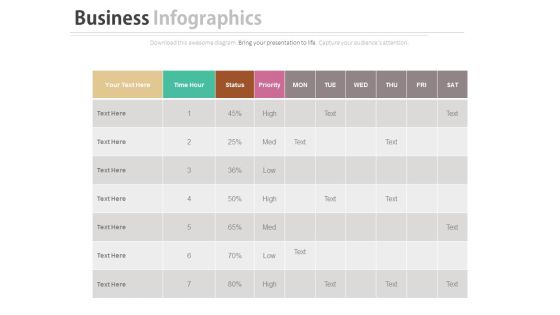
Work Sheet For Daily Activity Plan Schedule Powerpoint Slides
Our above business slide contains graphics of daily worksheet. This PowerPoint slide may be used to exhibit activity plan and schedule. Capture the attention of your audience with this slide.
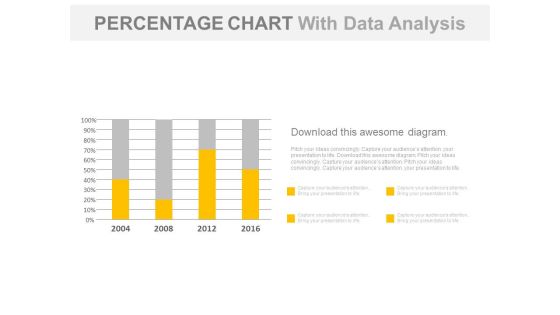
Year Based Chart With Percentage Data Analysis Powerpoint Slides
Our above business slide contains year based statistical chart. This PowerPoint template can be used to display percentage data analysis. Capture the attention of your audience with this slide.

Bar Graph For Profit Growth Analysis Powerpoint Slides
This PowerPoint template has been designed with bar graph with percentage values. This diagram is useful to exhibit profit growth analysis. This diagram slide can be used to make impressive presentations.

Bar Graph For Yearly Statistical Analysis Powerpoint Slides
This PowerPoint template has been designed with bar graph. This PowerPoint diagram is useful to exhibit yearly statistical analysis. This diagram slide can be used to make impressive presentations.

Circular Diagram For Percentage Analysis Powerpoint Slides
This PowerPoint slide has been designed with circular diagram with social media icons. This diagram slide may be used to display users of social media. Prove the viability of your ideas with this professional slide.

Data Driven Comparison Charts For Analysis Powerpoint Slides
You can download this PowerPoint template to display statistical data and analysis. This PPT slide contains data driven comparison charts. Draw an innovative business idea using this professional diagram.
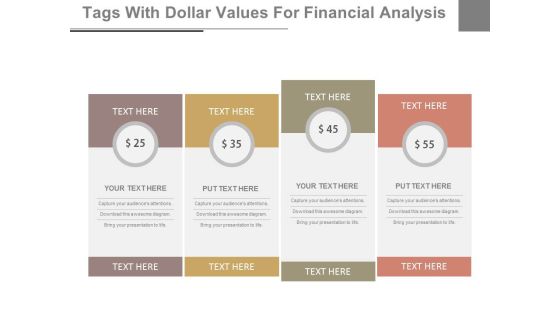
Dollar Value Pricing Table Powerpoint Slides
This PowerPoint template has been designed with dollar value pricing table chart. This PPT slide may be used for sample marketing proposal. Download this slide to build unique presentation.
Five Linear Circles And Icons For Technology Powerpoint Slides
This PowerPoint template has been designed with five linear circles and icons. This professional PPT slide is suitable to present technology growth steps. Capture the attention of your audience using this professional slide.
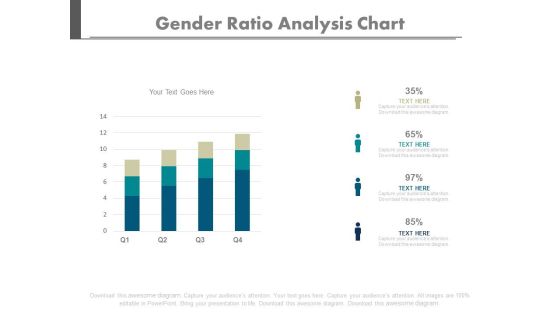
Four Bars Gender Population Ratio Chart Powerpoint Slides
Create dynamic presentations with our creative template of bar graph. This diagram may be used to present gender population. Download this template to leave permanent impression on your audience.
Four Clouds With Arrows And Icons Powerpoint Slides
This business slide displays diagram of four clouds with arrow and icons. Download this PowerPoint diagram to display technology development and management. Enlighten your audience with your breathtaking ideas.

Four Pyramids With Growth Steps Powerpoint Slides
This business slide has been designed with four pyramids. This PowerPoint template may use to display sales growth and analysis. Prove the viability of your ideas using this impressive slide.
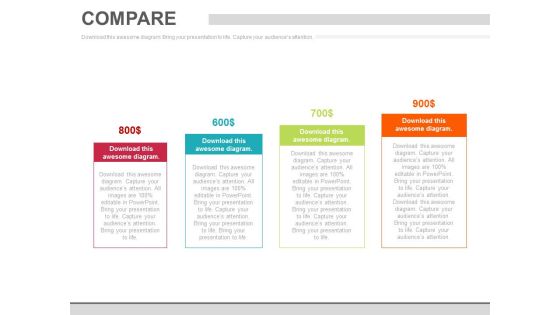
Four Steps Pricing Option Chart Powerpoint Slides
This PowerPoint template has been designed with dollar value pricing table chart. This PPT slide may be used for sample marketing proposal. Download this slide to build unique presentation.
Four Steps Pricing Table With Icons Powerpoint Slides
This PowerPoint template has been designed with dollar value pricing table chart. This PPT slide may be used for sample marketing proposal. Download this slide to build unique presentation.
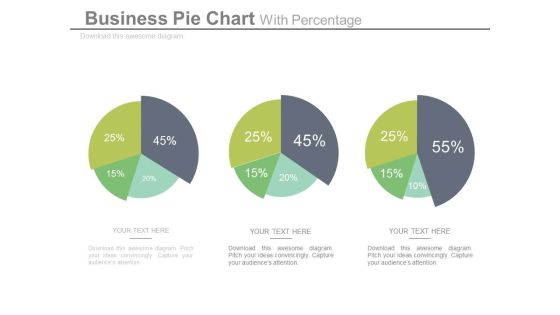
Pie Charts For Relative Comparison Study Powerpoint Slides
This power point template illustrates diagram of three pie charts with percentage values. This business slide can be used for relative comparison study. Present your views and ideas with this impressive slide.

Pricing Comparison Table For Analysis Powerpoint Slides
This PowerPoint template has been designed with pricing comparison table. This PowerPoint template may be used to present pricing strategy. Prove the viability of your ideas using this impressive slide.

Table Chart For Business Plan Powerpoint Slides
Table chart has been used to design this power point template. This diagram may be used to display business plan. Download this template to leave permanent impression on your audience.

Table For Total Sales Analysis Powerpoint Slides
This PowerPoint template has been designed with four steps table chart. Use this PPT slide to display total sales analysis. Download this template to leave permanent impression on your audience.

Tap With Water Drops Diagram Powerpoint Slides
This PowerPoint template has been designed with graphics of tap with water drops. Download this business diagram to display save water concept. Present your views and ideas with this impressive design.
Text Tags And Icons With Percentage Values Powerpoint Slides
This PowerPoint template has been designed with graphics of text tags, icons and percentage values. Download this business diagram to outline business plan. Present your views and ideas with this impressive design.
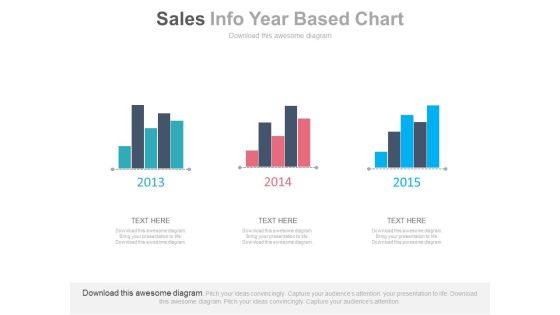
Three Years Sales Data Bar Graph Powerpoint Slides
This PowerPoint template has been designed with bar charts. This business slide may be used to display three years sales data for comparison. Present your views and ideas with this impressive design.

Triangle For Teams Performance Analysis Powerpoint Slides
This PPT slide displays graphics of triangle diagram with teams icons. Download this PowerPoint template for teams performances analysis. Use this PowerPoint template to emphasize your views.
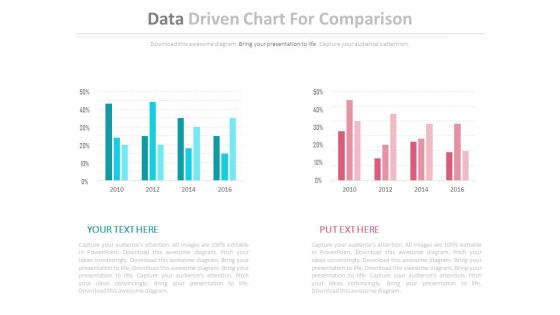
Two Data Driven Comparison Charts Powerpoint Slides
This PowerPoint template contains diagram of two data driven charts. You may use this PPT slide to depict strategic analysis for business. The color coding of this template is specifically designed to highlight you points.

Bar Chart For Strategic Planning Powerpoint Slides
This PowerPoint template has been designed with bar graph with two teams. This diagram is useful to exhibit strategic planning. This diagram slide can be used to make impressive presentations.

Bar Graph For Data Distribution And Analysis Powerpoint Slides
This PowerPoint template has been designed with bar graph. This PowerPoint diagram is useful for data distribution and analysis This diagram slide can be used to make impressive presentations.

Bar Graph With Increasing Percentage Flow Powerpoint Slides
This PowerPoint slide has been designed with bar graph and increasing percentage values. This diagram slide may be used to display profit growth. Prove the viability of your ideas with this professional slide.

Digital Media And Teamwork For Business Powerpoint Slides
This PowerPoint template has been designed with media devices and team pictures. This professional PPT slide is suitable to present digital media and teamwork. Capture the attention of your audience using this professional slide.
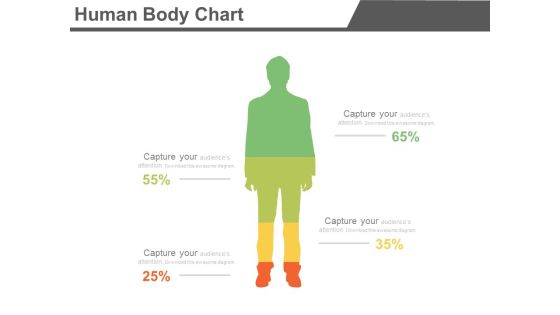
Four Segments Human Body Chart Powerpoint Slides
Create dynamic presentations with our creative template of human body chart with four segments. This diagram may be used to present information in visual manner. Download this template to leave permanent impression on your audience.

Four Steps Chart For Business Planning Powerpoint Slides
Our professionally designed business diagram is as an effective tool for communicating business planning. It contains four steps charts with icons. Above slide is suitable to display process management steps.
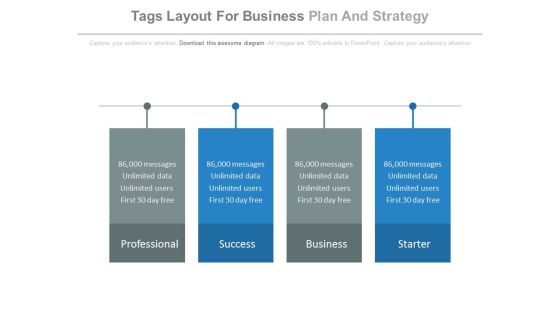
Four Tags Layout For Business Plan And Strategy Powerpoint Slides
This business slide displays diagram of four text tags. Download this PowerPoint diagram to display business plan and strategy. Enlighten your audience with your breathtaking ideas.

Semicircle Infographic Diagram For Business Process Powerpoint Slides
This PowerPoint template has been designed with semicircle infographic diagram. This PPT slide may be used to display business process flow. Download this slide to build unique presentation.
Six Steps Circular Chart With Icons Powerpoint Slides
This PowerPoint template has been designed with six steps circular chart with icons. This PPT slide may be used to display business and management functions. Download this slide to build unique presentation.
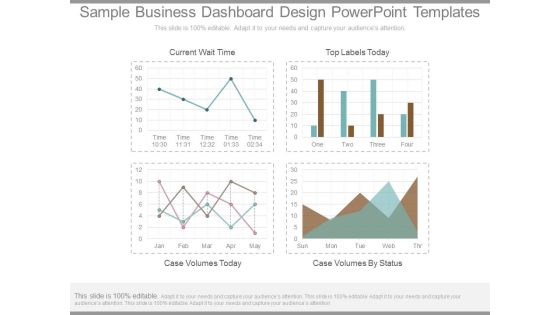
Sample Business Dashboard Design Powerpoint Templates
This is a sample business dashboard design powerpoint templates. This is a four stage process. The stages in this process are current wait time, top labels today, case volumes today, case volumes by status.
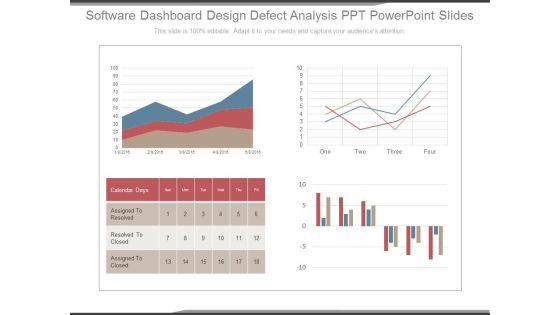
Software Dashboard Design Defect Analysis Ppt Powerpoint Slides
This is a software dashboard design defect analysis ppt powerpoint slides. This is a four stage process. The stages in this process are calendar days, assigned to resolved, resolved to closed, assigned to closed.
Human Performance Improvement Technologies Ppt Icon
This is a human performance improvement technologies ppt icon. This is a four stage process. The stages in this process are score, overall territory performance, weight.

Comparison Ppt PowerPoint Presentation Portfolio Slides
This is a comparison ppt powerpoint presentation portfolio slides. This is a two stage process. The stages in this process are male, female, comparison, percentage, business.

Stock Chart Ppt PowerPoint Presentation Gallery Graphic Images
This is a stock chart ppt powerpoint presentation gallery graphic images. This is a five stage process. The stages in this process are close, high, volume, low, open.

Bar Graph Ppt PowerPoint Presentation Ideas Show
This is a bar graph ppt powerpoint presentation ideas show. This is a three stage process. The stages in this process are product, percentage, business, year, graph.

High Low Close Chart Template 1 Ppt PowerPoint Presentation Infographics Graphics Design
This is a high low close chart template 1 ppt powerpoint presentation infographics graphics design. This is a five stage process. The stages in this process are close, high, volume, low, open, product.
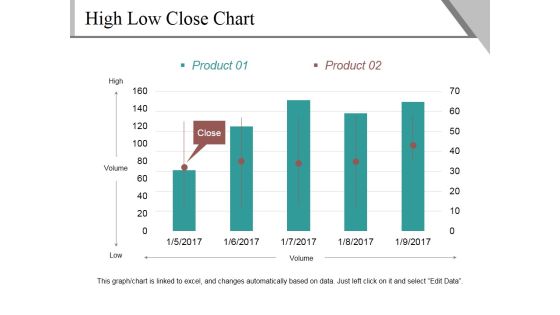
High Low Close Chart Template 2 Ppt PowerPoint Presentation Outline Show
This is a high low close chart template 2 ppt powerpoint presentation outline show. This is a five stage process. The stages in this process are high, volume, low, close, product.
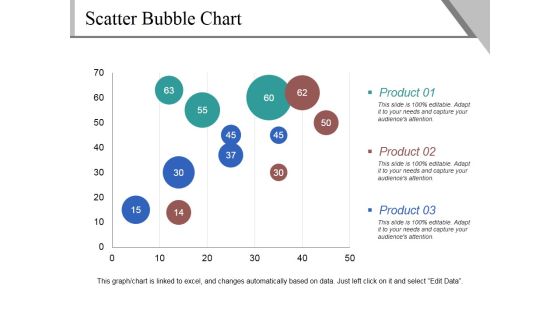
Scatter Bubble Chart Ppt PowerPoint Presentation Pictures Demonstration
This is a scatter bubble chart ppt powerpoint presentation pictures demonstration. This is a three stage process. The stages in this process are product, business, marketing, scatter chart.
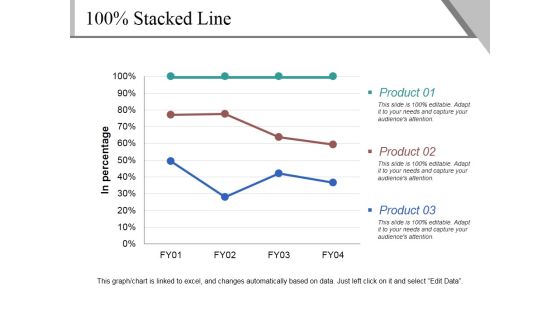
Stacked Line Ppt PowerPoint Presentation Professional Tips
This is a stacked line ppt powerpoint presentation professional tips. This is a three stage process. The stages in this process are product, in percentage, business, marketing.

Executive Summary Ppt PowerPoint Presentation Summary Good
This is a executive summary ppt powerpoint presentation summary good. This is a seven stage process. The stages in this process are companys vision, companys mission, background, capabilities, accreditation.

Product Life Cycle Ppt PowerPoint Presentation Summary Deck
This is a product life cycle ppt powerpoint presentation summary deck. This is a four stage process. The stages in this process are introduction, growth, maturity, decline.

Brand Tracking Info Graphics Ppt PowerPoint Presentation Infographics Slides
This is a brand tracking info graphics ppt powerpoint presentation infographics slides. This is a four stage process. The stages in this process are of consumers read, trust online reviews, user generated, look to online.
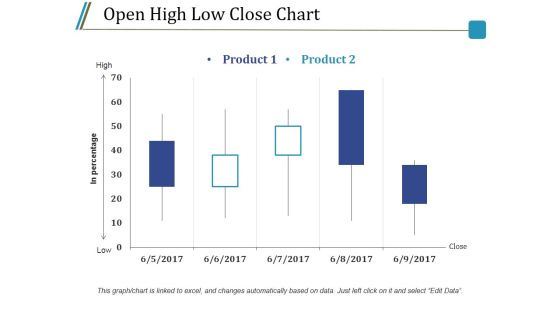
Open High Low Close Chart Ppt PowerPoint Presentation Styles Model
This is a open high low close chart ppt powerpoint presentation styles model. This is a five stage process. The stages in this process are product, high, low, in percentage, close.
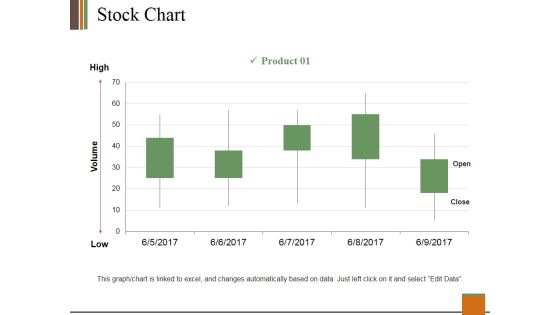
Stock Chart Ppt PowerPoint Presentation Slides Clipart
This is a stock chart ppt powerpoint presentation slides clipart. This is a one stage process. The stages in this process are product, high, volume, low, open, close.

Stacked Line Chart Ppt PowerPoint Presentation Pictures Elements
This is a stacked line chart ppt powerpoint presentation pictures elements. This is a two stage process. The stages in this process are product, profit, stacked line chart, year, business.

Bridge Transition Model Ppt PowerPoint Presentation Gallery Infographics
This is a bridge transition model ppt powerpoint presentation gallery infographics. This is a four stage process. The stages in this process are ending, transitions, new beginning, commitment, exploration.

Change Management Experience Ppt PowerPoint Presentation Gallery Styles
This is a change management experience ppt powerpoint presentation gallery styles. This is a four stage process. The stages in this process are poor, fair, good, excellent, percentage.

Stock Chart Template 2 Ppt PowerPoint Presentation Infographic Template Styles
This is a stock chart template 2 ppt powerpoint presentation infographic template styles. This is a one stage process. The stages in this process are high, volume, low, product, volume.

Open High Low Close Chart Ppt PowerPoint Presentation Outline Rules
This is a open high low close chart ppt powerpoint presentation outline rules. This is a two stage process. The stages in this process are product, high, low, close, in percentage.
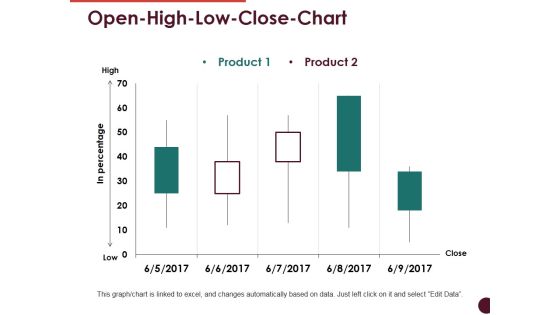
Open High Low Close Chart Ppt PowerPoint Presentation Professional Visuals
This is a open high low close chart ppt powerpoint presentation professional visuals. This is a two stage process. The stages in this process are high, low, in percentage, product, close.

Volume High Low Close Chart Ppt PowerPoint Presentation Infographics Good
This is a volume high low close chart ppt powerpoint presentation infographics good. This is a two stage process. The stages in this process are high, volume, low, product, close.
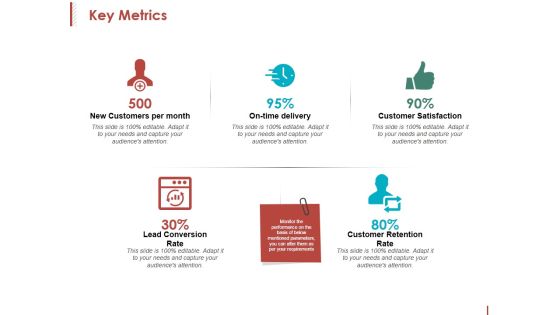
Key Metrics Ppt PowerPoint Presentation Inspiration Format
This is a key metrics ppt powerpoint presentation inspiration format. This is a five stage process. The stages in this process are new customers per month, on time delivery, customer satisfaction, customer retention rate.
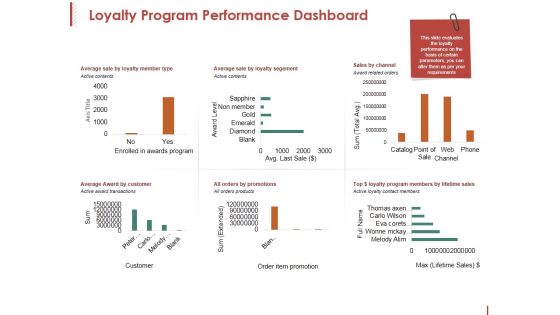
Loyalty Program Performance Dashboard Ppt PowerPoint Presentation Pictures Clipart
This is a loyalty program performance dashboard ppt powerpoint presentation pictures clipart. This is a six stage process. The stages in this process are axis title, award level, sum, active contents, channel.
Sales Kpi Tracker Ppt PowerPoint Presentation Gallery Shapes
This is a sales kpi tracker ppt powerpoint presentation gallery shapes. This is a six stage process. The stages in this process are target growth, leads created, sales ratio, last year, stretched growth.
Stock Chart Ppt PowerPoint Presentation Inspiration Icon
This is a stock chart ppt powerpoint presentation inspiration icon. This is a two stage process. The stages in this process are high, volume, low, product, close.
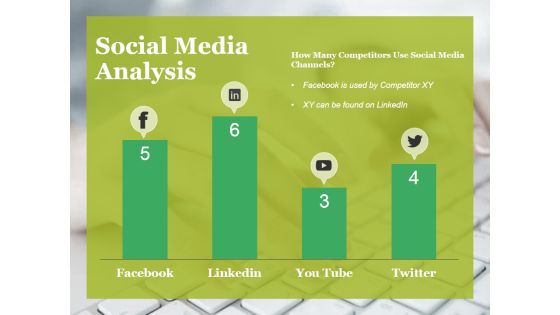
Social Media Analysis Ppt PowerPoint Presentation Infographics Samples
This is a social media analysis ppt powerpoint presentation infographics samples. This is a four stage process. The stages in this process are facebook, linkedin, twitter, you tube, social media.

Radar Chart Ppt PowerPoint Presentation Summary Design Templates
This is a radar chart ppt powerpoint presentation summary design templates. This is a two stage process. The stages in this process are radar chart, product, shapes, business, marketing.
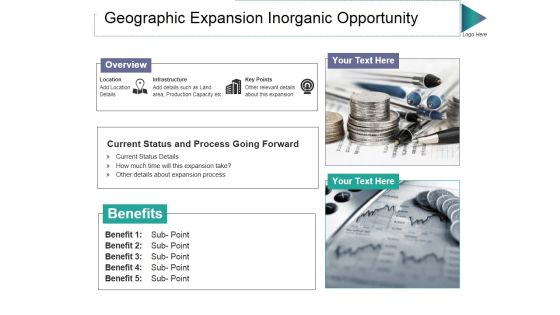
Geographic Expansion Inorganic Opportunity Ppt PowerPoint Presentation Pictures Maker
This is a geographic expansion inorganic opportunity ppt powerpoint presentation pictures maker. This is a two stage process. The stages in this process are overview, infrastructure, key points, location, benefits.

Key Highlights Ppt PowerPoint Presentation Gallery Background Images
This is a key highlights ppt powerpoint presentation gallery background images. This is a eight stage process. The stages in this process are average roce, certified welders, countries, leader in automobile, years.

Comparison Ppt PowerPoint Presentation Infographics Examples
This is a comparison ppt powerpoint presentation infographics examples. This is a two stage process. The stages in this process are user, comparison, dollar, symbol, business.
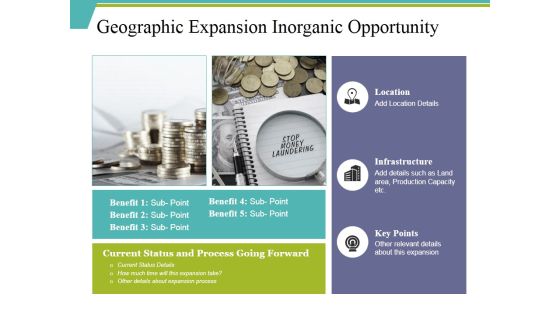
Geographic Expansion Inorganic Opportunity Ppt PowerPoint Presentation Ideas Example Introduction
This is a geographic expansion inorganic opportunity ppt powerpoint presentation ideas example introduction. This is a three stage process. The stages in this process are location, infrastructure, key points, benefit, sub point.

Radar Chart Ppt PowerPoint Presentation Gallery Templates
This is a radar chart ppt powerpoint presentation gallery templates. This is a two stage process. The stages in this process are radar chart, product, shape, business.
Stock Chart Ppt PowerPoint Presentation Icon Format
This is a stock chart ppt powerpoint presentation icon format. This is a two stage process. The stages in this process are product, close, high, volume, low.

Stock Chart Ppt PowerPoint Presentation Slides Graphics Pictures
This is a stock chart ppt powerpoint presentation slides graphics pictures. This is a two stage process. The stages in this process are product, high, volume, low, open.

Comparison Ppt PowerPoint Presentation Slides Structure
This is a comparison ppt powerpoint presentation slides structure. This is a three stage process. The stages in this process are pc users in, laptop users in, mobile users in, technology, years.
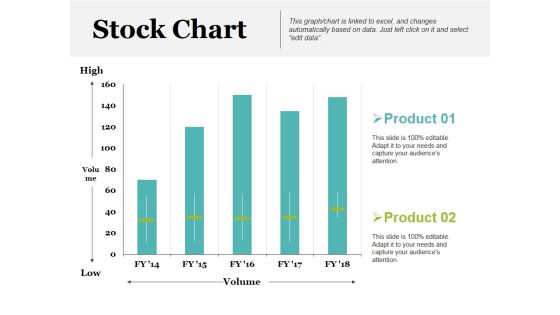
Stock Chart Ppt PowerPoint Presentation Inspiration Example Introduction
This is a stock chart ppt powerpoint presentation inspiration example introduction. This is a two stage process. The stages in this process are product, high, volume, low, stock chart.
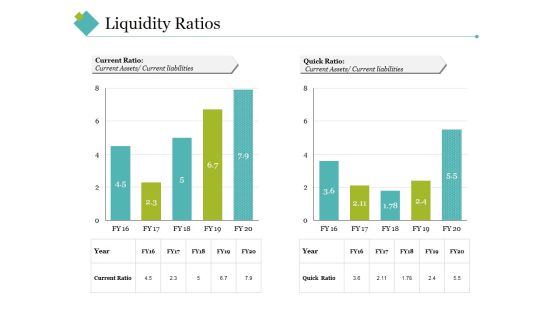
Liquidity Ratios Template 2 Ppt PowerPoint Presentation Gallery Vector
This is a liquidity ratios template 2 ppt powerpoint presentation gallery vector. This is a two stage process. The stages in this process are quick ratio, current ratio, current liabilities, current assets.
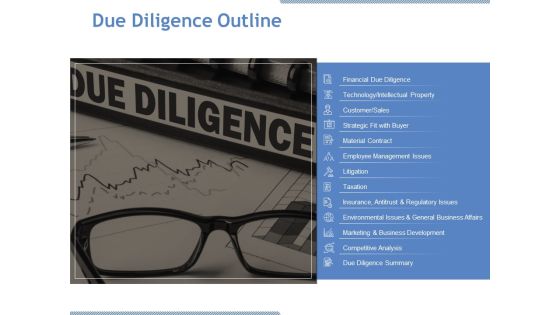
Due Diligence Outline Ppt PowerPoint Presentation Inspiration Gallery
This is a due diligence outline ppt powerpoint presentation inspiration gallery. This is a one stage process. The stages in this process are customer, material contract, litigation, taxation, competitive analysis.

Stacked Line Ppt PowerPoint Presentation Pictures Example Topics
This is a stacked line ppt powerpoint presentation pictures example topics. This is a three stage process. The stages in this process are product, in percentage, stacked line, business, marketing.
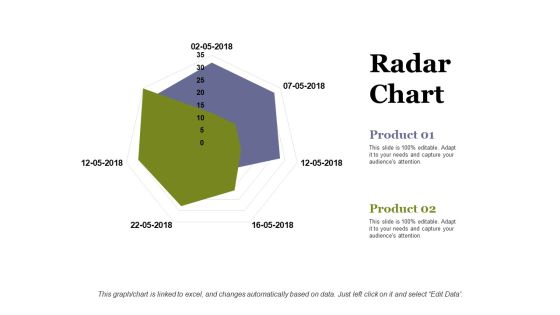
Radar Chart Ppt PowerPoint Presentation Infographic Template Information
This is a radar chart ppt powerpoint presentation infographic template information. This is a two stage process. The stages in this process are radar chart, product, business, marketing, shape.

Stacked Line Ppt PowerPoint Presentation Infographics Vector
This is a stacked line ppt powerpoint presentation infographics vector. This is a three stage process. The stages in this process are product, stacked line, business, marketing, in percentage.

Comparison Ppt PowerPoint Presentation Professional Example File
This is a comparison ppt powerpoint presentation professional example file. This is a two stage process. The stages in this process are male, female, comparison.

Stock Chart Ppt PowerPoint Presentation Ideas Infographics
This is a stock chart ppt powerpoint presentation ideas infographics. This is a two stage process. The stages in this process are high, volume, low, product, stock chart.

Area Chart Ppt PowerPoint Presentation Professional Grid
This is a area chart ppt powerpoint presentation professional grid. This is a two stage process. The stages in this process are product, sales in percentage, business.

Control Chart Template 1 Ppt PowerPoint Presentation Ideas Images
This is a control chart template 1 ppt powerpoint presentation ideas images. This is a two stage process. The stages in this process are average range or quality, upper control limit, lower control limit, time, process average.

Control Chart Template 2 Ppt PowerPoint Presentation Portfolio Summary
This is a control chart template 2 ppt powerpoint presentation portfolio summary. This is a one stage process. The stages in this process are upper control limit, process segment, process change, unstable trend, lower control limit.

Bar Chart Ppt PowerPoint Presentation Portfolio Inspiration
This is a bar chart ppt powerpoint presentation portfolio inspiration. This is a two stage process. The stages in this process are product, in percentage, in years.

Marketing Reach By Channels Ppt PowerPoint Presentation Styles Professional
This is a marketing reach by channels ppt powerpoint presentation styles professional. This is a six stage process. The stages in this process are top performing, non scalable, emails, print ads, inline media.

Stock Chart Ppt PowerPoint Presentation Layouts Outfit
This is a stock chart ppt powerpoint presentation layouts outfit. This is a two stage process. The stages in this process are close, high, volume, low, open.
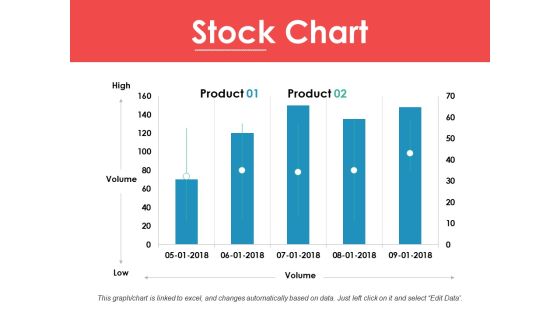
Stock Chart Ppt PowerPoint Presentation Ideas Infographic Template
This is a stock chart ppt powerpoint presentation ideas infographic template. This is a two stage process. The stages in this process are high, volume, low, product, stock chart.

Stock Chart Ppt PowerPoint Presentation Guide
This is a stock chart ppt powerpoint presentation guide. This is a two stage process. The stages in this process are product, close, high, volume, low.
Volume Open High Low Close Chart Ppt PowerPoint Presentation Icon Design Inspiration
This is a volume open high low close chart ppt powerpoint presentation icon design inspiration. This is a three stage process. The stages in this process are close, high, low, volume, open.

Debit Card Payment Processing Steps With Icons Ppt PowerPoint Presentation Portfolio Background
This is a debit card payment processing steps with icons ppt powerpoint presentation portfolio background. This is a six stage process. The stages in this process are payment processing, instalment processing, premium processing.
Human Hand With Percent Sign Ppt PowerPoint Presentation Icon Clipart Images
This is a human hand with percent sign ppt powerpoint presentation icon clipart images. This is a three stage process. The stages in this process are percentage icon, dividend icon, portion icon.
Percentage Icon In Circle With Text Holders Ppt PowerPoint Presentation Layouts Inspiration
This is a percentage icon in circle with text holders ppt powerpoint presentation layouts inspiration. This is a three stage process. The stages in this process are percentage icon, dividend icon, portion icon.

Percentage Symbol With Text Holders Ppt PowerPoint Presentation Example 2015
This is a percentage symbol with text holders ppt powerpoint presentation example 2015. This is a three stage process. The stages in this process are percentage icon, dividend icon, portion icon.
Percentage Value Comparison Pie Chart Icon Ppt PowerPoint Presentation Model Clipart Images
This is a percentage value comparison pie chart icon ppt powerpoint presentation model clipart images. This is a three stage process. The stages in this process are percentage icon, dividend icon, portion icon.
White Percentage Sign In Green Circle Ppt PowerPoint Presentation Outline Templates
This is a white percentage sign in green circle ppt powerpoint presentation outline templates. This is a three stage process. The stages in this process are percentage icon, dividend icon, portion icon.

Comparitive Analysis Of Factors To Be Considered For Vendor Selection Ppt PowerPoint Presentation Portfolio Grid PDF
Presenting this set of slides with name comparitive analysis of factors to be considered for vendor selection ppt powerpoint presentation portfolio grid pdf. The topics discussed in these slides are product quality assurance, technical expertise, scalability, support response timen. This is a completely editable PowerPoint presentation and is available for immediate download. Download now and impress your audience.
Dollar Coins Falling On Man Vector Icon Ppt PowerPoint Presentation Files PDF
Presenting this set of slides with name dollar coins falling on man vector icon ppt powerpoint presentation files pdf. This is a three stage process. The stages in this process are dollar coins falling on man vector icon. This is a completely editable PowerPoint presentation and is available for immediate download. Download now and impress your audience.

Volume Reductions For New Patients Due To Coronavirus Ppt Diagram Images PDF
This slide covers the impact of COVID on volume reductions for new patients based on scale of less interaction and more interaction. Deliver and pitch your topic in the best possible manner with this volume reductions for new patients due to coronavirus ppt diagram images pdf. Use them to share invaluable insights on key insights, patient interaction, existing patients and impress your audience. This template can be altered and modified as per your expectations. So, grab it now.

Hubspot Profitability Leverage Rules PDF
This slide provides the glimpse about the companys leverage for profitability which focuses on gross margin, and operating margin of the firm. Deliver an awe inspiring pitch with this creative hubspot profitability leverage rules pdf bundle. Topics like hubspot profitability leverage can be discussed with this completely editable template. It is available for immediate download depending on the needs and requirements of the user.

Competitive Edge Performance Representation For Variance Analysis Techniques And Models Ideas PDF
This slide covers the graphical representation for gap analyzation process. It also covers the important factors such as, sales metrics, time frame, potential and performance. Showcasing this set of slides titled competitive edge performance representation for variance analysis techniques and models ideas pdf. The topics addressed in these templates are competitive edge performance representation for variance analysis techniques and models. All the content presented in this PPT design is completely editable. Download it and make adjustments in color, background, font etc. as per your unique business setting.
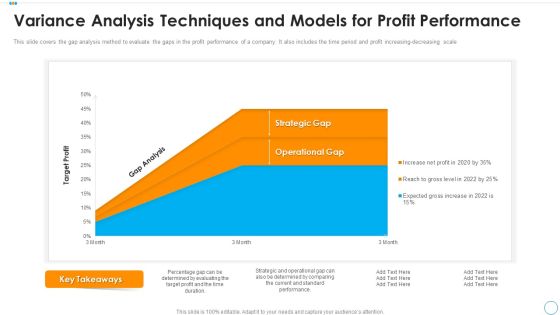
Variance Analysis Techniques And Models For Profit Performance Sample PDF
This slide covers the gap analysis method to evaluate the gaps in the profit performance of a company. It also includes the time period and profit increasing decreasing scale. Showcasing this set of slides titled variance analysis techniques and models for profit performance sample pdf. The topics addressed in these templates are variance analysis techniques and models for profit performance. All the content presented in this PPT design is completely editable. Download it and make adjustments in color, background, font etc. as per your unique business setting.
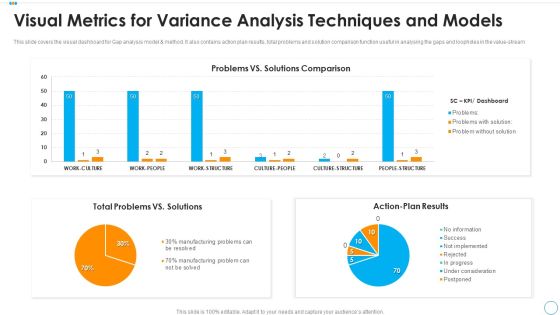
Visual Metrics For Variance Analysis Techniques And Models Mockup PDF
This slide covers the visual dashboard for Gap analysis model and method. It also contains action plan results, total problems and solution comparison function useful in analysing the gaps and loopholes in the value stream. Showcasing this set of slides titled visual metrics for variance analysis techniques and models mockup pdf. The topics addressed in these templates are total problems vs solutions, action plan results, problems vs solutions comparison. All the content presented in this PPT design is completely editable. Download it and make adjustments in color, background, font etc. as per your unique business setting.

How Bidding Teams Determine User Persona For Better Client Understanding Sample PDF
This slide provides information regarding user persona for better customer understanding in terms of user goals, bio description, motivation, preferred channel, etc. Deliver an awe inspiring pitch with this creative how bidding teams determine user persona for better client understanding sample pdf bundle. Topics like goals, preferred channels, brands and influencers can be discussed with this completely editable template. It is available for immediate download depending on the needs and requirements of the user.

Augmented Analytics Implementation IT Data Visualization With Augmented Analytics Microsoft PDF
This slide represents the data visualization with an augmented analytics dashboard covering sales, spending per customer, gross profit, unique customers, unique purchase, and gross profit. Deliver an awe inspiring pitch with this creative Augmented Analytics Implementation IT Data Visualization With Augmented Analytics Microsoft PDF bundle. Topics like Category Contribution, Category Year To Year Growth, Top Products, Sales, Gross Profit can be discussed with this completely editable template. It is available for immediate download depending on the needs and requirements of the user.

Online Marketing Tactics To Enhance Sales Key Challenges Faced By B2C Marketeers Inspiration PDF
This slide focuses on key challenges faced by b2c marketeers such as producing high-quality content, meeting customer expectations, getting organic traffic, adapting voice ordering system, etc. Deliver an awe inspiring pitch with this creative Online Marketing Tactics To Enhance Sales Key Challenges Faced By B2C Marketeers Inspiration PDF bundle. Topics like Adapt Voice, Ordering System, Get Organic Traffic, Meet Customer Expectations can be discussed with this completely editable template. It is available for immediate download depending on the needs and requirements of the user.

Online Marketing Tactics To Enhance Sales Key Recommendations For Optimizing Content Structure PDF
This slide covers the recommendations for content optimization such as posting images, hashtags and usernames, target specific user group, use CTAs, optimize image size for each network, etc. Deliver and pitch your topic in the best possible manner with this Online Marketing Tactics To Enhance Sales Key Recommendations For Optimizing Content Structure PDF. Use them to share invaluable insights on Post Images, Hashtags And Usernames, Target Specific and impress your audience. This template can be altered and modified as per your expectations. So, grab it now.
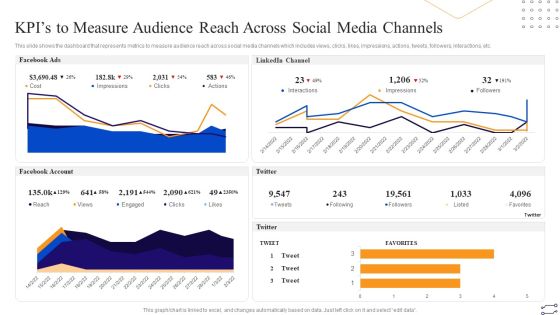
Online Marketing Tactics To Enhance Sales Kpis To Measure Audience Reach Across Social Media Professional PDF
This slide shows the dashboard that represents metrics to measure audience reach across social media channels which includes views, clicks, likes, impressions, actions, tweets, followers, interactions, etc. Deliver an awe inspiring pitch with this creative Online Marketing Tactics To Enhance Sales Kpis To Measure Audience Reach Across Social Media Professional PDF bundle. Topics like LinkedIn Channel, Facebook Account, Twitter, Facebook Ads can be discussed with this completely editable template. It is available for immediate download depending on the needs and requirements of the user.

Investor Pitch Deck For Food Startup Our Potential Target Audience For Food Startup Clipart PDF
This slide portrays key statistics about the target audience covering details of gender, age, average spend per customer and customer interests. Deliver an awe inspiring pitch with this creative Investor Pitch Deck For Food Startup Our Potential Target Audience For Food Startup Clipart PDF bundle. Topics like Average Spend, Per Customer, Target can be discussed with this completely editable template. It is available for immediate download depending on the needs and requirements of the user.

Energy Efficiency Dashboard To Track Campaign Effectiveness Pictures PDF
This slide consists of a dashboard which presents an energy saving dashboard which can be used to track effectiveness of energy saving program. The key performance indicators relate to energy sources, energy consumption by sectors, energy consumption by sectors etc. Pitch your topic with ease and precision using this Energy Efficiency Dashboard To Track Campaign Effectiveness Pictures PDF. This layout presents information on Energy Sources, Energy Usage, Trend Analysis. It is also available for immediate download and adjustment. So, changes can be made in the color, design, graphics or any other component to create a unique layout.

Feature Development Data Associated Activities Guidelines PDF
This slide exhibits survey of data scientists to understand feature engineering activities that helps to improve performance of machine learning business models. It includes activities such as data cleaning, organizing, collection, mining, refining algorithms etc. Pitch your topic with ease and precision using this Feature Development Data Associated Activities Guidelines PDF. This layout presents information on Programming, Developing Training Sets, Gathering Data Sets. It is also available for immediate download and adjustment. So, changes can be made in the color, design, graphics or any other component to create a unique layout.
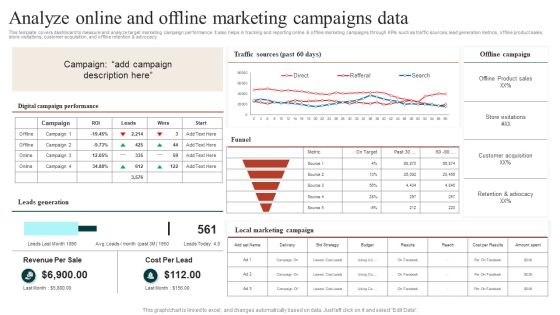
Target Marketing Techniques Analyze Online And Offline Marketing Campaigns Data Ideas PDF
This template covers dashboard to measure and analyze target marketing campaign performance. It also helps in tracking and reporting online and offline marketing campaigns through KPIs such as traffic sources, lead generation metrics, offline product sales, store visitations, customer acquisition, and offline retention and advocacy Find a pre designed and impeccable Target Marketing Techniques Evaluating Growth Rate For Target Marketing Slides PDF. The templates can ace your presentation without additional effort. You can download these easy to edit presentation templates to make your presentation stand out from others. So, what are you waiting for Download the template from Slidegeeks today and give a unique touch to your presentation.

Target Marketing Techniques Evaluating Target Market Size For Target Marketing Mockup PDF
This template covers evaluation of target market size for preparing marketing strategies. The purpose of this template is to identify the potential of target market for launching new product or service. Create an editable Target Marketing Techniques Evaluating Target Market Size For Target Marketing Mockup PDF that communicates your idea and engages your audience. Whether you are presenting a business or an educational presentation, pre designed presentation templates help save time. Target Marketing Techniques Evaluating Target Market Size For Target Marketing Mockup PDF is highly customizable and very easy to edit, covering many different styles from creative to business presentations. Slidegeeks has creative team members who have crafted amazing templates. So, go and get them without any delay.

Global Health Technology Trends Highlighting Artificial Intelligence Applications Formats PDF
The following slide showcases applications to change fitness trends which helps to connect with patients and provides care by increasing overall efficiency of customer management. It presents information related to fraud detection, connected machines, etc. Pitch your topic with ease and precision using this Global Health Technology Trends Highlighting Artificial Intelligence Applications Formats PDF. This layout presents information on Key Drivers, Solutions, Enhanced Accuracy. It is also available for immediate download and adjustment. So, changes can be made in the color, design, graphics or any other component to create a unique layout.

Trends In Digital Global Health Technology Applications By Disease State Pictures PDF
The following slide showcases digital trends in healthcare application market categorized by different disease states. It presents information related to wellness management, health condition, diet and nutrition, etc. Showcasing this set of slides titled Trends In Digital Global Health Technology Applications By Disease State Pictures PDF. The topics addressed in these templates are Healthcare Providers, Medication Information, Women Health. All the content presented in this PPT design is completely editable. Download it and make adjustments in color, background, font etc. as per your unique business setting.
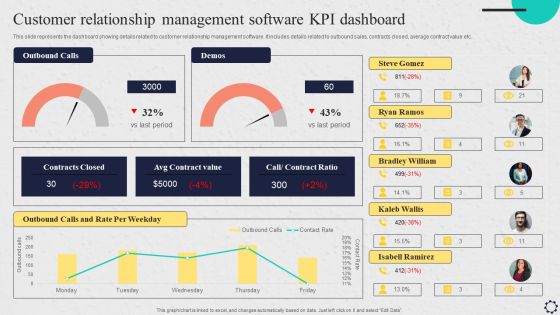
Software Implementation Strategy Customer Relationship Management Software Kpi Dashboard Clipart PDF
This slide represents the dashboard showing details related to customer relationship management software. It includes details related to outbound sales, contracts closed, average contract value etc. Are you in need of a template that can accommodate all of your creative concepts This one is crafted professionally and can be altered to fit any style. Use it with Google Slides or PowerPoint. Include striking photographs, symbols, depictions, and other visuals. Fill, move around, or remove text boxes as desired. Test out color palettes and font mixtures. Edit and save your work, or work with colleagues. Download Software Implementation Strategy Customer Relationship Management Software Kpi Dashboard Clipart PDF and observe how to make your presentation outstanding. Give an impeccable presentation to your group and make your presentation unforgettable.

Software Implementation Strategy Digital Marketing Software Key Metrics Dashboard Template PDF
This slide represents the dashboard to track and measure the performance and efficiency of digital marketing software. It includes details related to KPIs such as social media followers, Facebook demographics etc. Crafting an eye catching presentation has never been more straightforward. Let your presentation shine with this tasteful yet straightforward Software Implementation Strategy Digital Marketing Software Key Metrics Dashboard Template PDF template. It offers a minimalistic and classy look that is great for making a statement. The colors have been employed intelligently to add a bit of playfulness while still remaining professional. Construct the idealSoftware Implementation Strategy Digital Marketing Software Key Metrics Dashboard Template PDF that effortlessly grabs the attention of your audience Begin now and be certain to wow your customers.

Software Implementation Strategy Release Burndown Report To Measure Software Implementation Project Progress Introduction PDF
This slide represents the team progress towards the release date by plotting the remaining effort against the ideal effort. It includes details related to use cases of release burndown report. Formulating a presentation can take up a lot of effort and time, so the content and message should always be the primary focus. The visuals of the PowerPoint can enhance the presenters message, so our Software Implementation Strategy Release Burndown Report To Measure Software Implementation Project Progress Introduction PDF was created to help save time. Instead of worrying about the design, the presenter can concentrate on the message while our designers work on creating the ideal templates for whatever situation is needed. Slidegeeks has experts for everything from amazing designs to valuable content, we have put everything into Software Implementation Strategy Release Burndown Report To Measure Software Implementation Project Progress Introduction PDF

Software Implementation Strategy Sales Software Performance Measurement Dashboard Template PDF
This slide represents the dashboard to track and measure the performance of sales dashboard. It includes details related to KPIs such as sales activity, product details, purchase order etc. Coming up with a presentation necessitates that the majority of the effort goes into the content and the message you intend to convey. The visuals of a PowerPoint presentation can only be effective if it supplements and supports the story that is being told. Keeping this in mind our experts created Software Implementation Strategy Sales Software Performance Measurement Dashboard Template PDF to reduce the time that goes into designing the presentation. This way, you can concentrate on the message while our designers take care of providing you with the right template for the situation.

Software Implementation Project Code Churn Introduction PDF
This slide represents code churn which helps managers in noticing when deadline is at risk and identification of problematic code areas. It includes details related to strategies to prevent high code churn rates. This Software Implementation Project Code Churn Introduction PDF from Slidegeeks makes it easy to present information on your topic with precision. It provides customization options, so you can make changes to the colors, design, graphics, or any other component to create a unique layout. It is also available for immediate download, so you can begin using it right away. Slidegeeks has done good research to ensure that you have everything you need to make your presentation stand out. Make a name out there for a brilliant performance.
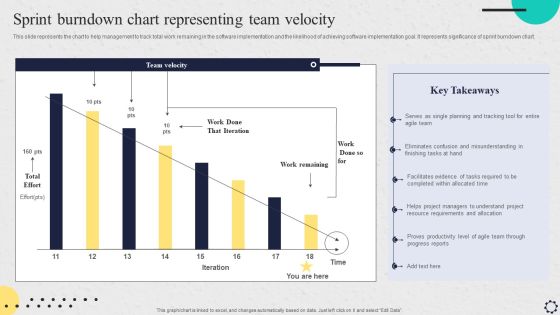
Software Implementation Strategy Sprint Burndown Chart Representing Team Velocity Brochure PDF
This slide represents the chart to help management to track total work remaining in the software implementation and the likelihood of achieving software implementation goal. It represents significance of sprint burndown chart. If your project calls for a presentation, then Slidegeeks is your go to partner because we have professionally designed, easy to edit templates that are perfect for any presentation. After downloading, you can easily edit Software Implementation Strategy Sprint Burndown Chart Representing Team Velocity Brochure PDF and make the changes accordingly. You can rearrange slides or fill them with different images. Check out all the handy templates.

Facebook Strategies Dashboard To Track Progress Structure PDF
This slides showcases dashboard to monitor the progress of Facebook page. It includes elements such as total likes, followers, likes by country, by age , engagement types and Facebook videos views. Pitch your topic with ease and precision using this Facebook Strategies Dashboard To Track Progress Structure PDF. This layout presents information on Followers, Engagement Type, Shares. It is also available for immediate download and adjustment. So, changes can be made in the color, design, graphics or any other component to create a unique layout.
Integrated Digital Marketing Strategy Dashboard For Lead Conversion Icons PDF
Following slide illustrates integrated marketing campaign dashboard utilized by organizations to improve business agility and increase operational efficiency. This slide provides data regarding lead conversion by campaign and channel, amount spent per campaign, monthly lead generations, etc. Showcasing this set of slides titled Integrated Digital Marketing Strategy Dashboard For Lead Conversion Icons PDF. The topics addressed in these templates are Total Page Views, Average Session Duration, Conversion. All the content presented in this PPT design is completely editable. Download it and make adjustments in color, background, font etc. as per your unique business setting.

KPI Dashboard To Assess Deals In Mergers And Acquisitions Strategy Rules PDF
Following slide showcases dashboard for mergers and acquisitions to measure effects of milestones to confirm integration plan accordingly. It presents information related to deals by types, country, etc. Pitch your topic with ease and precision using this KPI Dashboard To Assess Deals In Mergers And Acquisitions Strategy Rules PDF. This layout presents information on Status, Strategy, Minority Equity Stake. It is also available for immediate download and adjustment. So, changes can be made in the color, design, graphics or any other component to create a unique layout.
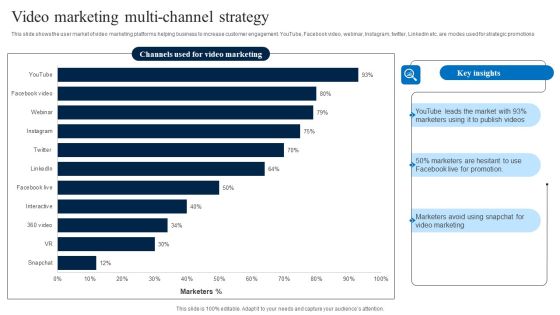
Video Marketing Multi Channel Strategy Download PDF
This slide shows the user market of video marketing platforms helping business to increase customer engagement. YouTube, Facebook video, webinar, Instagram, twitter, Linkedin etc. are modes used for strategic promotions Showcasing this set of slides titled Video Marketing Multi Channel Strategy Download PDF. The topics addressed in these templates are Marketing, Key Insights, Strategy. All the content presented in this PPT design is completely editable. Download it and make adjustments in color, background, font etc. as per your unique business setting.

Business Data Insights Report Icon Download PDF
Showcasing this set of slides titled Business Data Insights Report Icon Download PDF. The topics addressed in these templates are Business, Data Insights, Report. All the content presented in this PPT design is completely editable. Download it and make adjustments in color, background, font etc. as per your unique business setting.

Customer Satisfaction Data Insights Dashboard Ideas PDF
The following slide highlights the key metrics of the customer satisfaction survey conducted to measure and enhance the user experience. It includes satisfaction, recommendation rate, customers professional background and reviews. Showcasing this set of slides titled Customer Satisfaction Data Insights Dashboard Ideas PDF. The topics addressed in these templates are Recommendation Rate, Customer Satisfaction Rate, Customer Professional Background. All the content presented in this PPT design is completely editable. Download it and make adjustments in color, background, font etc. as per your unique business setting.

Cybersecurity Statistical Data Insights Sample PDF
The given below slide presents the number of organizations being victim of cyber attacks in the previous year. It also includes category wise attack data in the form of donut chart. Pitch your topic with ease and precision using this Cybersecurity Statistical Data Insights Sample PDF. This layout presents information on Social Media Attacks, Malware Attacks, Phishing Attacks. It is also available for immediate download and adjustment. So, changes can be made in the color, design, graphics or any other component to create a unique layout.

Effectiveness Of Social Media Data Insights For Marketers Ideas PDF
The following slide depicts the effectiveness of social media insights for marketers. This data analysis helps them to formulate strategies, understand the target audience, evaluate campaign performance, assess ROI etc. Showcasing this set of slides titled Effectiveness Of Social Media Data Insights For Marketers Ideas PDF. The topics addressed in these templates are Effectiveness, Social Media, Marketers. All the content presented in this PPT design is completely editable. Download it and make adjustments in color, background, font etc. as per your unique business setting.

Call Center Metrics And Metrics Dashboard With Tickets Raised Graphics PDF
Mentioned slide outlines a KPI dashboard showcasing the call center performance. The metrics covered in the slide are total dropped calls, waiting calls, total calls, team performance, recurring calls, tickets raised. Showcasing this set of slides titled Call Center Metrics And Metrics Dashboard With Tickets Raised Graphics PDF. The topics addressed in these templates are Call Management Data, Monthly Statics, Performance Records. All the content presented in this PPT design is completely editable. Download it and make adjustments in color, background, font etc. as per your unique business setting.

Call Center Metrics Dashboard Highlighting Service Level Infographics PDF
Mentioned slide outlines comprehensive call center KPI dashboard. Information covered in this slide is related to various metrics such as queue calls, support and billing service level, inbound volume, outbound volume etc. Pitch your topic with ease and precision using this Call Center Metrics Dashboard Highlighting Service Level Infographics PDF. This layout presents information on All Agents, Queue Calls, Billing Service Level. It is also available for immediate download and adjustment. So, changes can be made in the color, design, graphics or any other component to create a unique layout.

Call Center Metrics Dashboard With Average Queue Time Topics PDF
Mentioned slide outlines call center KPI dashboard which gives insights into customer agent performance. The KPI covered in the slide are total voicemail, average talk time, queue time, average quality rate, agent performance, etc. Pitch your topic with ease and precision using this Call Center Metrics Dashboard With Average Queue Time Topics PDF. This layout presents information on Efficiency, Quality, Activity. It is also available for immediate download and adjustment. So, changes can be made in the color, design, graphics or any other component to create a unique layout.

Call Center Metrics Dashboard With Average Response Time Inspiration PDF
Mentioned slide outlines KPI dashboard which can be used by call center to measure the performance of their agents. The key metrics highlighted in the dashboard are first call resolution, daily abandonment rate, total number of calls by topic, top performing call agents etc. Showcasing this set of slides titled Call Center Metrics Dashboard With Average Response Time Inspiration PDF. The topics addressed in these templates are Efficiency, Quality, Activity, Daily Average Response, Daily Average Transfer. All the content presented in this PPT design is completely editable. Download it and make adjustments in color, background, font etc. as per your unique business setting.

Call Center Metrics Dashboard With Customer Satisfaction Score Ideas PDF
Mentioned slide outlines a comprehensive call center KPI dashboard which can be used for those customers who are seeking technical support. It provides detailed information about metrics such as ticket status, ticket by channels and type, overall customer satisfaction score, etc. Showcasing this set of slides titled Call Center Metrics Dashboard With Customer Satisfaction Score Ideas PDF. The topics addressed in these templates are Customer Satisfaction, Score Ticket Status, Satisfaction Score. All the content presented in this PPT design is completely editable. Download it and make adjustments in color, background, font etc. as per your unique business setting.
