Capital Investment

Analyze Results Ppt PowerPoint Presentation Guide
This is a analyze results ppt powerpoint presentation guide. This is a three stage process. The stages in this process are icon, percentage, finance, man, present.
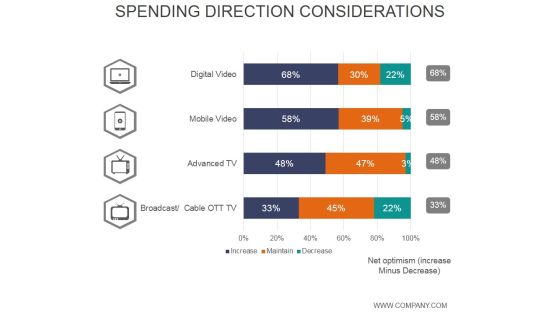
Spending Direction Considerations Ppt PowerPoint Presentation Images
This is a spending direction considerations ppt powerpoint presentation images. This is a four stage process. The stages in this process are percentage, finance, business, marketing, strategy.

Bar Graph Ppt PowerPoint Presentation Model
This is a bar graph ppt powerpoint presentation model. This is a five stage process. The stages in this process are business, marketing, bar slides, management, finance.
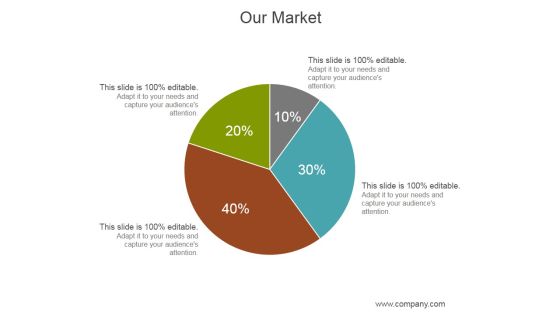
Our Market Ppt PowerPoint Presentation Deck
This is a our market ppt powerpoint presentation deck. This is a four stage process. The stages in this process are business, marketing, management, finance, analysis.

Business Model Ppt PowerPoint Presentation Graphics
This is a business model ppt powerpoint presentation graphics. This is a three stage process. The stages in this process are business, marketing, management, finance, analysis.

Competitive Analysis Ppt PowerPoint Presentation Background Images
This is a competitive analysis ppt powerpoint presentation background images. This is a six stage process. The stages in this process are business, marketing, management, analysis, finance.

Marketing Dashboard Ppt PowerPoint Presentation Templates
This is a marketing dashboard ppt powerpoint presentation templates. This is a two stage process. The stages in this process are business, marketing, management, finance, dashboard.

Our Channel Sales Numbers Ppt PowerPoint Presentation Pictures
This is a our channel sales numbers ppt powerpoint presentation pictures. This is a four stage process. The stages in this process are business, marketing, management, finance, planning.
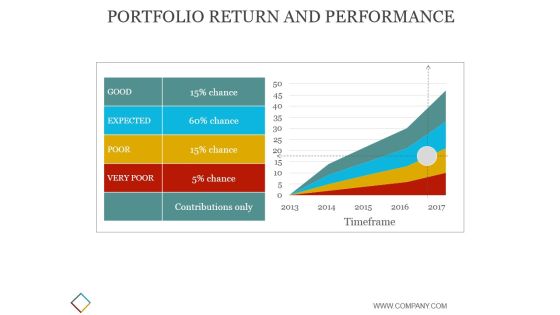
Portfolio Return And Performance Ppt PowerPoint Presentation Slides
This is a portfolio return and performance ppt powerpoint presentation slides. This is a two stage process. The stages in this process are business, strategy, marketing, analysis, finance.
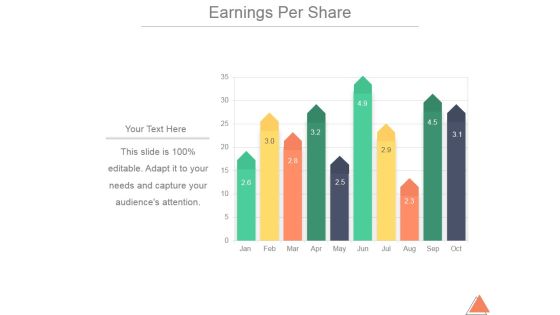
Earnings Per Share Ppt PowerPoint Presentation Pictures
This is a earnings per share ppt powerpoint presentation pictures. This is a one stage process. The stages in this process are business, marketing, finance, management, earning.

Ebitda Highlights Ppt PowerPoint Presentation Graphics
This is a ebitda highlights ppt powerpoint presentation graphics. This is a five stage process. The stages in this process are business, marketing, finance, management, growth.
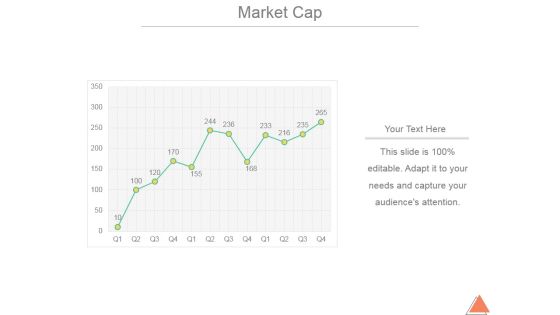
Market Cap Ppt PowerPoint Presentation Outline
This is a market cap ppt powerpoint presentation outline. This is a one stage process. The stages in this process are business, marketing, finance, management, analysis.

Security Analysis Ppt PowerPoint Presentation Background Image
This is a security analysis ppt powerpoint presentation background image. This is a two stage process. The stages in this process are business, analysis, strategic, finance, management.

Bar Graph Ppt PowerPoint Presentation Examples
This is a bar graph ppt powerpoint presentation examples. This is a three stage process. The stages in this process are business, strategy, marketing, analysis, finance, bar graph.

Sales Highlights Ppt PowerPoint Presentation Deck
This is a sales highlights ppt powerpoint presentation deck. This is a five stage process. The stages in this process are business, marketing, management, finance, strategy.

Stacked Bar Ppt PowerPoint Presentation Graphics
This is a stacked bar ppt powerpoint presentation graphics. This is a four stage process. The stages in this process are stacked bar, finance, marketing, analysis, business.

Stacked Column Ppt PowerPoint Presentation Files
This is a stacked column ppt powerpoint presentation files. This is a nine stage process. The stages in this process are bar graph, finance, marketing, analysis, business.

Bar Graph Ppt PowerPoint Presentation Guide
This is a bar graph ppt powerpoint presentation guide. This is a five stage process. The stages in this process are bar graph, finance, marketing, analysis, strategy, business.

Area Chart Ppt PowerPoint Presentation Graphics
This is a area chart ppt powerpoint presentation graphics. This is a two stage process. The stages in this process are business, marketing, management, product, finance.

Bar Chart Ppt PowerPoint Presentation Deck
This is a bar chart ppt powerpoint presentation deck. This is a four stage process. The stages in this process are business, marketing, management, bar chart, finance.

Pareto Chart Ppt PowerPoint Presentation Ideas
This is a pareto chart ppt powerpoint presentation ideas. This is a four stage process. The stages in this process are bar graph, finance, marketing, strategy, analysis, business.

Bar Graph Ppt PowerPoint Presentation Microsoft
This is a bar graph ppt powerpoint presentation microsoft. This is a five stage process. The stages in this process are bar graph, finance, marketing, strategy, analysis, business.
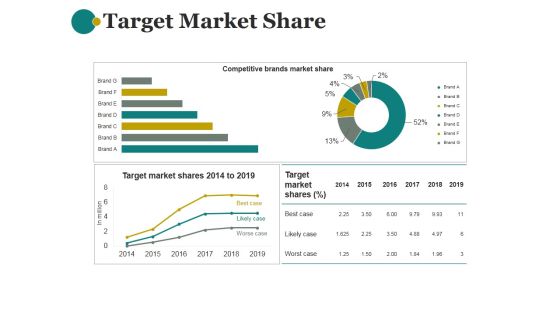
Target Market Share Ppt PowerPoint Presentation Introduction
This is a target market share ppt powerpoint presentation introduction. This is a four stage process. The stages in this process are finance, marketing, planning ,business, management, strategy.

Clustered Column Ppt PowerPoint Presentation Images
This is a clustered column ppt powerpoint presentation images. This is a twelve stage process. The stages in this process are business, marketing, finance, growth, timeline.

Clustered Column Ppt PowerPoint Presentation Backgrounds
This is a clustered column ppt powerpoint presentation backgrounds. This is a two stage process. The stages in this process are business, marketing, finance, compare, management.

Combo Chart Template 1 Ppt PowerPoint Presentation Themes
This is a combo chart template 1 ppt powerpoint presentation themes. This is a four stage process. The stages in this process are business, marketing, finance, timeline, management.

Combo Chart Template 2 Ppt PowerPoint Presentation Graphics
This is a combo chart template 2 ppt powerpoint presentation graphics. This is a three stage process. The stages in this process are business, marketing, finance, growth, management.

Bubble Chart Ppt PowerPoint Presentation Slide
This is a bubble chart ppt powerpoint presentation slide. This is a eight stage process. The stages in this process are business, marketing, finance, chart, management.

Combo Chart Template 1 Ppt PowerPoint Presentation Inspiration
This is a combo chart template 1 ppt powerpoint presentation inspiration. This is a four stage process. The stages in this process are business, marketing, growth, product, finance.

Line Chart Ppt PowerPoint Presentation Summary Portfolio
This is a line chart ppt powerpoint presentation summary portfolio. This is a eight stage process. The stages in this process are finance, planning, management, business, process, strategy.
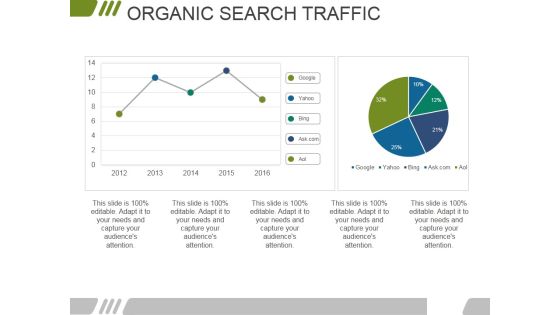
Organic Search Traffic Ppt PowerPoint Presentation Model Slideshow
This is a organic search traffic ppt powerpoint presentation model slideshow. This is a two stage process. The stages in this process are business, marketing, finance, management, organic.

Bar Graph Ppt PowerPoint Presentation Layouts Good
This is a bar graph ppt powerpoint presentation layouts good. This is a two stage process. The stages in this process are bar graph, finance, success, strategy, management.

Clustered Column Ppt PowerPoint Presentation Summary Topics
This is a clustered column ppt powerpoint presentation summary topics. This is a two stage process. The stages in this process are bar, graph, finance, marketing, strategy.
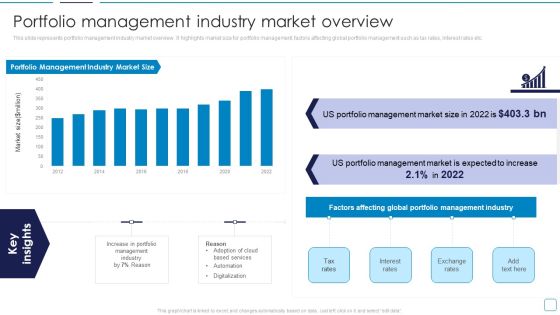
Portfolio Wealth Management Portfolio Management Industry Market Overview Download PDF
This slide represents portfolio management industry market overview. It highlights market size for portfolio management, factors affecting global portfolio management such as tax rates, interest rates etc. Deliver an awe inspiring pitch with this creative Portfolio Wealth Management Portfolio Management Industry Market Overview Download PDF bundle. Topics like Portfolio Management, Market Size, Tax Rates can be discussed with this completely editable template. It is available for immediate download depending on the needs and requirements of the user.

How Aviation Industry Coping With COVID 19 Pandemic Global Revenue Passenger Kilometers Forecast Post COVID Infographics PDF
This slide illustrates the forecasting of global airlines revenue passenger kilometers post coronavirus. It also shows the stats of Pre-COVID forecast, current baseline and COVID setback scenario.Deliver and pitch your topic in the best possible manner with this how aviation industry coping with COVID 19 pandemic global revenue passenger kilometers forecast post COVID infographics pdf. Use them to share invaluable insights on forecasted global, 2012 to 2025 and impress your audience. This template can be altered and modified as per your expectations. So, grab it now.
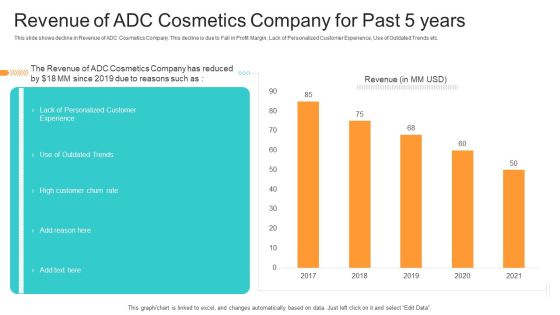
Utilization Of Current Techniques To Improve Efficiency Case Competition Revenue Of ADC Cosmetics Company For Past 5 Years Brochure PDF
This slide shows decline in Revenue of ADC Cosmetics Company. This decline is due to Fall in Profit Margin, Lack of Personalized Customer Experience, Use of Outdated Trends etc. Deliver an awe-inspiring pitch with this creative utilization of current techniques to improve efficiency case competition revenue of adc cosmetics company for past 5 years brochure pdf bundle. Topics like lack of personalized customer experience, high customer churn rate, use of outdated trends can be discussed with this completely editable template. It is available for immediate download depending on the needs and requirements of the user.

Competitive Sales Strategy Development Plan For Revenue Growth Effect On Sales Volume And Cycle Length Clipart PDF
This slide focuses on effect of competitive sales strategy on sales volume and sales cycle length time that will directly impact company revenue. Deliver and pitch your topic in the best possible manner with this Competitive Sales Strategy Development Plan For Revenue Growth Effect On Sales Volume And Cycle Length Clipart PDF. Use them to share invaluable insights on Implementation, Customer Centric Strategies, Optimizing Sales Process and impress your audience. This template can be altered and modified as per your expectations. So, grab it now.
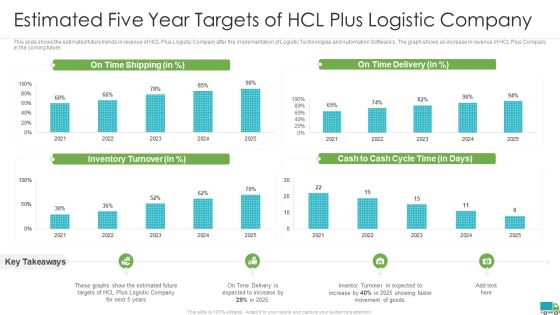
Generating Logistics Value Business Estimated Five Year Targets Of Hcl Plus Logistic Company Inspiration PDF
This slide shows the estimated future trends in revenue of HCL Plus Logistic Company after the implementation of Logistic Technologies and Automation Softwares. The graph shows an increase in revenue of HCL Plus Company in the coming future. Deliver an awe inspiring pitch with this creative generating logistics value business estimated five year targets of hcl plus logistic company inspiration pdf bundle. Topics like latest logistic technologies, estimated implementation costs involved, enhanced gps systems can be discussed with this completely editable template. It is available for immediate download depending on the needs and requirements of the user.

Customer Lifetime Value Based Success KPIS Dashboard Ppt PowerPoint Presentation Layouts Gridlines PDF
This slide covers dashboard for estimation of customer lifetime value as success metrics. It includes KPIs such as customer lifetime value, customer lifetime period, customer risk, customer contact rate, customer retention costs, average lifetime value, customer churn rate, average revenue per account, etc. Pitch your topic with ease and precision using this Customer Lifetime Value Based Success KPIS Dashboard Ppt PowerPoint Presentation Layouts Gridlines PDF. This layout presents information on Average Revenue, Customer Lifetime, Customer Risk. It is also available for immediate download and adjustment. So, changes can be made in the color, design, graphics or any other component to create a unique layout.
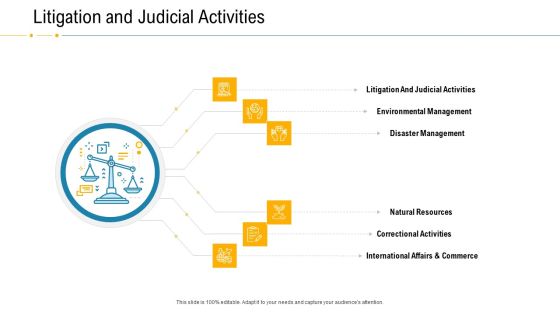
Financial Due Diligence For Business Organization Litigation And Judicial Activities Ideas PDF
This is a financial due diligence for business organization litigation and judicial activities ideas pdf template with various stages. Focus and dispense information on six stages using this creative set, that comes with editable features. It contains large content boxes to add your information on topics like international affairs and commerce, correctional activities, natural resources, disaster management, environmental management. You can also showcase facts, figures, and other relevant content using this PPT layout. Grab it now.
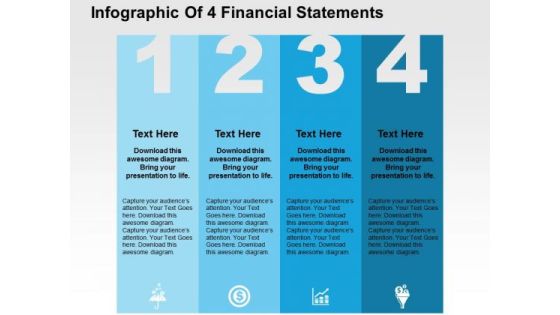
Infographic Of 4 Financial Statements PowerPoint Template
Four financial statements can be displayed in this business diagram. This slide contains the graphic of four text boxes with icons Use this editable slide to build quality presentation for your viewers.

IOT Industry Assessment Sales Performance Dashboard Ppt Model Layout Ideas PDF
This slide illustrates sales performance dashboard. It covers sales revenue, sales growth, average revenue per unit, customer lifetime value and customer acquisition cost. Deliver and pitch your topic in the best possible manner with this iot industry assessment sales performance dashboard ppt model layout ideas pdf. Use them to share invaluable insights on sales, revenue, performance, growth and impress your audience. This template can be altered and modified as per your expectations. So, grab it now.

Establishing Successful Brand Strategy To Captivate Consumers Business Performance Dashboard Microsoft PDF
Following slide covers business performance dashboard of the firm. It include KPIs such as average weekly sales revenue, above sales target, sales revenue and profit generated. Deliver an awe inspiring pitch with this creative establishing successful brand strategy to captivate consumers business performance dashboard microsoft pdf bundle. Topics like customer acquisition cost, customer lifetime value, average revenue per unit can be discussed with this completely editable template. It is available for immediate download depending on the needs and requirements of the user.
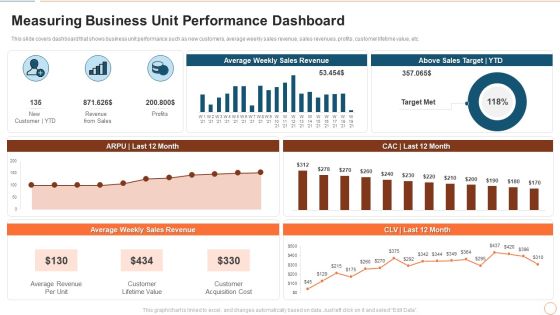
Illustrating Product Leadership Plan Incorporating Innovative Techniques Measuring Business Unit Professional PDF
This slide covers dashboard that shows business unit performance such as new customers, average weekly sales revenue, sales revenues, profits, customer lifetime value, etc. Deliver an awe inspiring pitch with this creative illustrating product leadership plan incorporating innovative techniques measuring business unit professional pdf bundle. Topics like average revenue per unit, customer lifetime value, customer acquisition cost can be discussed with this completely editable template. It is available for immediate download depending on the needs and requirements of the user.
Successful Brand Development Plan Business Performance Measuring KPI Dashboard Icons PDF
Following slide covers business performance dashboard of the firm. It include KPIs such as average weekly sales revenue, above sales target, sales revenue and profit generated.Deliver and pitch your topic in the best possible manner with this successful brand development plan business performance measuring kpi dashboard icons pdf Use them to share invaluable insights on average revenue, customer lifetime value, customer acquisition cost and impress your audience. This template can be altered and modified as per your expectations. So, grab it now.

Formulating Competitive Plan Of Action For Effective Product Leadership Measuring Business Unit Slides PDF
This slide covers dashboard that shows business unit performance such as new customers, average weekly sales revenue, sales revenues, profits, customer lifetime value, etc. Deliver an awe inspiring pitch with this creative formulating competitive plan of action for effective product leadership measuring business unit slides pdf bundle. Topics like average revenue per unit, customer lifetime value, customer acquisition cost can be discussed with this completely editable template. It is available for immediate download depending on the needs and requirements of the user.

Assuring Management In Product Innovation To Enhance Processes Measuring Business Unit Performance Dashboard Inspiration PDF
This slide covers dashboard that shows business unit performance such as new customers, average weekly sales revenue, sales revenues, profits, customer lifetime value, etc.Deliver an awe inspiring pitch with this creative assuring management in product innovation to enhance processes measuring business unit performance dashboard inspiration pdf bundle. Topics like average weekly sales revenue, customer lifetime value, customer acquisition cost can be discussed with this completely editable template. It is available for immediate download depending on the needs and requirements of the user.

Business Performance Dashboard Brand Techniques Structure Introduction PDF
Following slide covers business performance dashboard of the firm. It include KPIs such as average weekly sales revenue, above sales target, sales revenue and profit generated. Deliver an awe inspiring pitch with this creative business performance dashboard brand techniques structure introduction pdf bundle. Topics like average, revenue, sales, profit, cost can be discussed with this completely editable template. It is available for immediate download depending on the needs and requirements of the user.

Deliver Efficiency Innovation Measuring Business Unit Performance Dashboard Background PDF
This slide covers dashboard that shows business unit performance such as new customers, average weekly sales revenue, sales revenues, profits, customer lifetime value, etc. Deliver an awe inspiring pitch with this creative Deliver Efficiency Innovation Measuring Business Unit Performance Dashboard Background PDF bundle. Topics like Customer Lifetime Value, Customer Acquisition Cost, Average Revenue Per Unit, Above Sales Target YTD can be discussed with this completely editable template. It is available for immediate download depending on the needs and requirements of the user.

Effective Sales Technique For New Product Launch KPI Dashboard To Monitor Sales Performance Graphics PDF
This slide shows sales performance monitoring dashboard. Metrics included in the dashboard are sales revenue, sales growth, average revenue per unit, customer lifetime value and customer acquisition cost.Deliver an awe inspiring pitch with this creative Effective Sales Technique For New Product Launch KPI Dashboard To Monitor Sales Performance Graphics PDF bundle. Topics like Country Performance, Average Revenue, Customer Acquisition can be discussed with this completely editable template. It is available for immediate download depending on the needs and requirements of the user.
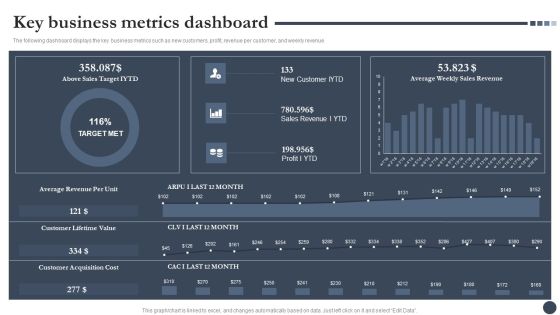
Strategic Playbook For Enterprise Administration Key Business Metrics Dashboard Pictures PDF
The following dashboard displays the key business metrics such as new customers, profit, revenue per customer, and weekly revenue. Deliver and pitch your topic in the best possible manner with this Strategic Playbook For Enterprise Administration Key Business Metrics Dashboard Pictures PDF. Use them to share invaluable insights on Average Revenue Per Unit, Customer Lifetime Value, Customer Acquisition Cost and impress your audience. This template can be altered and modified as per your expectations. So, grab it now.

Performance Strategic Analysis Dashboard For Tactical Management Rules PDF
This slide defines the dashboard for analyzing the sales key performance indicators KPIs. It includes information related to the number of sales, revenue, profit, and cost. Showcasing this set of slides titled Performance Strategic Analysis Dashboard For Tactical Management Rules PDF. The topics addressed in these templates are Revenue, New Customers, Average Revenue, Per Customer. All the content presented in this PPT design is completely editable. Download it and make adjustments in color, background, font etc. as per your unique business setting.

Cultural Integration In Company Companys Productivity And Revenue For 4 Years Ppt PowerPoint Presentation Visual Aids Portfolio PDF
Presenting this set of slides with name cultural integration in company companys productivity and revenue for 4 years ppt powerpoint presentation visual aids portfolio pdf. The topics discussed in these slides are key insights, year merger 2019, 2017 to 2020. This is a completely editable PowerPoint presentation and is available for immediate download. Download now and impress your audience.
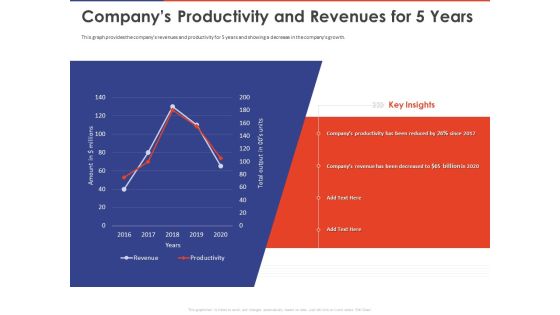
Key Prioritization Techniques For Project Team Management Companys Productivity And Revenues For 5 Years Ppt Outline PDF
Presenting this set of slides with name key prioritization techniques for project team management companys productivity and revenues for 5 years ppt outline pdf. The topics discussed in these slide is companys productivity. This is a completely editable PowerPoint presentation and is available for immediate download. Download now and impress your audience.
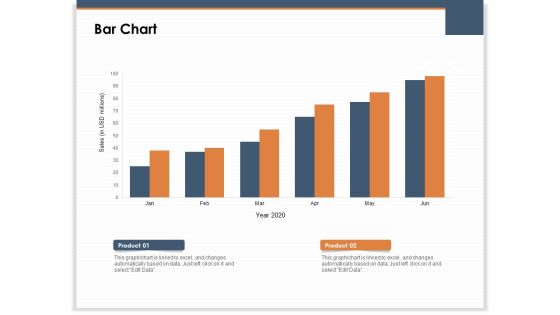
Main Revenues Progress Levers For Each Firm And Sector Bar Chart Ppt PowerPoint Presentation Gallery Skills PDF
Presenting this set of slides with name main revenues progress levers for each firm and sector bar chart ppt powerpoint presentation gallery skills pdf. The topics discussed in these slide is bar chart. This is a completely editable PowerPoint presentation and is available for immediate download. Download now and impress your audience.
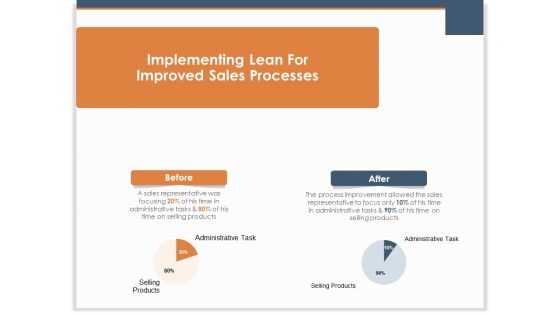
Main Revenues Progress Levers For Each Firm And Sector Implementing Lean For Improved Sales Processes Introduction PDF
Presenting this set of slides with name main revenues progress levers for each firm and sector implementing lean for improved sales processes introduction pdf. The topics discussed in these slides are administrative task, selling products, sales processes, implementing lean. This is a completely editable PowerPoint presentation and is available for immediate download. Download now and impress your audience.

Statistical Chart Showing Revenue From Export Of Tea And Coffee Ppt PowerPoint Presentation Gallery Background Image PDF
Presenting this set of slides with name statistical chart showing revenue from export of tea and coffee ppt powerpoint presentation gallery background image pdf. The topics discussed in these slides are export of tea, export of coffee. This is a completely editable PowerPoint presentation and is available for immediate download. Download now and impress your audience.

Online Merchandising Techniques Enhance Conversion Rate Digital Marketing Dashboard With Conversions And Revenue Growth Rate Elements PDF
Deliver and pitch your topic in the best possible manner with this online merchandising techniques enhance conversion rate digital marketing dashboard with conversions and revenue growth rate elements pdf. Use them to share invaluable insights on social media, website performance, conversion funnel, traffic sources and impress your audience. This template can be altered and modified as per your expectations. So, grab it now.

Revenue Streams Template 1 Ppt PowerPoint Presentation Ideas
This is a revenue streams template 1 ppt powerpoint presentation ideas. This is a six stage process. The stages in this process are recurring revenue frequency, pricing, estimated yearly revenue.
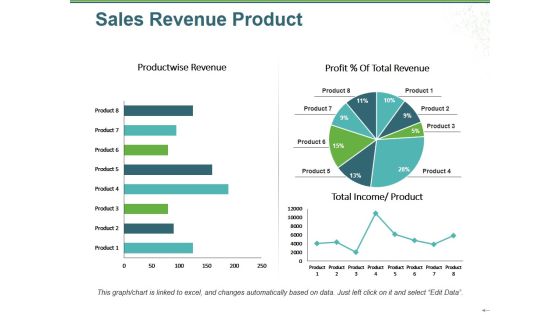
Sales Revenue Product Ppt PowerPoint Presentation Infographic Template Infographic Template
This is a sales revenue product ppt powerpoint presentation infographic template infographic template. This is a three stage process. The stages in this process are product wise revenue, total income, product, profit total revenue, pie.


 Continue with Email
 Sign up for an account
 Home
Home