Calendar

Horizontal Bar Graph With Profit Percentage Of Company Ppt PowerPoint Presentation Shapes
This is a horizontal bar graph with profit percentage of company ppt powerpoint presentation shapes. This is a five stage process. The stages in this process are business, strategy, marketing, analysis, slide bar, target.

Bar Graph For Financial Statements Ppt PowerPoint Presentation Example
This is a bar graph for financial statements ppt powerpoint presentation example. This is a four stage process. The stages in this process are product version, finance, year.

Mapping Your Competitive Position Ppt PowerPoint Presentation Files
This is a mapping your competitive position ppt powerpoint presentation files. This is a four stage process. The stages in this process are gaining market share, losing market share, company growth, average market growth.
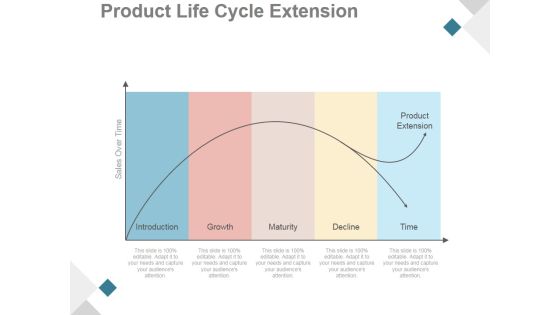
Product Life Cycle Extension Ppt PowerPoint Presentation Influencers
This is a product life cycle extension ppt powerpoint presentation influencers. This is a five stage process. The stages in this process are introduction, growth, maturity, decline, time, product extension, sales over time.
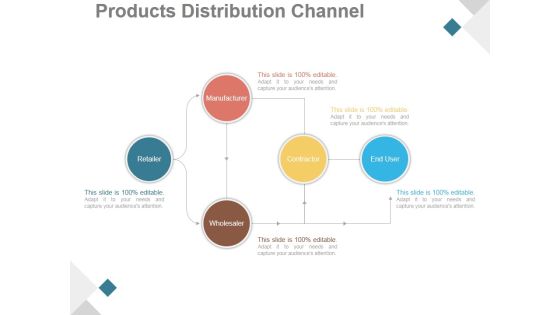
Products Distribution Channel Ppt PowerPoint Presentation Ideas
This is a products distribution channel ppt powerpoint presentation ideas. This is a five stage process. The stages in this process are retailer, manufacturer, wholesaler, contractor, end user.
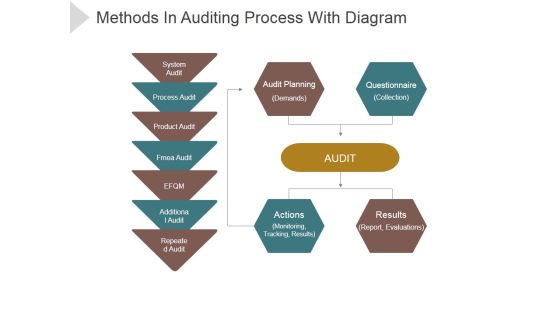
Methods In Auditing Process With Diagram Ppt PowerPoint Presentation Visual Aids
This is a methods in auditing process with diagram ppt powerpoint presentation visual aids. This is a four stage process. The stages in this process are system audit, process audit, product audit, fame audit, additional audit.
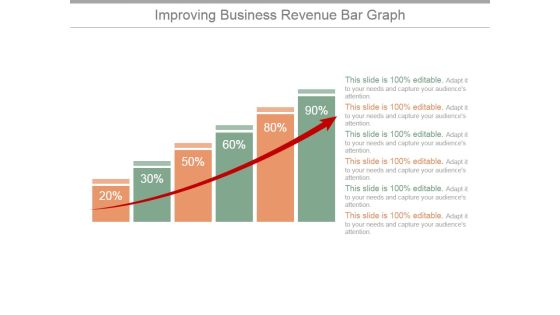
Improving Business Revenue Bar Graph Ppt PowerPoint Presentation Infographic Template
This is a improving business revenue bar graph ppt powerpoint presentation infographic template. This is a six stage process. The stages in this process are graph, arrow, finance, percentage, success.
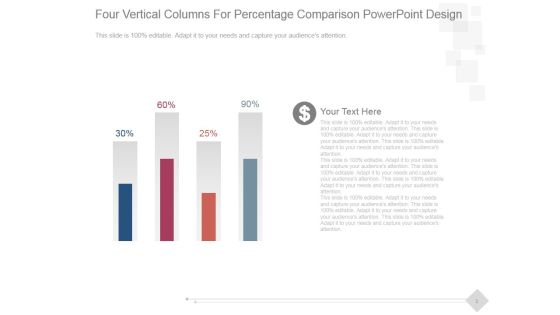
Four Vertical Columns For Percentage Comparison Ppt PowerPoint Presentation Introduction
This is a four vertical columns for percentage comparison ppt powerpoint presentation introduction. This is a four stage process. The stages in this process are business, marketing, success, management, presentation.

Competitors Analysis Marketing Report Ppt PowerPoint Presentation Tips
This is a competitors analysis marketing report ppt powerpoint presentation tips. This is a five stage process. The stages in this process are competitor, revenue, profit.
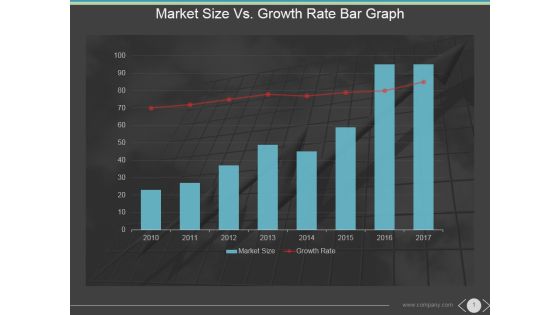
Market Size Vs Growth Rate Bar Graph Ppt PowerPoint Presentation Themes
This is a market size vs growth rate bar graph ppt powerpoint presentation themes. This is a eight stage process. The stages in this process are market size, growth rate, years, future, graph.

Comparing Organic Vs Paid Search Traffic Ppt PowerPoint Presentation Background Images
This is a comparing organic vs paid search traffic ppt powerpoint presentation background images. This is a four stage process. The stages in this process are all channels, organic search traffic, paid search traffic, avg session duration, pages session, bounce rate.

Performance Analysis Of Organic Visits And Backlinks Ppt PowerPoint Presentation Ideas
This is a performance analysis of organic visits and backlinks ppt powerpoint presentation ideas. This is a two stage process. The stages in this process are rank, domain authority, backlinks google, backlinks yahoo, google, bing.

Bar Graph Showing Business Success Ppt PowerPoint Presentation Inspiration
This is a bar graph showing business success ppt powerpoint presentation inspiration. This is a five stage process. The stages in this process are business, success, marketing, management, strategy.

Acquisition Cost Per Customer Ppt PowerPoint Presentation Example 2015
This is a acquisition cost per customer ppt powerpoint presentation example 2015. This is a three stage process. The stages in this process are rising, steady, falling.

Client Referrals Ppt PowerPoint Presentation Background Image
This is a client referrals ppt powerpoint presentation background image. This is a three stage process. The stages in this process are business, graph, marketing, presentation, management.

Crm Dashboard Leads By Source Ppt PowerPoint Presentation Example File
This is a crm dashboard leads by source ppt powerpoint presentation example file. This is a five stage process. The stages in this process are pie, division, finance, dashboard, percent.

Analyze Results Ppt PowerPoint Presentation Infographic Template
This is a analyze results ppt powerpoint presentation infographic template. This is a five stage process. The stages in this process are business, present, people, communication, management.

Cost For Quality Graph Ppt PowerPoint Presentation Graphics
This is a cost for quality graph ppt powerpoint presentation graphics. This is a four stage process. The stages in this process are external failure, internal failure, prevention, appraisal, quality improvement.

Email Marketing Performance Ppt PowerPoint Presentation Layouts
This is a email marketing performance ppt powerpoint presentation layouts. This is a four stage process. The stages in this process are delivery rate, open rate, click rate, conversion rate.

Competitor Analysis Graph Ppt PowerPoint Presentation Styles
This is a competitor analysis graph ppt powerpoint presentation styles. This is a five stage process. The stages in this process are graph, business, marketing, competitor.

Marketing Reach By Channels Ppt PowerPoint Presentation Rules
This is a marketing reach by channels ppt powerpoint presentation rules. This is a two stage process. The stages in this process are which marketing channel is growing fastest, influencer engagement use cases.

New Customer By Source Ppt PowerPoint Presentation Summary
This is a new customer by source ppt powerpoint presentation summary. This is a seven stage process. The stages in this process are events, direct mail, website, email, social.
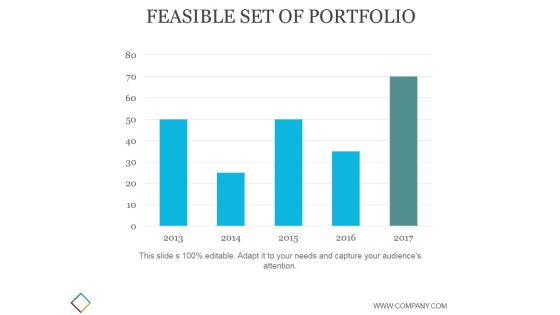
Feasible Set Of Portfolio Ppt PowerPoint Presentation Templates
This is a feasible set of portfolio ppt powerpoint presentation templates. This is a five stage process. The stages in this process are business, strategy, marketing, analysis, success, growth.

Bar Graph Ppt PowerPoint Presentation Examples
This is a bar graph ppt powerpoint presentation examples. This is a three stage process. The stages in this process are business, strategy, marketing, analysis, finance, bar graph.
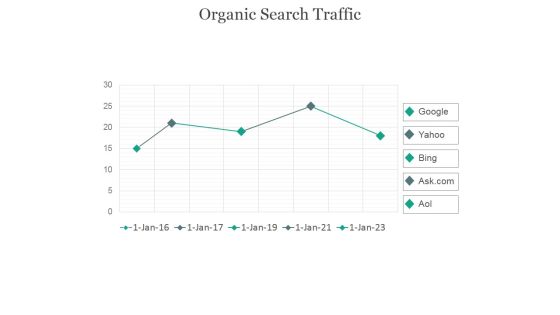
Organic Search Traffic Ppt PowerPoint Presentation Visuals
This is a organic search traffic ppt powerpoint presentation visuals. This is a five stage process. The stages in this process are google, yahoo, bing, aol, ask com.

Clustered Bar Ppt PowerPoint Presentation Ideas
This is a clustered bar ppt powerpoint presentation ideas. This is a five stage process. The stages in this process are bar graph, marketing, strategy, analysis, business, success.

Clustered Column Template 1 Ppt PowerPoint Presentation Inspiration
This is a clustered column template 1 ppt powerpoint presentation inspiration. This is a twelve stage process. The stages in this process are bar graph, marketing, strategy, analysis, business, success.

Clustered Column Template 2 Ppt PowerPoint Presentation Icon
This is a clustered column template 2 ppt powerpoint presentation icon. This is a two stage process. The stages in this process are bar graph, marketing, strategy, analysis, business, success.

Disaster Statistics Ppt PowerPoint Presentation Portfolio
This is a disaster statistics ppt powerpoint presentation portfolio. This is a seven stage process. The stages in this process are weather, geophysical, average.

Stacked Column Ppt PowerPoint Presentation Files
This is a stacked column ppt powerpoint presentation files. This is a nine stage process. The stages in this process are bar graph, finance, marketing, analysis, business.
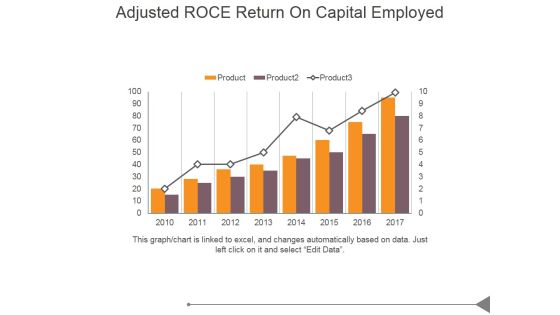
Adjusted Roce Return On Capital Employed Ppt PowerPoint Presentation Tips
This is a adjusted roce return on capital employed ppt powerpoint presentation tips. This is a eight stage process. The stages in this process are business, marketing, success, product, growth.

Capital Spending Ppt PowerPoint Presentation Graphics
This is a capital spending ppt powerpoint presentation graphics. This is a two stage process. The stages in this process are business, marketing, success, bar graph, management.

Competitive Analysis Ppt PowerPoint Presentation Sample
This is a competitive analysis ppt powerpoint presentation sample. This is a six stage process. The stages in this process are business, marketing, success, bar graph, management.

Distribution Growth Ppt PowerPoint Presentation Deck
This is a distribution growth ppt powerpoint presentation deck. This is a eight stage process. The stages in this process are business, marketing, success, product, growth.
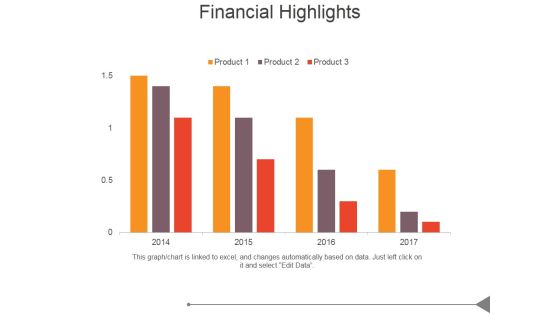
Financial Highlights Ppt PowerPoint Presentation Sample
This is a financial highlights ppt powerpoint presentation sample. This is a four stage process. The stages in this process are revenue, adjusted betide, recurring revenue, performance.
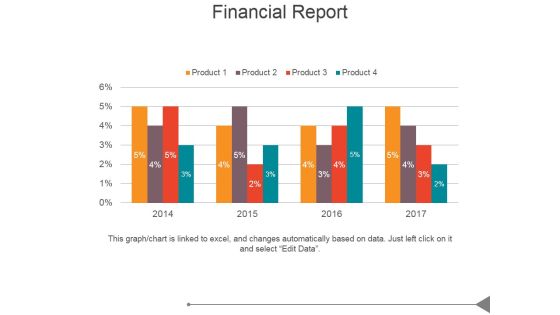
Financial Report Ppt PowerPoint Presentation Professional
This is a financial report ppt powerpoint presentation professional. This is a four stage process. The stages in this process are business, marketing, success, product, growth.

Real Estate Home Sales Ppt PowerPoint Presentation Pictures
This is a real estate home sales ppt powerpoint presentation pictures. This is a one stage process. The stages in this process are bar graph, business, marketing, success, management.
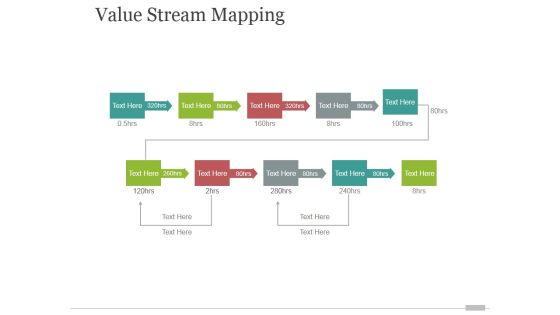
Value Stream Mapping Ppt PowerPoint Presentation Summary
This is a value stream mapping ppt powerpoint presentation summary. This is a eight stage process. The stages in this process are business, process, marketing, strategy, success.

Bar Graph Ppt PowerPoint Presentation Microsoft
This is a bar graph ppt powerpoint presentation microsoft. This is a five stage process. The stages in this process are bar graph, finance, marketing, strategy, analysis, business.
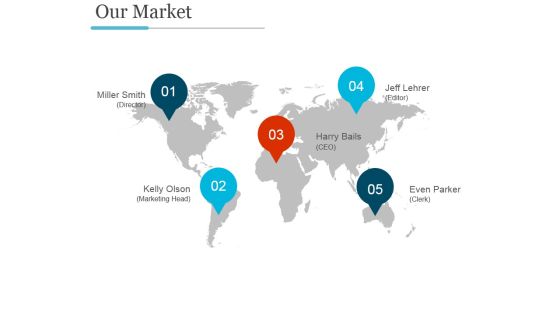
Our Market Template Ppt PowerPoint Presentation Design Templates
This is a our market template ppt powerpoint presentation design templates. This is a four stage process. The stages in this process are pie, percentage, finance, division, analysis.

Bar Graph Ppt PowerPoint Presentation Information
This is a bar graph ppt powerpoint presentation information. This is a five stage process. The stages in this process are finance, percentage, success, growth, bar graph.

Project Lifecycle Phases Template 2 Ppt PowerPoint Presentation Rules
This is a project lifecycle phases template 2 ppt powerpoint presentation rules. This is a five stage process. The stages in this process are conception phase, definition phase , organizing phase, implementation phase, termination phase.
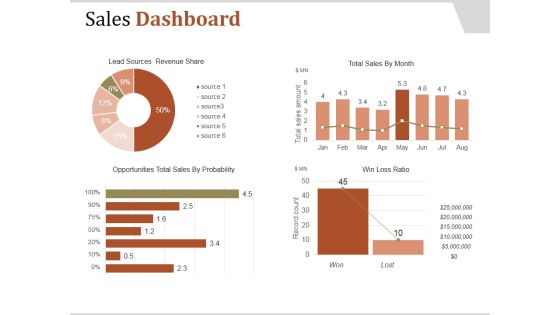
Sales Dashboard Template 2 Ppt PowerPoint Presentation Clipart
This is a sales dashboard template 2 ppt powerpoint presentation clipart. This is a four stage process. The stages in this process are lead sources revenue share, total sales by month, win loss ratio, opportunities total sales by probability.

Clustered Column Ppt PowerPoint Presentation Images
This is a clustered column ppt powerpoint presentation images. This is a twelve stage process. The stages in this process are business, marketing, finance, growth, timeline.
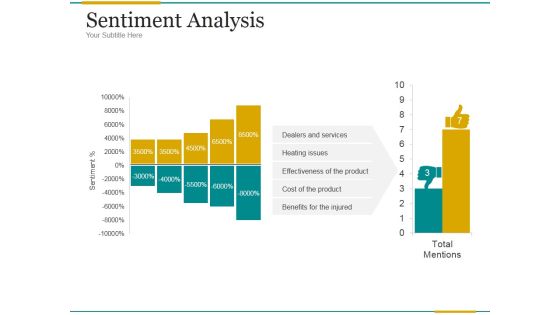
Sentiment Analysis Ppt PowerPoint Presentation Example File
This is a sentiment analysis ppt powerpoint presentation example file. This is a two stage process. The stages in this process are dealers and services, heating issues, effectiveness of the product, cost of the product, benefits for the injured.

Clustered Column Line Ppt PowerPoint Presentation Examples
This is a clustered column line ppt powerpoint presentation examples. This is a three stage process. The stages in this process are management, business, marketing, growth.

Clustered Column Ppt PowerPoint Presentation Picture
This is a clustered column ppt powerpoint presentation picture. This is a two stage process. The stages in this process are product, jan, feb, mar, apr.

Balance Sheet Kpis Ppt PowerPoint Presentation Professional
This is a balance sheet kpis ppt powerpoint presentation professional. This is a four stage process. The stages in this process are current assets, current liabilities, total assets, total liabilities.

Crm Dashboard Opportunity By Rating Ppt PowerPoint Presentation Model
This is a crm dashboard opportunity by rating ppt powerpoint presentation model. This is a three stage process. The stages in this process are open opportunity, cold, hot, warm.

Bar Graph Ppt PowerPoint Presentation Gallery Example Topics
This is a bar graph ppt powerpoint presentation gallery example topics. This is a four stage process. The stages in this process are business, strategy, marketing, analysis, finance, bar graph.
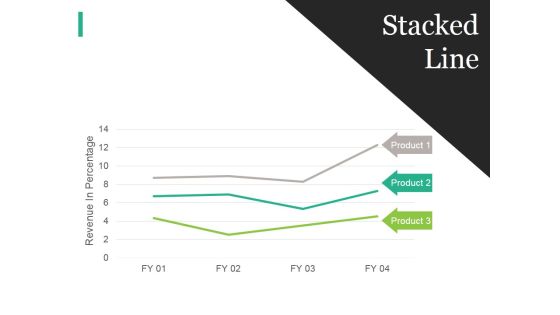
Stacked Line Ppt PowerPoint Presentation File Display
This is a stacked line ppt powerpoint presentation file display. This is a three stage process. The stages in this process are business, strategy, marketing, analysis, revenue in percentage, stacked line.

Content Marketing Performance Template 1 Ppt PowerPoint Presentation Infographics Graphics Example
This is a content marketing performance template 1 ppt powerpoint presentation infographics graphics example. This is a eight stage process. The stages in this process are brand awareness, engagement, sales, lead generation, customer retention lead nurturing, upsell.
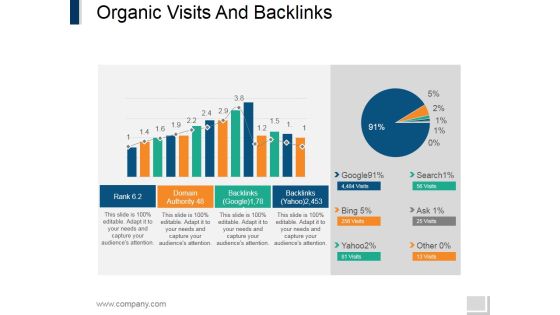
Organic Visits And Backlinks Ppt PowerPoint Presentation File Outline
This is a organic visits and backlinks ppt powerpoint presentation file outline. This is a two stage process. The stages in this process are rank, domain authority, backlinks, yahoo.

Organic Vs Paid Search Traffic Ppt PowerPoint Presentation Styles Sample
This is a organic vs paid search traffic ppt powerpoint presentation styles sample. This is a two stage process. The stages in this process are sessions, new user, bounce rate, goal competition, organic search traffic, paid search traffic.

Organic Visits And Backlinks Ppt PowerPoint Presentation Infographics Slideshow
This is a organic visits and backlinks ppt powerpoint presentation infographics slideshow. This is a two stage process. The stages in this process are rank, domain authority, backlinks.
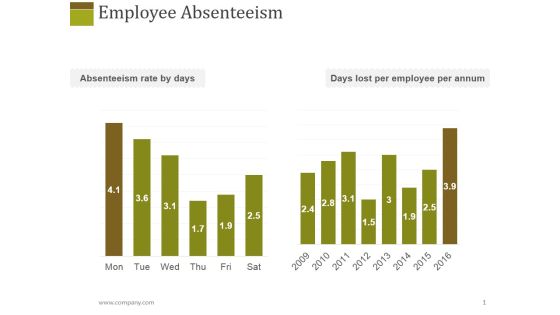
Employee Absenteeism Ppt PowerPoint Presentation Styles Sample
This is a employee absenteeism ppt powerpoint presentation styles sample. This is a two stage process. The stages in this process are mon, tue, wed, thu, fri.

Demand Forecasting Template 1 Ppt PowerPoint Presentation Styles Gridlines
This is a demand forecasting template 1 ppt powerpoint presentation styles gridlines. This is a four stage process. The stages in this process are trends, qualitative input, base forecast, seasonality factors.

Sales Forecasting Template 1 Ppt PowerPoint Presentation Infographic Template Maker
This is a sales forecasting template 1 ppt powerpoint presentation infographic template maker. This is a two stage process. The stages in this process are business, strategy, marketing, analysis, finance.
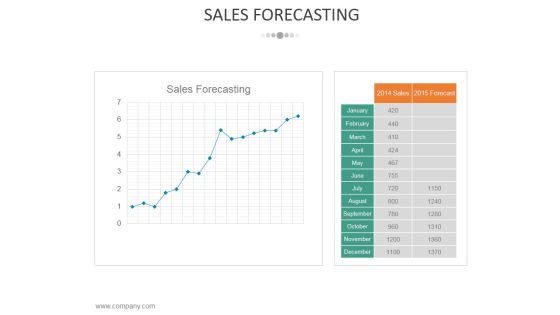
Sales Forecasting Template 2 Ppt PowerPoint Presentation Infographic Template Themes
This is a sales forecasting template 2 ppt powerpoint presentation infographic template themes. This is a two stage process. The stages in this process are business, strategy, marketing, analysis, finance.

Bar Graph Ppt PowerPoint Presentation File Portfolio
This is a bar graph ppt powerpoint presentation file portfolio. This is a twelve stage process. The stages in this process are financial, marketing, management, business, strategy.


 Continue with Email
 Sign up for an account
 Home
Home