Business Value

Financial Summary Ppt PowerPoint Presentation Ideas Slide Portrait
This is a financial summary ppt powerpoint presentation ideas slide portrait. This is a five stage process. The stages in this process are ebitda, revenue growth, net revenue, net profit, net profit, margin.
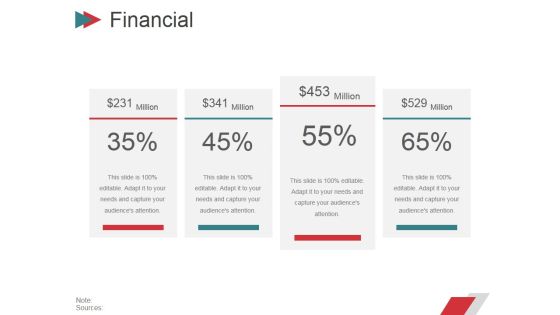
Financial Ppt PowerPoint Presentation Gallery Design Ideas
This is a financial ppt powerpoint presentation gallery design ideas. This is a five stage process. The stages in this process are ebitda, net profit, revenue, growth, net revenue, net profit, margin.
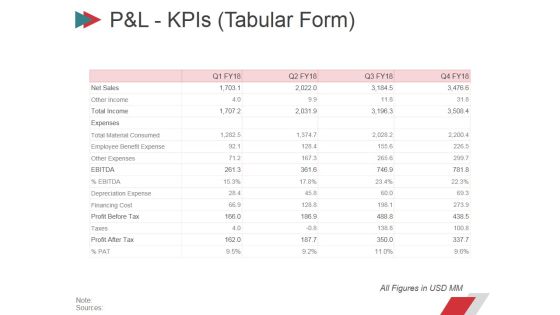
Pandl Kpis Tabular Form Ppt PowerPoint Presentation Summary Layout
This is a pandl kpis tabular form ppt powerpoint presentation summary layout. This is a four stage process. The stages in this process are revenue, cogs, operating profit, net profit.

P And L Kpis Template 2 Ppt PowerPoint Presentation Styles Objects
This is a p and l kpis template 2 ppt powerpoint presentation styles objects. This is a four stage process. The stages in this process are revenue, cogs, operating profit, net profit.
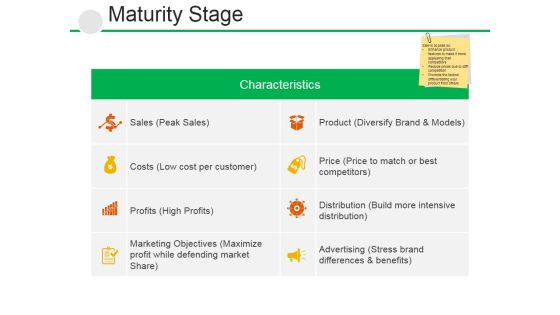
Maturity Stage Ppt PowerPoint Presentation Professional Ideas
This is a maturity stage ppt powerpoint presentation professional ideas. This is a two stage process. The stages in this process are sales peak sales, product diversify brand and models, profits high profits, distribution build more intensive distribution.

P And L Kpis Template 1 Ppt PowerPoint Presentation Model Inspiration
This is a p and l kpis template 1 ppt powerpoint presentation model inspiration. This is a four stage process. The stages in this process are revenue, cogs, operating profit, net profit.

P And L Overview Template 2 Ppt PowerPoint Presentation Model Elements
This is a p and l overview template 2 ppt powerpoint presentation model elements. This is a four stage process. The stages in this process are financing cost, net sales, profit before tax, profit after tax.
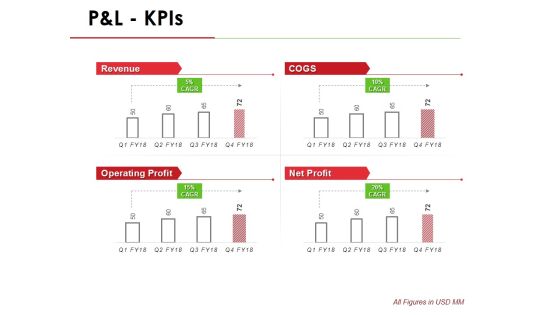
P And L Kpis Template 1 Ppt PowerPoint Presentation Infographic Template Outline
This is a p and l kpis template 1 ppt powerpoint presentation infographic template outline. This is a four stage process. The stages in this process are revenue, operating profit, cogs, net profit.
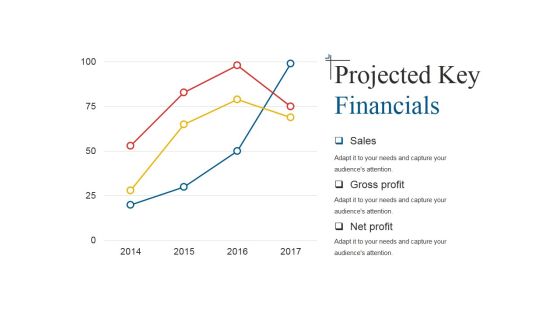
Projected Key Financials Template 1 Ppt PowerPoint Presentation Infographic Template Graphics
This is a projected key financials template 1 ppt powerpoint presentation infographic template graphics. This is a three stage process. The stages in this process are sales, gross profit, net profit.
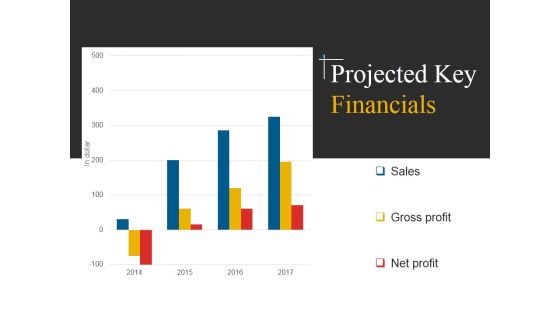
Projected Key Financials Template 2 Ppt PowerPoint Presentation Inspiration Example File
This is a projected key financials template 2 ppt powerpoint presentation inspiration example file. This is a four stage process. The stages in this process are sales, gross profit, net profit.
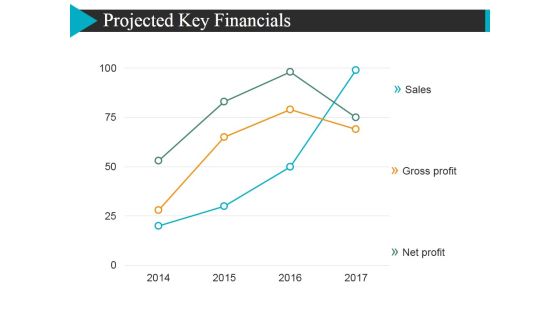
Projected Key Financials Template 1 Ppt PowerPoint Presentation Model Rules
This is a projected key financials template 1 ppt powerpoint presentation model rules. This is a three stage process. The stages in this process are sales, gross profit, net profit, finance.

Projected Key Financials Template 2 Ppt PowerPoint Presentation Professional Clipart
This is a projected key financials template 2 ppt powerpoint presentation professional clipart. This is a four stage process. The stages in this process are sales, gross profit, net profit, in dollar.

Projected Key Financials Template 1 Ppt PowerPoint Presentation File Portfolio
This is a projected key financials template 1 ppt powerpoint presentation file portfolio. This is a three stage process. The stages in this process are sales, gross profit, net profit.
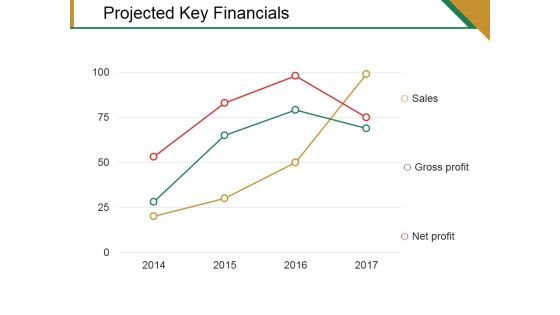
Projected Key Financials Template 2 Ppt PowerPoint Presentation Pictures Graphics Template
This is a projected key financials template 2 ppt powerpoint presentation pictures graphics template. This is a three stage process. The stages in this process are sales, gross profit, net profit.

Pandl Kpis Tabular Form Ppt PowerPoint Presentation File Design Templates
This is a pandl kpis tabular form ppt powerpoint presentation file design templates. This is a four stage process. The stages in this process are revenue, cogs, operating profit, net profit.

Financial Summary Ppt PowerPoint Presentation Professional Template
This is a financial summary ppt powerpoint presentation professional template. This is a two stage process. The stages in this process are revenue growth, net, profit margin, ebitda, net revenue, net profit.
Pandl Kpis Tabular Form Ppt PowerPoint Presentation Gallery Icon
This is a pandl kpis tabular form ppt powerpoint presentation gallery icon. This is a four stage process. The stages in this process are revenue, cogs, operating profit, net profit.
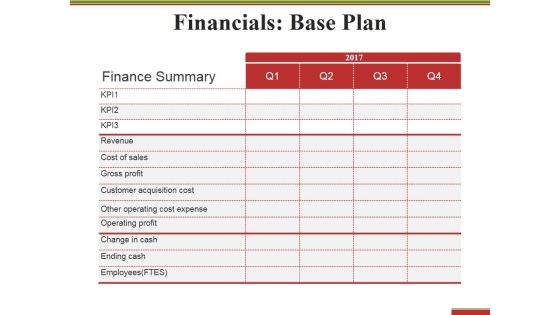
Financials Base Plan Ppt PowerPoint Presentation Styles Graphic Tips
This is a financials base plan ppt powerpoint presentation styles graphic tips. This is a four stage process. The stages in this process are finance summary, revenue, gross profit, operating profit, ending cash.

Financials Starch Plan Ppt PowerPoint Presentation Summary Professional
This is a financials starch plan ppt powerpoint presentation summary professional. This is a four stage process. The stages in this process are finance summary, revenue, gross profit, operating profit, ending cash.

Financials Summary Base Plan Vs Stretch Plan Ppt PowerPoint Presentation File Shapes
This is a financials summary base plan vs stretch plan ppt powerpoint presentation file shapes. This is a three stage process. The stages in this process are finance summary, revenue, gross profit, operating profit, ending cash.
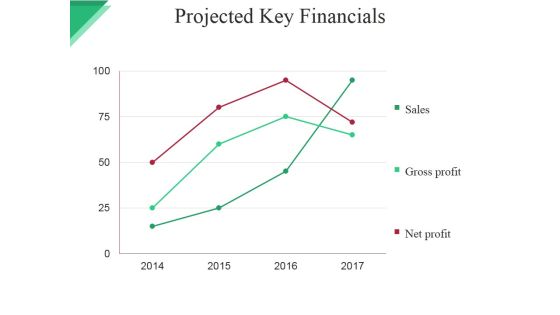
Projected Key Financials Template Ppt PowerPoint Presentation File Graphic Images
This is a projected key financials template ppt powerpoint presentation file graphic images. This is a four stage process. The stages in this process are sales, gross profit, net profit.

Projected Key Financials Template 1 Ppt PowerPoint Presentation Summary Professional
This is a projected key financials template 1 ppt powerpoint presentation summary professional. This is a three stage process. The stages in this process are in dollar, sales, gross profit, net profit, graph, year.
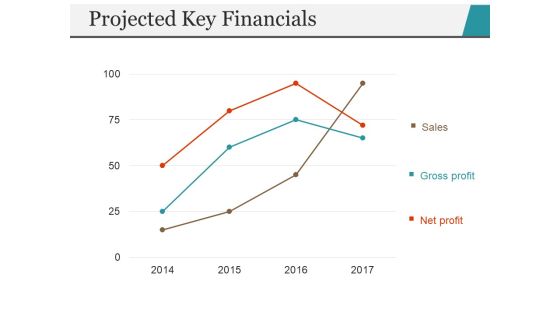
Projected Key Financials Template 2 Ppt PowerPoint Presentation Portfolio Inspiration
This is a projected key financials template 2 ppt powerpoint presentation portfolio inspiration. This is a three stage process. The stages in this process are sales, gross profit, net profit, year, finance.
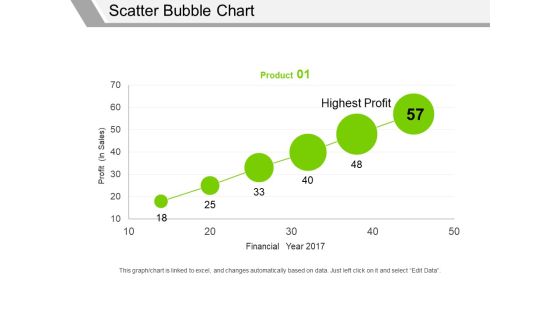
Scatter Bubble Chart Ppt PowerPoint Presentation Professional Graphics Pictures
This is a scatter bubble chart ppt powerpoint presentation professional graphics pictures. This is a one stage process. The stages in this process are profit in sales, financial year, highest profit, product.

Scatter Bubble Chart Ppt PowerPoint Presentation Summary Files
This is a scatter bubble chart ppt powerpoint presentation summary files. This is a six stage process. The stages in this process are product, financial year, profit, highest profit.
Scatter Bubble Chart Ppt PowerPoint Presentation Icon Elements
This is a scatter bubble chart ppt powerpoint presentation icon elements. This is a six stage process. The stages in this process are highest profit, profit, financial year, product.
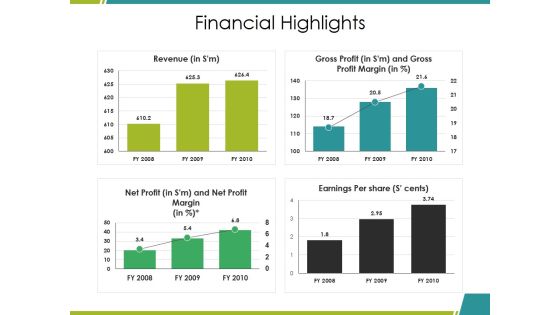
Financial Highlights Ppt PowerPoint Presentation Ideas Graphics Download
This is a financial highlights ppt powerpoint presentation ideas graphics download. This is a four stage process. The stages in this process are revenue, gross profit, net profit, earnings per share, bar graph.
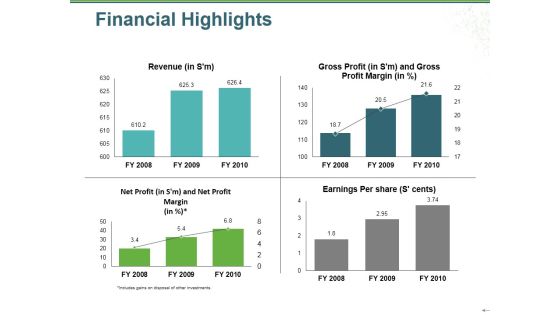
Financial Highlights Ppt PowerPoint Presentation Gallery Graphics Example
This is a financial highlights ppt powerpoint presentation gallery graphics example. This is a four stage process. The stages in this process are revenue, gross profit, net profit, earnings per share, bar graph.

Financial Summary Ppt PowerPoint Presentation Model Demonstration
This is a financial summary ppt powerpoint presentation model demonstration. This is a five stage process. The stages in this process are ebitda, revenue growth, net revenue, net profit margin, net profit.
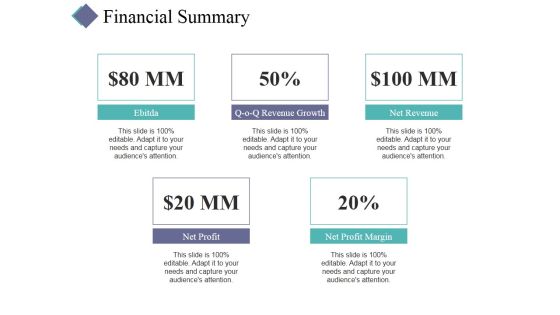
Financial Summary Ppt PowerPoint Presentation Summary Background
This is a financial summary ppt powerpoint presentation summary background. This is a five stage process. The stages in this process are net profit, net profit margin, net revenue, revenue growth.
P And L Kpis Template 2 Ppt PowerPoint Presentation Summary Icon
This is a p and l kpis template 2 ppt powerpoint presentation summary icon. This is a four stage process. The stages in this process are revenue, cogs, operating profit, net profit.

Pandl Kpis Tabular Form Ppt PowerPoint Presentation Pictures Visual Aids
This is a pandl kpis tabular form ppt powerpoint presentation pictures visual aids. This is a four stage process. The stages in this process are revenue, operating profit, cogs, net profit.
Pandl Kpis Template Ppt PowerPoint Presentation Model Icon
This is a pandl kpis template ppt powerpoint presentation model icon. This is a four stage process. The stages in this process are revenue, cogs, operating profit, net profit.

P And L Kpis Template 2 Ppt PowerPoint Presentation Inspiration Grid
This is a p and l kpis template 2 ppt powerpoint presentation inspiration grid. This is a four stage process. The stages in this process are revenue, cogs, operating profit, net profit.
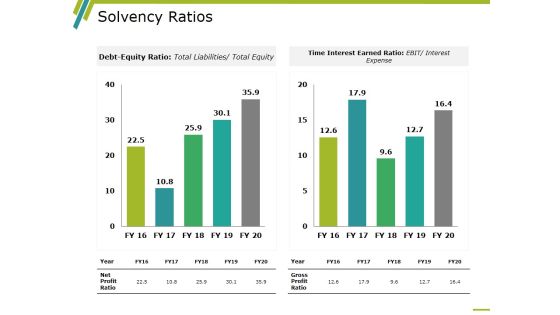
Solvency Ratios Template 1 Ppt PowerPoint Presentation Layouts Graphics Design
This is a solvency ratios template 1 ppt powerpoint presentation layouts graphics design. This is a two stage process. The stages in this process are time interest earned ratio, debt equity ratio, gross profit ratio, net profit ratio, year.

Solvency Ratios Template 2 Ppt PowerPoint Presentation Layouts Layouts
This is a solvency ratios template 2 ppt powerpoint presentation layouts layouts. This is a two stage process. The stages in this process are time interest earned ratio, debt equity ratio, gross profit ratio, net profit ratio, year.

P And L Kpis Ppt PowerPoint Presentation Designs Download
This is a p and l kpis ppt powerpoint presentation designs download. This is a four stage process. The stages in this process are revenue, cogs, operating profit, net profit.
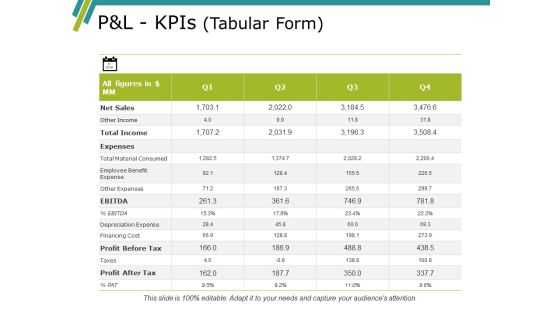
Pandl Kpis Template Ppt PowerPoint Presentation Gallery Summary
This is a pandl kpis template ppt powerpoint presentation gallery summary. This is a four stage process. The stages in this process are revenue, cogs, operating profit, net profit.
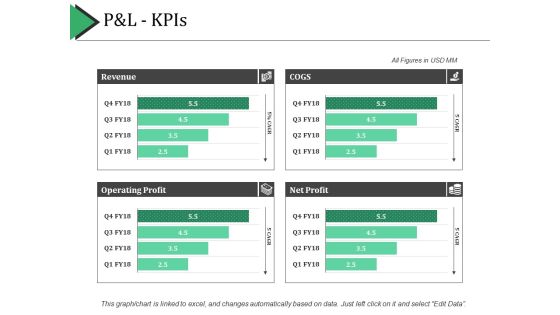
P And L Kpis Ppt PowerPoint Presentation Show Example Introduction
This is a p and l kpis ppt powerpoint presentation show example introduction. This is a four stage process. The stages in this process are revenue, cogs, net profit, operating profit.

Financial Summary Ppt PowerPoint Presentation Ideas Samples
This is a financial summary ppt powerpoint presentation ideas samples. This is a five stage process. The stages in this process are ebitda, net profit, net profit margin, net revenue, revenue growth.

Current Financial Highlights Ppt PowerPoint Presentation Professional Slide Download
This is a current financial highlights ppt powerpoint presentation professional slide download. This is a four stage process. The stages in this process are revenue, gross profit, net profit, earnings per share.

Current Financial Highlights Ppt PowerPoint Presentation File Demonstration
This is a current financial highlights ppt powerpoint presentation show example. This is a four stage process. The stages in this process are revenue, net profit, earnings per share, gross profit.

Company Sales And Performance Dashboard Ppt PowerPoint Presentation Show Structure
This is a company sales and performance dashboard ppt powerpoint presentation show structure. This is a four stage process. The stages in this process are year product sales, month growth in revenue, profit margins graph, year profits.

Customer Acquisition Strategy Funnel Example Of Ppt
This is a customer acquisition strategy funnel example of ppt. This is a three stage process. The stages in this process are customer trust, turnover, organic, lead, awareness, information, acquisition, click through, conversion, commercial levers, user experience, transactions.

Customer Acquisition Strategy Funnel Diagram Ppt Example 2017
This is a customer acquisition strategy funnel diagram ppt example 2017. This is a four stage process. The stages in this process are customer trust, click through, conversion, turnover, transactions, user experience, commercial levers, organic, lead, awareness, information, acquisition.

Customer Acquisition Planning Presentation Layouts
This is a customer acquisition planning presentation layouts. This is a three stage process. The stages in this process are customer trust, turnover, organic, lead, awareness, information, acquisition, click through, commercial levers, user experience, conversion, transactions.
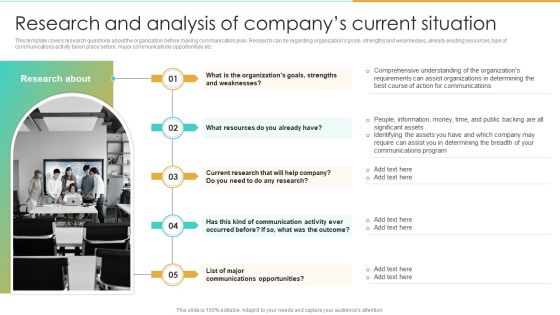
Research And Analysis Of Companys Current Situation Enterprise Communication Tactics Graphics PDF
This template covers research questions about the organization before making communication plan. Research can be regarding organizations goals, strengths and weaknesses, already existing resources, type of communications activity taken place before, major communications opportunities etc.Take your projects to the next level with our ultimate collection of Research And Analysis Of Companys Current Situation Enterprise Communication Tactics Graphics PDF. Slidegeeks has designed a range of layouts that are perfect for representing task or activity duration, keeping track of all your deadlines at a glance. Tailor these designs to your exact needs and give them a truly corporate look with your own brand colors they all make your projects stand out from the rest.

Classification Of Social Media Users Ppt PowerPoint Presentation Professional Clipart Images PDF
Presenting this set of slides with name classification of social media users ppt powerpoint presentation professional clipart images pdf. This is a four stage process. The stages in this process are brands, personalities, non profit organizations, local businesses. This is a completely editable PowerPoint presentation and is available for immediate download. Download now and impress your audience.

Debt Collection And Firm Revival Action Plan For Lenders Designs PDF
The following slide provides solutions to lenders for collecting and recovering debt from borrowers. The purpose of these strategies is to present practical techniques to be applied by lender in the process of loan recovery and for running a profitable business. The strategies covered are to assess borrowers creditworthiness, deploy an automated debt collection system and trace debtors. Persuade your audience using this Debt Collection And Firm Revival Action Plan For Lenders Designs PDF. This PPT design covers four stages, thus making it a great tool to use. It also caters to a variety of topics including Assess Borrowers Creditworthiness, Deploy An Automated, Debt Collection System, Trace Debtors. Download this PPT design now to present a convincing pitch that not only emphasizes the topic but also showcases your presentation skills.

Cross Sell In Banking Industry Year Over Year Financial Performance Highlights Ppt Ideas Styles PDF
This is a cross sell in banking industry year over year financial performance highlights ppt ideas styles pdf template with various stages. Focus and dispense information on four stages using this creative set, that comes with editable features. It contains large content boxes to add your information on topics like operating income, net income, gross margin, operating cash flow. You can also showcase facts, figures, and other relevant content using this PPT layout. Grab it now.

Required Documents For Loan Application Ppt PowerPoint Presentation Professional Slides PDF
Presenting required documents for loan application ppt powerpoint presentation professional slides pdf to dispense important information. This template comprises three stages. It also presents valuable insights into the topics including information liabilities, proof of income, proof of assets, income tax return, paycheck, money market account, mutual funds. This is a completely customizable PowerPoint theme that can be put to use immediately. So, download it and address the topic impactfully.
Vector Illustration Of Consequences Ahead Icon Ppt PowerPoint Presentation Outline Graphic Tips PDF
Persuade your audience using this vector illustration of consequences ahead icon ppt powerpoint presentation outline graphic tips pdf. This PPT design covers six stages, thus making it a great tool to use. It also caters to a variety of topics including lost sales and income, delayed sales or income, increased expenses, consequences. Download this PPT design now to present a convincing pitch that not only emphasizes the topic but also showcases your presentation skills.

Company Outline Financial Snapshot Ppt Styles Grid PDF
This is a company outline financial snapshot ppt styles grid pdf template with various stages. Focus and dispense information on three stages using this creative set, that comes with editable features. It contains large content boxes to add your information on topics like sales, operating income, net income. You can also showcase facts, figures, and other relevant content using this PPT layout. Grab it now.
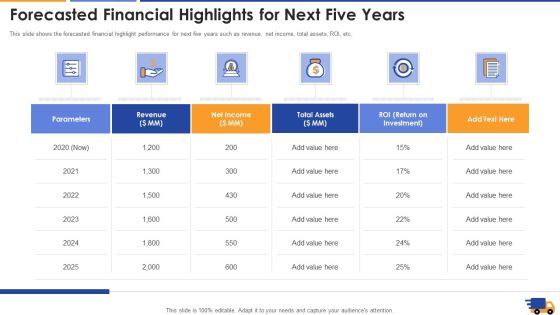
Forecasted Financial Highlights For Next Five Years Demonstration Pdf
This slide shows the forecasted financial highlight performance for next six years such as revenue, net income, total assets, ROI, etc. Deliver and pitch your topic in the best possible manner with this forecasted financial highlights for next five years demonstration pdf. Use them to share invaluable insights on revenue, net income, investment and impress your audience. This template can be altered and modified as per your expectations. So, grab it now.

Demographic Survey Form For Target Market Assessment Sample PDF
This slide displays the survey form for target audience research. It includes questions based on demographics such as gender, age, household income, ethnic group, etc. Presenting Demographic Survey Form For Target Market Assessment Sample PDF to dispense important information. This template comprises four stages. It also presents valuable insights into the topics including Demographics Survey, Target Market, Income. This is a completely customizable PowerPoint theme that can be put to use immediately. So, download it and address the topic impactfully.
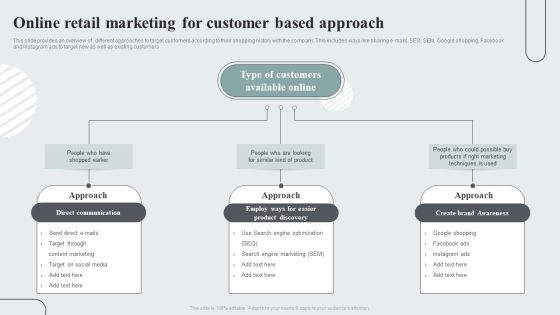
Techniques To Enhance Customer Engagement Via Digital Platforms Online Retail Marketing For Customer Based Approach Infographics PDF
This slide provides an overview of different approaches to target customers according to their shopping history with the company. This includes ways like sharing e-mails, SEO, SEM, Google shopping, Facebook and Instagram ads to target new as well as existing customers This Techniques To Enhance Customer Engagement Via Digital Platforms Online Retail Marketing For Customer Based Approach Infographics PDF from Slidegeeks makes it easy to present information on your topic with precision. It provides customization options, so you can make changes to the colors, design, graphics, or any other component to create a unique layout. It is also available for immediate download, so you can begin using it right away. Slidegeeks has done good research to ensure that you have everything you need to make your presentation stand out. Make a name out there for a brilliant performance.

Request For Proposal Compliance Traceability Matrix Best Practices Inspiration PDF
This slide represents the best practices for the RFP compliance matrix. The purpose of this slide is to share the best practices before writing a compliance matrix for a proposal. The guidelines include creating a matrix at the beginning of the proposal, matching customer language, updating the proposal matrix regularly, etc. Presenting Request For Proposal Compliance Traceability Matrix Best Practices Inspiration PDF to dispense important information. This template comprises one stages. It also presents valuable insights into the topics including Best Practices, Compliance, Comments. This is a completely customizable PowerPoint theme that can be put to use immediately. So, download it and address the topic impactfully.

Workplace Conflict Resolution Showcasing The Results Of Resolving Employees Conflict Structure PDF
The purpose of this slide is to outline the results of resolving workplace conflicts after developing in-house strategy. Reduction in stress level, increase in trust level, improved work performance and increase in employee retention rate are the major benefits which are mentioned in the slide. Do you know about Slidesgeeks Workplace Conflict Resolution Showcasing The Results Of Resolving Employees Conflict Structure PDF These are perfect for delivering any kind od presentation. Using it, create PowerPoint presentations that communicate your ideas and engage audiences. Save time and effort by using our pre-designed presentation templates that are perfect for a wide range of topic. Our vast selection of designs covers a range of styles, from creative to business, and are all highly customizable and easy to edit. Download as a PowerPoint template or use them as Google Slides themes.

Financial Report Of An IT Firm Companys Major Statistics From Financial Statements 2023 Diagrams PDF
The slide provides key stats Revenue, Operating Income, net income, Employee count, Assets, Operating expenses etc. of the company, for the year 2023.This is a Financial Report Of An IT Firm Companys Major Statistics From Financial Statements 2023 Diagrams PDF template with various stages. Focus and dispense information on twelve stages using this creative set, that comes with editable features. It contains large content boxes to add your information on topics like Total Assets, Employee Count, Connected Device You can also showcase facts, figures, and other relevant content using this PPT layout. Grab it now.

Degree Of Operational Leverage Of Firm From EBIT And Revenue Rules PDF
This slide illustrates tabular representation of operating leverage calculation in cost accounting. It includes EBIT operating income, revenue sales, percent change in EBIT etc. Presenting Degree Of Operational Leverage Of Firm From EBIT And Revenue Rules PDF to dispense important information. This template comprises one stages. It also presents valuable insights into the topics including Revenue, Sales, EBIT Operating Income, 2021 To 2022. This is a completely customizable PowerPoint theme that can be put to use immediately. So, download it and address the topic impactfully.
 Home
Home