Business Trends

Network Marketing Company Profile Netsurf Turnover 2002 2022 Rules PDF
This slide represents the Netsurf turnover from last 20 years from 2002 to 2022 which shows increasing trend year after year. It also showcases compound annual growth rate From laying roadmaps to briefing everything in detail, our templates are perfect for you. You can set the stage with your presentation slides. All you have to do is download these easy to edit and customizable templates. Network Marketing Company Profile Netsurf Turnover 2002 2022 Rules PDF will help you deliver an outstanding performance that everyone would remember and praise you for. Do download this presentation today.
Market Research Evaluation Company Outline EBITDA Sample PDF
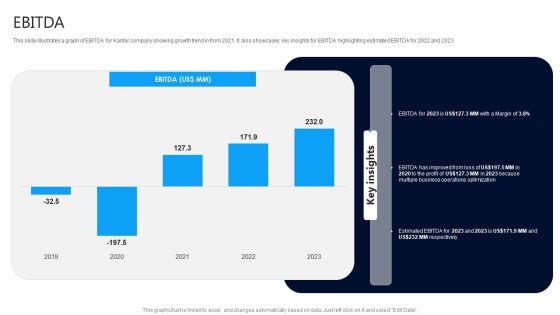
This slide illustrates a graph of EBITDA for Kantar company showing growth trend in from 2021. It also showcases key insights for EBITDA highlighting estimated EBITDA for 2022 and 2023 From laying roadmaps to briefing everything in detail, our templates are perfect for you. You can set the stage with your presentation slides. All you have to do is download these easy to edit and customizable templates. Market Research Evaluation Company Outline EBITDA Sample PDF will help you deliver an outstanding performance that everyone would remember and praise you for. Do download this presentation today.
SAC Planning And Implementation SAP Analytics Cloud Dashboard For Financial Reporting Introduction PDF
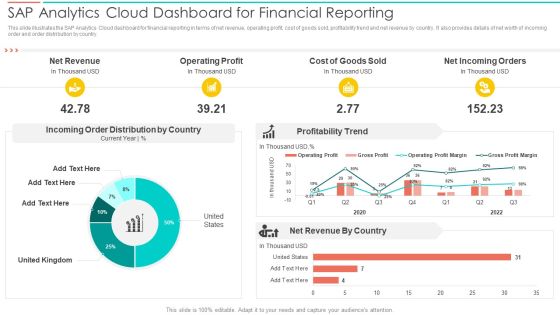
This slide illustrates the SAP Analytics Cloud dashboard for financial reporting in terms of net revenue, operating profit, cost of goods sold, profitability trend and net revenue by country. It also provides details of net worth of incoming order and order distribution by country. Deliver an awe inspiring pitch with this creative SAC Planning And Implementation SAP Analytics Cloud Dashboard For Financial Reporting Introduction PDF bundle. Topics like Net Revenue, Operating Profit, Cost Goods Sold can be discussed with this completely editable template. It is available for immediate download depending on the needs and requirements of the user.
Digital Transformation In The Automotive Industry Report With Key Attribute Slides PDF
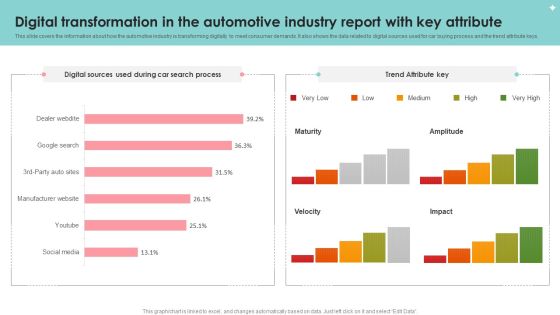
This slide covers the information about how the automotive industry is transforming digitally to meet consumer demands. It also shows the data related to digital sources used for car buying process and the trend attribute keys. Pitch your topic with ease and precision using this Digital Transformation In The Automotive Industry Report With Key Attribute Slides PDF. This layout presents information on Digital Transformation, Automotive Industry Report, Key Attribute. It is also available for immediate download and adjustment. So, changes can be made in the color, design, graphics or any other component to create a unique layout.
Food Company Financial Performance Summary Revenue By Category Introduction PDF
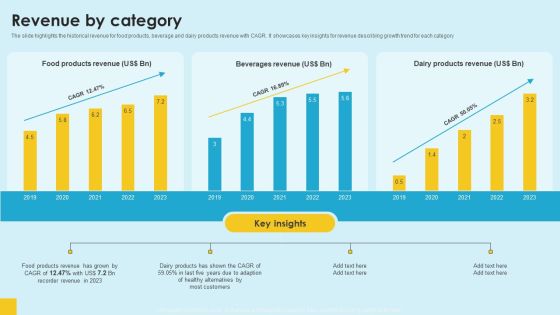
The slide highlights the historical revenue for food products, beverage and dairy products revenue with CAGR. It showcases key insights for revenue describing growth trend for each category. Boost your pitch with our creative Food Company Financial Performance Summary Revenue By Category Introduction PDF. Deliver an awe-inspiring pitch that will mesmerize everyone. Using these presentation templates you will surely catch everyones attention. You can browse the ppts collection on our website. We have researchers who are experts at creating the right content for the templates. So you do not have to invest time in any additional work. Just grab the template now and use them.

Super Short And Long Content Video Action Plan Playbook For Influencer Reel Marketing Information PDF
Purpose of the following slide is to analyze super short and long content video as key trend for video marketing. It displays the overview of the video, its duration and distribution network.Deliver and pitch your topic in the best possible manner with this Super Short And Long Content Video Action Plan Playbook For Influencer Reel Marketing Information PDF. Use them to share invaluable insights on Scale Advertisement, Brand Reorganization, Distribution Network and impress your audience. This template can be altered and modified as per your expectations. So, grab it now.

Software Products And Solutions Firm Details EBITDA And Margin Structure PDF
This slide illustrates a graph of EBITDA in US dollar and margin in percentage for software company illustrating growth trend in last five years from 2018 to 2022. It also showcases net profit contribution by services and solutions. Deliver an awe inspiring pitch with this creative Software Products And Solutions Firm Details EBITDA And Margin Structure PDF bundle. Topics like EBITDA, Services EBITDA, Solutions EBITDA, 2018 To 2022 can be discussed with this completely editable template. It is available for immediate download depending on the needs and requirements of the user.
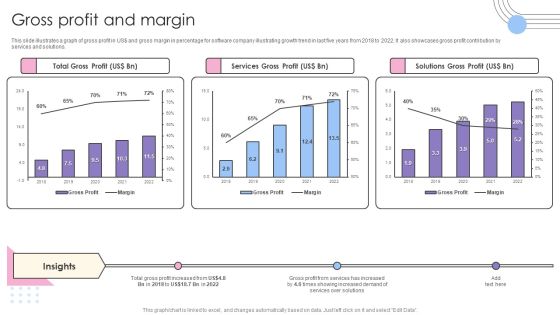
Software Products And Solutions Firm Details Gross Profit And Margin Pictures PDF
This slide illustrates a graph of gross profit in US dollar and gross margin in percentage for software company illustrating growth trend in last five years from 2018 to 2022. It also showcases gross profit contribution by services and solutions. Deliver and pitch your topic in the best possible manner with this Software Products And Solutions Firm Details Gross Profit And Margin Pictures PDF. Use them to share invaluable insights on Total Gross Profit, Services Gross Profit, Solutions Gross Profit and impress your audience. This template can be altered and modified as per your expectations. So, grab it now.

Software Products And Solutions Firm Details Net Profit And Margin Information PDF
This slide illustrates a graph of net profit in US dollar and net margin in percentage for software company illustrating growth trend in last five years from 2018 to 2022. It also showcases net profit contribution by services and solutions. Deliver and pitch your topic in the best possible manner with this Software Products And Solutions Firm Details Net Profit And Margin Information PDF. Use them to share invaluable insights on Net Profit, Services Net Profit, Solutions Net Profit and impress your audience. This template can be altered and modified as per your expectations. So, grab it now.

Software Products And Solutions Firm Details Operating Profit And Margin Mockup PDF
This slide illustrates a graph of operating profit in US dollar and operating margin in percentage for software company illustrating growth trend in last five years from 2018 to 2022. It also showcases operating profit contribution by services and solutions. Deliver an awe inspiring pitch with this creative Software Products And Solutions Firm Details Operating Profit And Margin Mockup PDF bundle. Topics like Operating Profit, Services Operating Profit, Solutions Operating Profit can be discussed with this completely editable template. It is available for immediate download depending on the needs and requirements of the user.
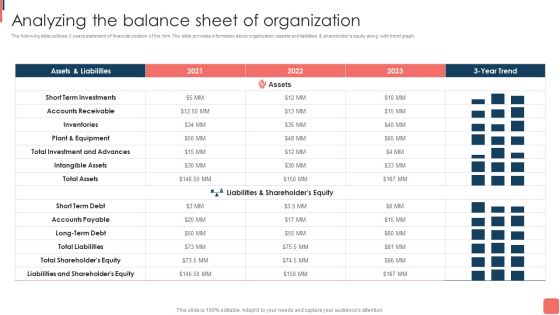
Effective Financial Planning Assessment Techniques Analyzing The Balance Sheet Of Organization Slides PDF
The following slide outlines 3 years statement of financial position of the firm. The slide provides information about organization assets and liabilities shareholders equity along with trend graph. From laying roadmaps to briefing everything in detail, our templates are perfect for you. You can set the stage with your presentation slides. All you have to do is download these easy-to-edit and customizable templates. Effective Financial Planning Assessment Techniques Analyzing The Balance Sheet Of Organization Slides PDF will help you deliver an outstanding performance that everyone would remember and praise you for. Do download this presentation today.
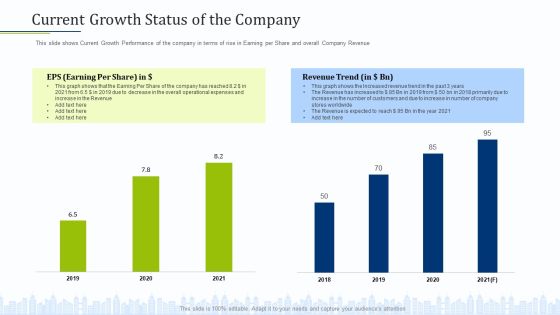
Pitch Deck To Draw External Capital From Commercial Banking Institution Current Growth Status Of The Company Template PDF
This slide shows Current Growth Performance of the company in terms of rise in Earning per Share and overall Company Revenue Deliver and pitch your topic in the best possible manner with this pitch deck to draw external capital from commercial banking institution current growth status of the company template pdf. Use them to share invaluable insights on overall operational expenses and increase, increase in number of company stores worldwide, revenue trend and impress your audience. This template can be altered and modified as per your expectations. So, grab it now.
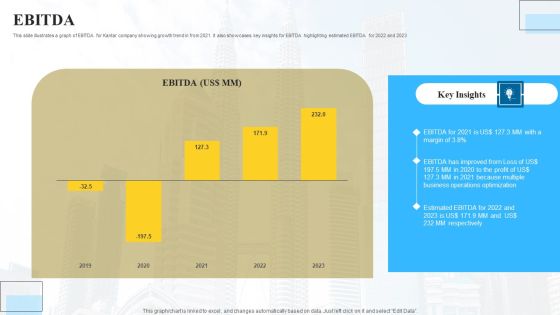
Marketing Insights Company Profile EBITDA Designs PDF
This slide illustrates a graph of EBITDA for Kantar company showing growth trend in from 2021. It also showcases key insights for EBITDA highlighting estimated EBITDA for 2022 and 2023 Slidegeeks has constructed Marketing Insights Company Profile EBITDA Designs PDF after conducting extensive research and examination. These presentation templates are constantly being generated and modified based on user preferences and critiques from editors. Here, you will find the most attractive templates for a range of purposes while taking into account ratings and remarks from users regarding the content. This is an excellent jumping off point to explore our content and will give new users an insight into our top notch PowerPoint Templates.
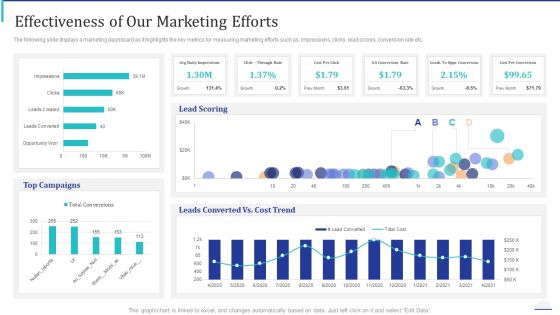
How Make Impactful Product Marketing Message Build Product Differentiation Effectiveness Of Our Marketing Efforts Themes PDF
The following slide displays a marketing dashboard as it highlights the key metrics for measuring marketing efforts such as Impressions, clicks, lead scores, conversion rate etc. Deliver an awe inspiring pitch with this creative how make impactful product marketing message build product differentiation effectiveness of our marketing efforts themes pdf bundle. Topics like top campaigns, lead scoring, leads converted vs cost trend can be discussed with this completely editable template. It is available for immediate download depending on the needs and requirements of the user.
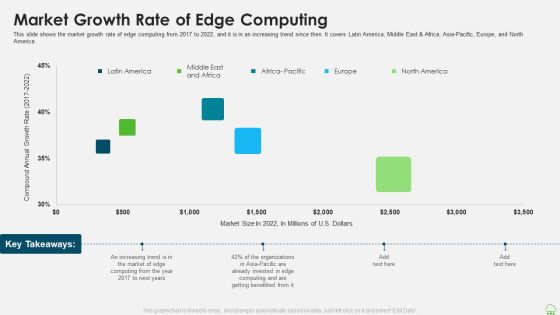
Distributed Computing IT Market Growth Rate Of Edge Computing Information PDF
This slide shows the market growth rate of edge computing from 2017 to 2022, and it is in an increasing trend since then. It covers Latin America, Middle East and Africa, Asia-Pacific, Europe, and North America. Deliver and pitch your topic in the best possible manner with this distributed computing it market growth rate of edge computing information pdf. Use them to share invaluable insights on organizations, market, growth rate and impress your audience. This template can be altered and modified as per your expectations. So, grab it now.

Annual Growth Comparison Of Digital Advertising Market Summary PDF
The purpose of this slide is to highlight the yearly growth of digital marketing due rapid increase in the e commerce industry. The growth trend period includes 2019 2023 along with key insights. Pitch your topic with ease and precision using this Annual Growth Comparison Of Digital Advertising Market Summary PDF. This layout presents information on Digital Marketing, Internet Users, Career Among Youngsters. It is also available for immediate download and adjustment. So, changes can be made in the color, design, graphics or any other component to create a unique layout.
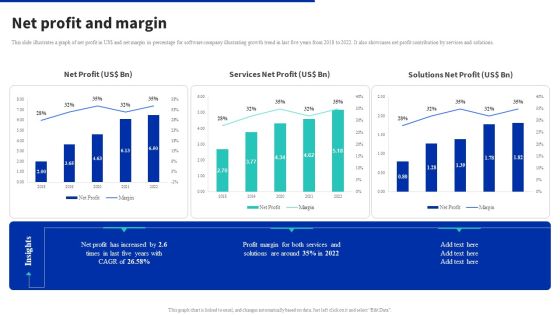
Digital Products Company Outline Net Profit And Margin Summary PDF
This slide illustrates a graph of net profit in US dollar and net margin in percentage for software company illustrating growth trend in last five years from 2018 to 2022. It also showcases net profit contribution by services and solutions. From laying roadmaps to briefing everything in detail, our templates are perfect for you. You can set the stage with your presentation slides. All you have to do is download these easy to edit and customizable templates. Digital Products Company Outline Net Profit And Margin Summary PDF will help you deliver an outstanding performance that everyone would remember and praise you for. Do download this presentation today.

Information Technology Solutions Company Outline Cost Per Converted User CPCU Revenue Topics PDF
This slide covers the cost per converted user revenue for last five years from 2018 to 2022 which shows increasing trend due to more user conversions From laying roadmaps to briefing everything in detail, our templates are perfect for you. You can set the stage with your presentation slides. All you have to do is download these easy to edit and customizable templates. Information Technology Solutions Company Outline Cost Per Converted User CPCU Revenue Topics PDF will help you deliver an outstanding performance that everyone would remember and praise you for. Do download this presentation today.
Market Insights Research Results With KPI Dashboard Ppt PowerPoint Presentation Icon File Formats PDF
The given below slide highlights the KPAs of market research associated with customer satisfaction. It includes net promoter score, customer effort score, monthly NPS and CES trend etc.Pitch your topic with ease and precision using this Market Insights Research Results With KPI Dashboard Ppt PowerPoint Presentation Icon File Formats PDF. This layout presents information on Satisfaction Score, Customer Effort, Customer Score. It is also available for immediate download and adjustment. So, changes can be made in the color, design, graphics or any other component to create a unique layout.

Network Marketing Company Profile Netsurf Revenue From 2020 To 2022 Elements PDF
This slide represents the Netsurf revenue for past three years from 2020 to 2022 which shows increasing trend year after year Get a simple yet stunning designed Network Marketing Company Profile Netsurf Revenue From 2020 To 2022 Elements PDF. It is the best one to establish the tone in your meetings. It is an excellent way to make your presentations highly effective. So, download this PPT today from Slidegeeks and see the positive impacts. Our easy to edit Network Marketing Company Profile Netsurf Revenue From 2020 To 2022 Elements PDF can be your go to option for all upcoming conferences and meetings. So, what are you waiting for Grab this template today.
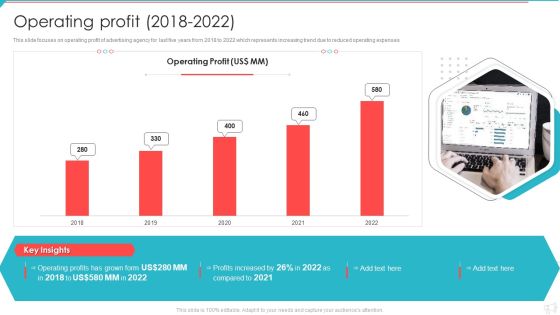
Advertisement And Marketing Agency Company Profile Operating Profit 2018 To 2022 Infographics PDF
This slide focuses on operating profit of advertising agency for last five years from 2018 to 2022 which represents increasing trend due to reduced operating expenses. Deliver and pitch your topic in the best possible manner with this Advertisement And Marketing Agency Company Profile Operating Profit 2018 To 2022 Infographics PDF. Use them to share invaluable insights on Operating Profit, Profits Increased, 2018 To 2022 and impress your audience. This template can be altered and modified as per your expectations. So, grab it now.
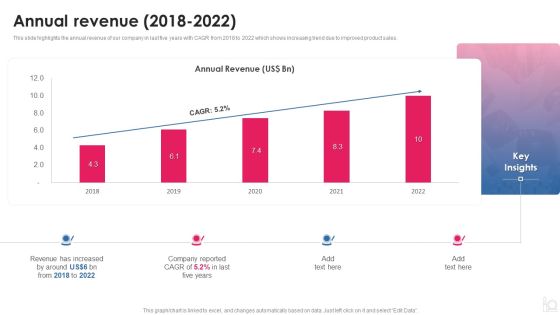
Makeup And Beauty Care Products Company Profile Annual Revenue 2018 To 2022 Sample PDF
This slide highlights the annual revenue of our company in last five years with CAGR from 2018 to 2022 which shows increasing trend due to improved product sales.Deliver and pitch your topic in the best possible manner with this Makeup And Beauty Care Products Company Profile Annual Revenue 2018 To 2022 Sample PDF Use them to share invaluable insights on Revenue Increased, Company Reported, Annual Revenue and impress your audience. This template can be altered and modified as per your expectations. So, grab it now.
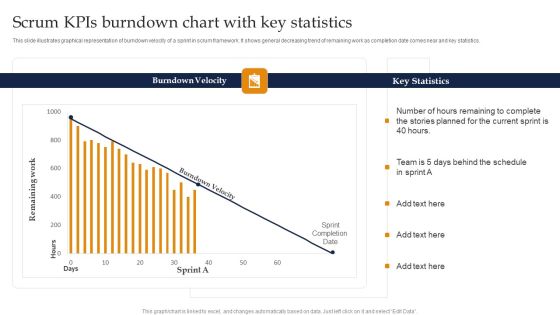
Scrum Kpis Burndown Chart With Key Statistics Ppt Pictures Visual Aids PDF
This slide illustrates graphical representation of burndown velocity of a sprint in scrum framework. It shows general decreasing trend of remaining work as completion date comes near and key statistics. Pitch your topic with ease and precision using this Scrum Kpis Burndown Chart With Key Statistics Ppt Pictures Visual Aids PDF. This layout presents information on Burndown Velocity, Key Statistics, Current Sprint. It is also available for immediate download and adjustment. So, changes can be made in the color, design, graphics or any other component to create a unique layout.
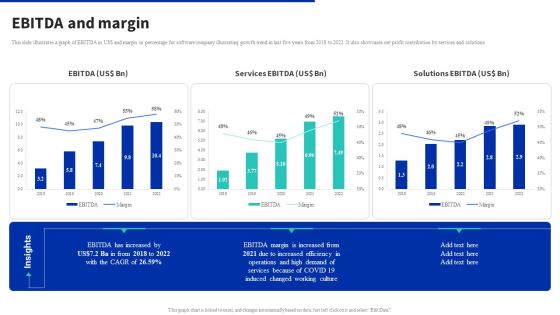
Digital Products Company Outline Ebitda And Margin Inspiration PDF
This slide illustrates a graph of EBITDA in US dollar and margin in percentage for software company illustrating growth trend in last five years from 2018 to 2022. It also showcases net profit contribution by services and solutions. Take your projects to the next level with our ultimate collection of Digital Products Company Outline Ebitda And Margin Inspiration PDF. Slidegeeks has designed a range of layouts that are perfect for representing task or activity duration, keeping track of all your deadlines at a glance. Tailor these designs to your exact needs and give them a truly corporate look with your own brand colors they will make your projects stand out from the rest.

Monetary Planning And Evaluation Guide Analyzing The Balance Sheet Of Organization Ppt Model Graphics Pictures PDF
The following slide outlines 3 years statement of financial position of the firm. The slide provides information about organization assets and liabilities and shareholders equity along with trend graph. Want to ace your presentation in front of a live audience. Our Monetary Planning And Evaluation Guide Analyzing The Balance Sheet Of Organization Ppt Model Graphics Pictures PDF can help you do that by engaging all the users towards you. Slidegeeks experts have put their efforts and expertise into creating these impeccable powerpoint presentations so that you can communicate your ideas clearly. Moreover, all the templates are customizable, and easy-to-edit and downloadable. Use these for both personal and commercial use.

Overview Of Organizational Analyzing The Balance Sheet Of Organization Professional PDF
The following slide outlines 3 years statement of financial position of the firm. The slide provides information about organization assets and liabilities and shareholders equity along with trend graph. Boost your pitch with our creative Overview Of Organizational Analyzing The Balance Sheet Of Organization Professional PDF. Deliver an awe-inspiring pitch that will mesmerize everyone. Using these presentation templates you will surely catch everyones attention. You can browse the ppts collection on our website. We have researchers who are experts at creating the right content for the templates. So you dont have to invest time in any additional work. Just grab the template now and use them.
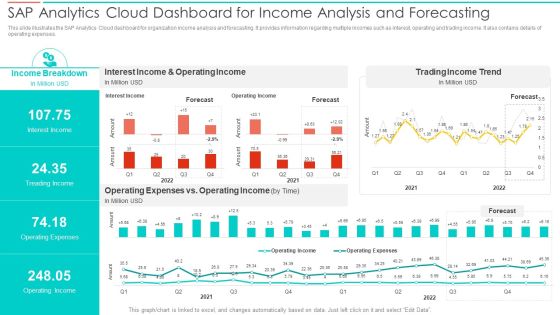
SAC Planning And Implementation SAP Analytics Cloud Dashboard For Income Analysis Summary PDF
This slide illustrates the SAP Analytics Cloud dashboard for organization income analysis and forecasting. It provides information regarding multiple incomes such as interest, operating and trading income. It also contains details of operating expenses. Deliver an awe inspiring pitch with this creative SAC Planning And Implementation SAP Analytics Cloud Dashboard For Income Analysis Summary PDF bundle. Topics like Income Breakdown, Interest Income, Operating Income, Trading Income Trend can be discussed with this completely editable template. It is available for immediate download depending on the needs and requirements of the user.

Sales Promotion Of Upgraded Product Through Upselling Company Quarterly Financial Highlights With Key Insights Ideas PDF
This slide shows the graph related to quarterly decreasing trend of the net sales and operating profit margin for the year 2022, along with the key insights. Deliver an awe inspiring pitch with this creative sales promotion of upgraded product through upselling company quarterly financial highlights with key insights ideas pdf bundle. Topics like company quarterly financial highlights with key insights can be discussed with this completely editable template. It is available for immediate download depending on the needs and requirements of the user.
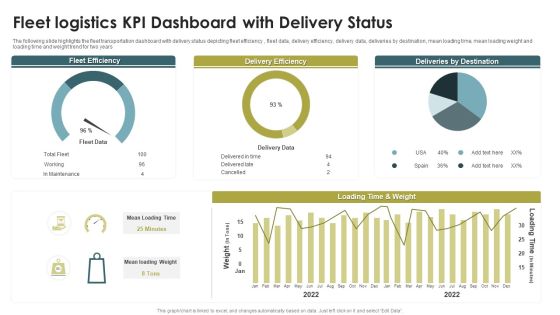
Fleet Logistics KPI Dashboard With Delivery Status Ppt Model Guide PDF
The following slide highlights the fleet transportation dashboard with delivery status depicting fleet efficiency , fleet data, delivery efficiency, delivery data, deliveries by destination, mean loading time, mean loading weight and loading time and weight trend for two years. Pitch your topic with ease and precision using this Fleet Logistics KPI Dashboard With Delivery Status Ppt Model Guide PDF. This layout presents information on Fleet Efficiency, Delivery Efficiency, Deliveries By Destination. It is also available for immediate download and adjustment. So, changes can be made in the color, design, graphics or any other component to create a unique layout.
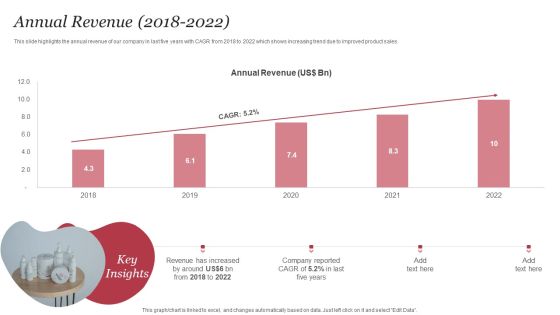
Personal Care Company Profile Annual Revenue 2018 To 2022 Graphics PDF
This slide highlights the annual revenue of our company in last five years with CAGR from 2018 to 2022 which shows increasing trend due to improved product sales. Deliver and pitch your topic in the best possible manner with this Personal Care Company Profile Annual Revenue 2018 To 2022 Graphics PDF. Use them to share invaluable insights on Annual Revenue, Key Insights, Annual Revenue, 2018 To 2022 and impress your audience. This template can be altered and modified as per your expectations. So, grab it now.

Resource Planning Management Dashboard With Effective Utilization Mockup PDF
This slide shows the resourcing plan dashboard which focuses on the over and under utilization, trend by team, data by team which includes resource and utilization time of software developer, web designer and project manager. Pitch your topic with ease and precision using this Resource Planning Management Dashboard With Effective Utilization Mockup PDF. This layout presents information on Web Designer, Software Developer, Team. It is also available for immediate download and adjustment. So, changes can be made in the color, design, graphics or any other component to create a unique layout.

Advertising Solutions Company Details Operating Profit 2018 To 2022 Ppt PowerPoint Presentation Gallery Themes PDF
This slide focuses on operating profit of advertising agency for last five years from 2018 to 2022 which represents increasing trend due to reduced operating expenses. Deliver and pitch your topic in the best possible manner with this Advertising Solutions Company Details Operating Profit 2018 To 2022 Ppt PowerPoint Presentation Gallery Themes PDF. Use them to share invaluable insights on Operating Profit, 2018 To 2022, Profits Increased and impress your audience. This template can be altered and modified as per your expectations. So, grab it now.
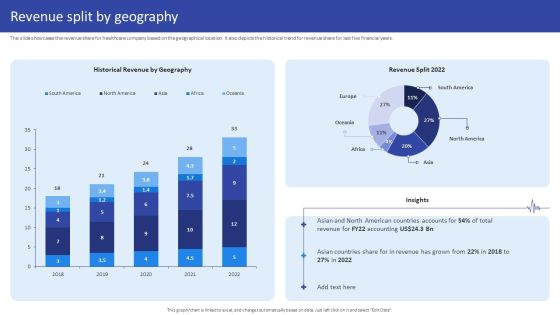
Hospital Medical Research Company Profile Revenue Split By Geography Portrait PDF
The slide showcases the revenue share for healthcare company based on the geographical location. It also depicts the historical trend for revenue share for last five financial years. Deliver and pitch your topic in the best possible manner with this Hospital Medical Research Company Profile Revenue Split By Geography Portrait PDF. Use them to share invaluable insights on Historical Revenue Geography, Revenue Split 2022, 2018 To 2022 and impress your audience. This template can be altered and modified as per your expectations. So, grab it now.
Infotech Solutions Research And Development Company Summary Company Patent Grants Icons PDF
This slide highlights the total patents granted to company in 2022 in multiple categories of IT, which includes AL and ML. cloud services, network design, cyber security and others. It also depicts historical patent trend with key insights. Deliver an awe inspiring pitch with this creative Infotech Solutions Research And Development Company Summary Company Patent Grants Icons PDF bundle. Topics like Network Design, Cyber Security, Cloud Services can be discussed with this completely editable template. It is available for immediate download depending on the needs and requirements of the user.
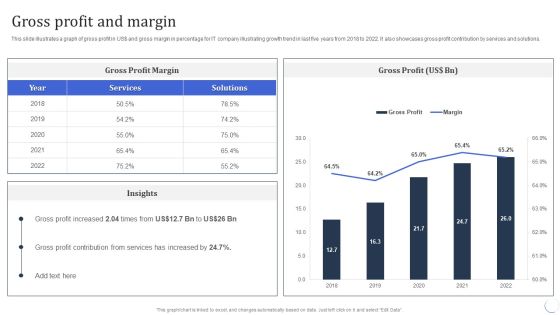
Infotech Solutions Research And Development Company Summary Gross Profit And Margin Ideas PDF
This slide illustrates a graph of gross profit in US dollar and gross margin in percentage for IT company illustrating growth trend in last five years from 2018 to 2022. It also showcases gross profit contribution by services and solutions. Deliver an awe inspiring pitch with this creative Infotech Solutions Research And Development Company Summary Gross Profit And Margin Ideas PDF bundle. Topics like Services, Gross Profit Margin can be discussed with this completely editable template. It is available for immediate download depending on the needs and requirements of the user.

Infotech Solutions Research And Development Company Summary Net Profit And Margin Information PDF
This slide illustrates a graph of net profit in US dollar and net margin in percentage for IT company illustrating growth trend in last five years from 2018 to 2022. It also showcases net profit contribution by services and solutions. Deliver and pitch your topic in the best possible manner with this Infotech Solutions Research And Development Company Summary Net Profit And Margin Information PDF. Use them to share invaluable insights on Profit Contribution, Services, Net Profit and impress your audience. This template can be altered and modified as per your expectations. So, grab it now.
Infotech Solutions Research And Development Company Summary Operating Profit And Margin Download PDF
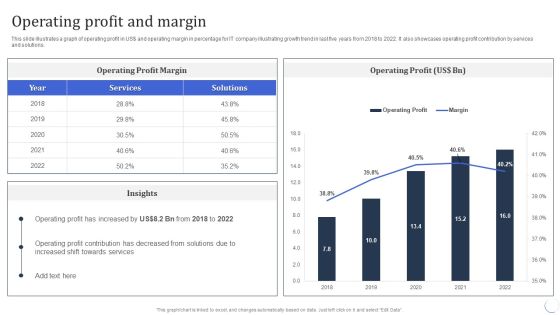
This slide illustrates a graph of operating profit in US dollar and operating margin in percentage for IT company illustrating growth trend in last five years from 2018 to 2022. It also showcases operating profit contribution by services and solutions. Deliver an awe inspiring pitch with this creative Infotech Solutions Research And Development Company Summary Operating Profit And Margin Download PDF bundle. Topics like Services, Operating Profit can be discussed with this completely editable template. It is available for immediate download depending on the needs and requirements of the user.

IT Application Services Company Outline Company Patent Grants Introduction PDF
This slide highlights the total patents granted to company in 2022 in multiple categories of IT, which includes AL and ML. cloud services, network design, cyber security and others. It also depicts historical patent trend with key insights. Deliver an awe inspiring pitch with this creative IT Application Services Company Outline Company Patent Grants Introduction PDF bundle. Topics like Approval Rate, Company Patent Grants can be discussed with this completely editable template. It is available for immediate download depending on the needs and requirements of the user.

IT Application Services Company Outline Gross Profit And Margin Elements PDF
This slide illustrates a graph of gross profit in US dollar and gross margin in percentage for IT company illustrating growth trend in last five years from 2018 to 2022. It also showcases gross profit contribution by services and solutions. Deliver an awe inspiring pitch with this creative IT Application Services Company Outline Gross Profit And Margin Elements PDF bundle. Topics like Gross Profit Margin, Services can be discussed with this completely editable template. It is available for immediate download depending on the needs and requirements of the user.

IT Application Services Company Outline Net Profit And Margin Structure PDF
This slide illustrates a graph of net profit in US dollar and net margin in percentage for IT company illustrating growth trend in last five years from 2018 to 2022. It also showcases net profit contribution by services and solutions. Deliver and pitch your topic in the best possible manner with this IT Application Services Company Outline Net Profit And Margin Structure PDF. Use them to share invaluable insights on Net Profit Margin, Services, Margin and impress your audience. This template can be altered and modified as per your expectations. So, grab it now.
IT Application Services Company Outline Operating Profit And Margin Structure PDF
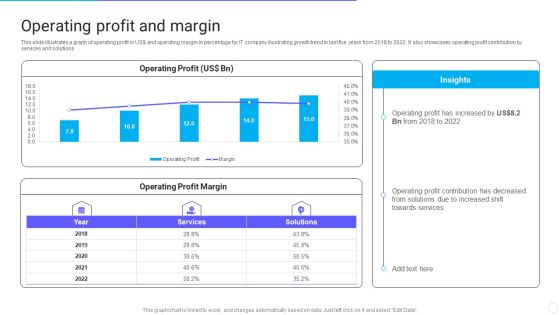
This slide illustrates a graph of operating profit in US dollar and operating margin in percentage for IT company illustrating growth trend in last five years from 2018 to 2022. It also showcases operating profit contribution by services and solutions. Deliver an awe inspiring pitch with this creative IT Application Services Company Outline Operating Profit And Margin Structure PDF bundle. Topics like Operating Profit And Margin can be discussed with this completely editable template. It is available for immediate download depending on the needs and requirements of the user.
Gross Profit And Margin IT Software Development Company Profile Slides PDF
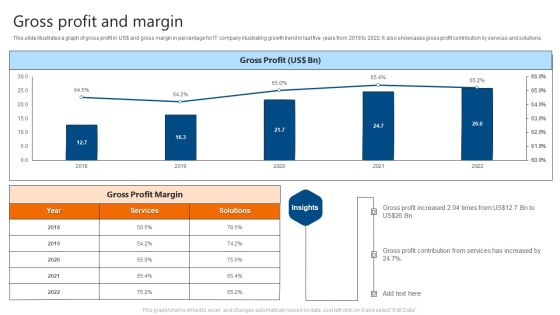
This slide illustrates a graph of gross profit in US doller and gross margin in percentage for IT company illustrating growth trend in last five years from 2018 to 2022. It also showcases gross profit contribution by services and solutions. Deliver and pitch your topic in the best possible manner with this Gross Profit And Margin IT Software Development Company Profile Slides PDF. Use them to share invaluable insights on Gross Profit, Margin and impress your audience. This template can be altered and modified as per your expectations. So, grab it now.
Net Profit And Margin IT Software Development Company Profile Icons PDF
This slide illustrates a graph of net profit in US doller and net margin in percentage for IT company illustrating growth trend in last five years from 2018 to 2022. It also showcases net profit contribution by services and solutions. Deliver an awe inspiring pitch with this creative Net Profit And Margin IT Software Development Company Profile Icons PDF bundle. Topics like Net Profit, Net Profit Margin can be discussed with this completely editable template. It is available for immediate download depending on the needs and requirements of the user.

Operating Profit And Margin IT Software Development Company Profile Guidelines PDF
This slide illustrates a graph of operating profit in US doller and operating margin in percentage for IT company illustrating growth trend in last five years from 2018 to 2022. It also showcases operating profit contribution by services and solutions. Deliver and pitch your topic in the best possible manner with this Operating Profit And Margin IT Software Development Company Profile Guidelines PDF. Use them to share invaluable insights on Operating Profit, Operating Profit Margin and impress your audience. This template can be altered and modified as per your expectations. So, grab it now.

Profit Split By Geography Life Science And Healthcare Solutions Company Profile Graphics PDF
The slide showcases the profit share for healthcare company based on the geographical location. It also depicts the historical trend for profit share for last five financial years. If your project calls for a presentation, then Slidegeeks is your go-to partner because we have professionally designed, easy-to-edit templates that are perfect for any presentation. After downloading, you can easily edit Profit Split By Geography Life Science And Healthcare Solutions Company Profile Graphics PDF and make the changes accordingly. You can rearrange slides or fill them with different images. Check out all the handy templates

Boosting Product Sales Through Branding Number Of Products Sold In Last Summary PDF
This slide covers the number of products sold by the company in last 6 years which shows the declining trend due to no unique value proposition, lack of competitor analysis that fails to generate demand by customers. If your project calls for a presentation, then Slidegeeks is your go-to partner because we have professionally designed, easy-to-edit templates that are perfect for any presentation. After downloading, you can easily edit Boosting Product Sales Through Branding Number Of Products Sold In Last Summary PDF and make the changes accordingly. You can rearrange slides or fill them with different images. Check out all the handy templates.

Stock Market Trading Strategies For Various Types Of Investors Demonstration PDF
This slide represents different trading approaches for every trader which helps them to build plan, test new techniques for financial gains and improve existing position. Trading techniques included in this slide are new, end-of-day, swing, trend and position. Pitch your topic with ease and precision using this Stock Market Trading Strategies For Various Types Of Investors Demonstration PDF. This layout presents information on Market Expectations, Risk Management, Price. It is also available for immediate download and adjustment. So, changes can be made in the color, design, graphics or any other component to create a unique layout.
Playbook For Enterprise Transformation Administration Introduction To The Playbook Graphics PDF
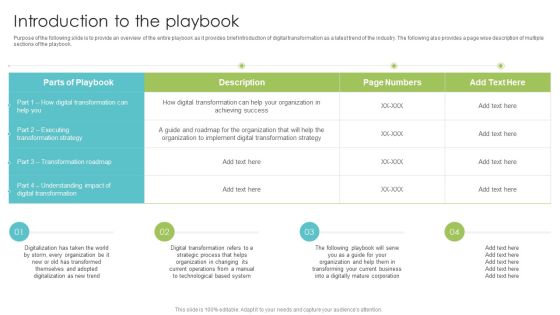
Purpose of the following slide is to provide an overview of the entire playbook as it provides brief introduction of digital transformation as a latest trend of the industry. The following also provides a page wise description of multiple sections of the playbook. Deliver an awe inspiring pitch with this creative Playbook For Enterprise Transformation Administration Introduction To The Playbook Graphics PDF bundle. Topics like Organization, Technological, Strategic Process can be discussed with this completely editable template. It is available for immediate download depending on the needs and requirements of the user.

Most Common Google Keyword Assessment Challenges With Solutions Introduction PDF
Following slide illustrates various challenges faced by research analyst in keyword analysis with respective solutions to increase business competitive advantage. It includes challenges such as key usage in content, keyword quality, trend impact on keywords and keyword relevance for SEO and social media Persuade your audience using this Most Common Google Keyword Assessment Challenges With Solutions Introduction PDF. This PPT design covers two stages, thus making it a great tool to use. It also caters to a variety of topics including Determine Keyword Quality, Requirement, Keyword Optimization. Download this PPT design now to present a convincing pitch that not only emphasizes the topic but also showcases your presentation skills.

Editable PowerPoint Template Parellel Representation Of 8 Issues Graphic
We present our editable PowerPoint template parellel representation of 8 issues Graphic.Use our Arrows PowerPoint Templates because, they help to lay the base of your trend of thought. Use our Symbol PowerPoint Templates because, Our Template designs are State of the Art. Use our Business PowerPoint Templates because, Business 3D Circular Puzzle: - Your business and plans for its growth consist of processes that are highly co-related. Use our Process and flows PowerPoint Templates because, Now you have to coordinate and motivate your team. Use our Marketing PowerPoint Templates because, However it requires care and diligence to function well. Use these PowerPoint slides for presentations relating to Arrow, background, business, chart, diagram, financial, flow, graphic, gray, icon, management, orange, perspective, process, reflection, spheres, shapes, symbol, and marketing. The prominent colors used in the PowerPoint template are Yellow, Gray, and White

Flow PowerPoint Template Parellel Demonstration Of 7 Concepts Graphics
We present our flow PowerPoint template parallel demonstration of 7 concepts graphics. Use our Symbol PowerPoint Templates because, Team Efforts Business Template: - The concept and strategy is your strength. Use our Metaphor PowerPoint Templates because, they help to lay the base of your trend of thought. Use our Process and Flows PowerPoint Templates because, Now you have to coordinate and motivate your team. Use our Business PowerPoint Templates because, Marketing Strategy Business Template: - Maximizing sales of your product is the intended destination. Use our Arrows PowerPoint Templates because, Heighten the anticipation of your audience with this slide listing .Use these PowerPoint slides for presentations relating to Arrow, Background, Business, Chart, Diagram, Financial, Flow, Graphic, Gray, Icon, Illustration, Linear, Management, Orange, Perspective, Process, Reflection, Spheres, Stage, Text. The prominent colors used in the PowerPoint template are Yellow, Gray, and White

Energy Efficiency Dashboard To Track Campaign Effectiveness Pictures PDF
This slide consists of a dashboard which presents an energy saving dashboard which can be used to track effectiveness of energy saving program. The key performance indicators relate to energy sources, energy consumption by sectors, energy consumption by sectors etc. Pitch your topic with ease and precision using this Energy Efficiency Dashboard To Track Campaign Effectiveness Pictures PDF. This layout presents information on Energy Sources, Energy Usage, Trend Analysis. It is also available for immediate download and adjustment. So, changes can be made in the color, design, graphics or any other component to create a unique layout.

Editable Ppt Theme Arrow Process 7 Stages Operations Management PowerPoint 3 Graphic
editable PPT Theme arrow process 7 stages operations management powerpoint 3 Graphic-This arrow process diagram is a type of graphics that shows how items are related to one another. Use this graphic to represent a continuing sequence of stages, tasks, or events. It helps to lay the base of your trend of thought.-editable PPT Theme arrow process 7 stages operations management powerpoint 3 Graphic-Advertising, Arrow, Concept, Corporate, Creative, Design, Direction, Flow, Illustration, Info, Graphic, Instruction, Label, Layout, Manual, Modern, Number, Offer, Order, Pointer, Product, Progress, Promotion, Sequence, Special, Step, Symbol

Map Of America With Percentage Data PowerPoint Slides
Nothing can explain locations better than a map itself. Then why not use it to make your PowerPoint presentation more visual, interesting and the one which leaves a good impression. If you have business around North and South America or your company or organization has clients or industries located in these 2 continents, then we have the perfect slide for you. You can effectively use this slide to show the distribution of clients or any other factor in percentage basis. The creatively designed map can also be used to show a comparison of your user?s location. This can also be an ideal slide to explain the travel and tourism trend prevailing in the continents. This slide is customizable and the icons can be placed anywhere on the map as per the need of the presentation.
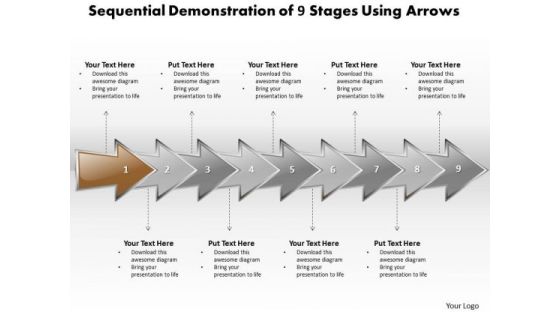
Ppt Sequential Evaluation Of 9 Stages Using Curved Arrows PowerPoint 2010 Templates
PPT sequential evaluation of 9 stages using curved arrows powerpoint 2010 Templates-You are buzzing with ideas. Use our Curved arrow diagram to enthuse your colleagues. It helps to lay the base of your trend of thought-PPT sequential evaluation of 9 stages using curved arrows powerpoint 2010 Templates-action, arrow, badge, banner, blank, business, button, collection, colorful, concern, connect, decoration, design, direction, element, financial, flow, graph, instruction, involve, label, link, method, navigation, operate, procedure, process, relate, sequence, sequent, series, shape, stage, step, successive, technique
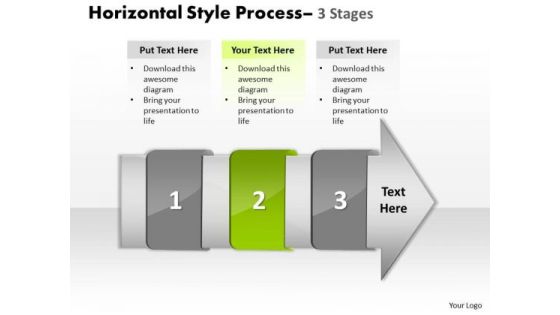
Ppt Theme Horizontal To Vertical Text Steps Working With Slide Numbers Demonstration 3 Graphic
We present our PPT Theme horizontal to vertical text steps working with slide numbers demonstration 3 Graphic. Use our Arrows PowerPoint Templates because, they help to lay the base of your trend of thought. Use our Shapes PowerPoint Templates because, Core Diagram: - Explore the various hues and layers existing in you are in your plans and processes. Use our Finance PowerPoint Templates because, Many a core idea has various enveloping layers. Use our Business PowerPoint Templates because, Marketing Strategy Business Template: - Maximizing sales of your product is the intended destination. Use our Process and Flows PowerPoint Templates because, are the stepping stones of our journey till date. Use these PowerPoint slides for presentations relating to accent, advertisement, arrow, badge, banner, business, button, collection, color, decoration, design, direction, element, financial, flow, graph, horizontal, instruction, isolated, label, manual, message, process, sale, set, shape, steps, symbol, template. The prominent colors used in the PowerPoint template are Green, Gray, and Black

Global Cosmetics Market Future Outlook Ppt Show Graphics Template PDF
This slide consists of a graph that depicts the Global Cosmetics Market Size trend from the years 2017 to 2025 along with the key facts of the industry. Presenting global cosmetics market future outlook ppt show graphics template pdf to provide visual cues and insights. Share and navigate important information on one stage that need your due attention. This template can be used to pitch topics like market growth, product manufacturers, market size. In addition, this PPT design contains high-resolution images, graphics, etc, that are easily editable and available for immediate download.

After IPO Equity Company Future Opportunities For Growth Diagrams PDF
This slide Provides the opportunities for the company growth like investment in online platform, growing fast food trend in the market etc. This is a after ipo equity company future opportunities for growth diagrams pdf template with various stages. Focus and dispense information on four stages using this creative set, that comes with editable features. It contains large content boxes to add your information on topics like opportunities, investment, market. You can also showcase facts, figures, and other relevant content using this PPT layout. Grab it now.
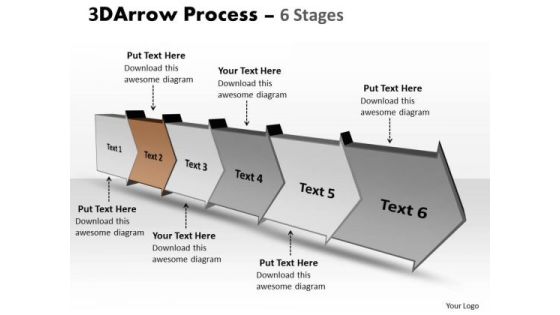
Ppt Template 3d Illustration Of Six Step Arrow Process Time Management PowerPoint Graphic
We present our PPT template 3d illustration of six step arrow Process time management PowerPoint Graphic. Use our Arrows PowerPoint Templates because, Saves your time a prized possession, an ideal aid to give an ideal presentation. Use our Shapes PowerPoint Templates because, Like your thoughts arrows are inherently precise and true. Use our Signs PowerPoint Templates because, Business ethics is an essential element in your growth. Use our Process and Flows PowerPoint Templates because; illustrate your thoughts and experiences to your staff. Use our Business PowerPoint Templates because, they help to lay the base of your trend of thought. Use these PowerPoint slides for presentations relating to 3d, Arrow, Background, Bullet, Business, Chart, Checkmark, Chevron, Diagram, Drop, Eps10, Financial, Five, Glass, Graphic, Gray, Icon, Illustration, Management, Point, Process, Project, Reflection, Set, Shadow, Stage, Text, Transparency, Vector. The prominent colors used in the PowerPoint template are Brown, Gray, and Black
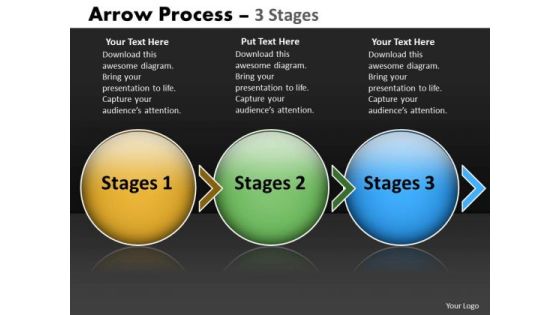
PowerPoint Template Evolution Of Three Stages Circular 3d Arrows Image
We present our PowerPoint template evolution of three stages circular 3d arrows Image. Use our Spheres PowerPoint Templates because, Leadership Template: - Show them the way, be Captain of the ship and lead them to new shores. Use our Arrows PowerPoint Templates because, Amplify on your plans to have dedicated sub groups working on related but distinct tasks. Use our Shapes PowerPoint Templates because, Activities which in themselves have many inherent business opportunities. Use our Business PowerPoint Templates because, they help to lay the base of your trend of thought. Use our Process and Flows PowerPoint Templates because; Outline your targets to your team. Use these PowerPoint slides for presentations relating to Arrow, Background, Business, Chart, Diagram, Financial, Graphic, Gray, Icon, Illustration, Management,, Perspective, Planning, Process, Stages, Steps, Spheres, Text. The prominent colors used in the PowerPoint template are Yellow, Green, and Blue
 Home
Home