AI PPT Maker
Templates
PPT Bundles
Design Services
Business PPTs
Business Plan
Management
Strategy
Introduction PPT
Roadmap
Self Introduction
Timelines
Process
Marketing
Agenda
Technology
Medical
Startup Business Plan
Cyber Security
Dashboards
SWOT
Proposals
Education
Pitch Deck
Digital Marketing
KPIs
Project Management
Product Management
Artificial Intelligence
Target Market
Communication
Supply Chain
Google Slides
Research Services
 One Pagers
All Categories
-
Home
- Customer Favorites
- Business Snapshot
Business Snapshot
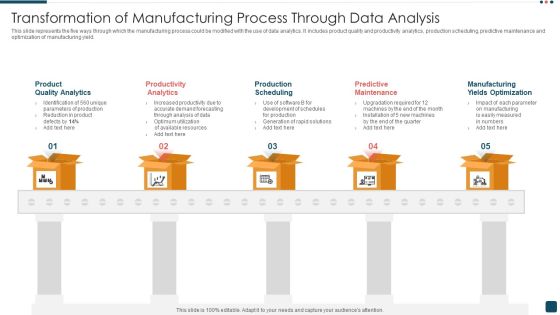
Transformation Of Manufacturing Process Through Data Analysis Download PDF
This slide represents the five ways through which the manufacturing process could be modified with the use of data analytics. It includes product quality and productivity analytics, production scheduling, predictive maintenance and optimization of manufacturing yield. Persuade your audience using this Transformation Of Manufacturing Process Through Data Analysis Download PDF. This PPT design covers five stages, thus making it a great tool to use. It also caters to a variety of topics including Product Quality Analytics, Productivity Analytics, Production Scheduling. Download this PPT design now to present a convincing pitch that not only emphasizes the topic but also showcases your presentation skills.

Revenue Split By Product Segment Template Ppt PowerPoint Presentation Pictures Professional
This is a revenue split by product segment template ppt powerpoint presentation pictures professional. This is a four stage process. The stages in this process are table, data analysis, business, marketing, compare.
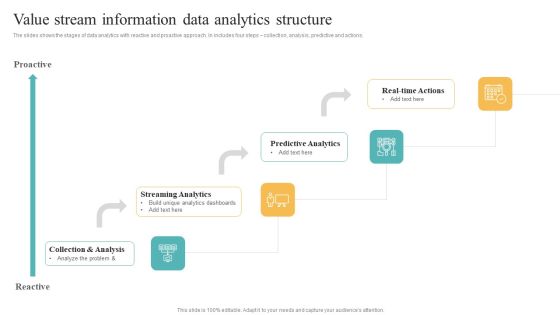
Transformation Toolkit Competitive Intelligence Information Analysis Value Stream Information Data Analytics Structure Infographics PDF
The slides shows the stages of data analytics with reactive and proactive approach. In includes four steps collection, analysis, predictive and actions. Present like a pro with Transformation Toolkit Competitive Intelligence Information Analysis Value Stream Information Data Analytics Structure Infographics PDF Create beautiful presentations together with your team, using our easy to use presentation slides. Share your ideas in real time and make changes on the fly by downloading our templates. So whether you are in the office, on the go, or in a remote location, you can stay in sync with your team and present your ideas with confidence. With Slidegeeks presentation got a whole lot easier. Grab these presentations today.

Data Metrics Inside Application Ppt PowerPoint Presentation File Show Cpb Pdf
Presenting this set of slides with name data metrics inside application ppt powerpoint presentation file show cpb pdf. This is an editable Powerpoint three stages graphic that deals with topics like data analytics reporting structure to help convey your message better graphically. This product is a premium product available for immediate download and is 100 percent editable in Powerpoint. Download this now and use it in your presentations to impress your audience.
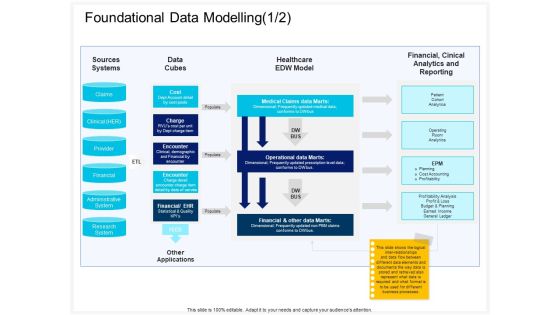
Enterprise Problem Solving And Intellect Foundational Data Modelling Applications Ppt PowerPoint Presentation Inspiration Example Introduction PDF
Presenting this set of slides with name enterprise problem solving and intellect foundational data modelling applications ppt powerpoint presentation inspiration example introduction pdf. This is a one stage process. The stages in this process are sources systems, data cubes, healthcare, edw model, financial, cinical analytics and reporting, cost, charge, encounter. This is a completely editable PowerPoint presentation and is available for immediate download. Download now and impress your audience.

Information Analysis And BI Playbook Final Thoughts For Data Analytics Playbook Designs PDF
This template covers the data analytics company final thoughts at the end of the e book. Do you have to make sure that everyone on your team knows about any specific topic I yes, then you should give Information Analysis And BI Playbook Final Thoughts For Data Analytics Playbook Designs PDF a try. Our experts have put a lot of knowledge and effort into creating this impeccable Information Analysis And BI Playbook Final Thoughts For Data Analytics Playbook Designs PDF. You can use this template for your upcoming presentations, as the slides are perfect to represent even the tiniest detail. You can download these templates from the Slidegeeks website and these are easy to edit. So grab these today.
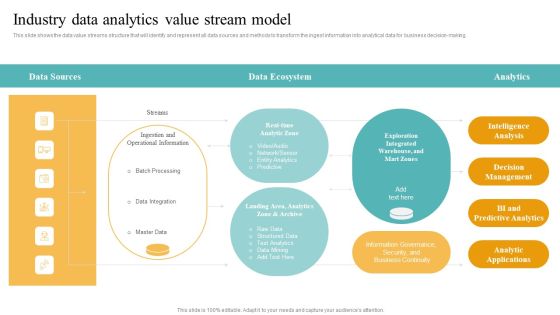
Transformation Toolkit Competitive Intelligence Information Analysis Industry Data Analytics Value Stream Model Raw Mockup PDF
This slide illustrates the workflow related to performing the data analytics project along with key responsible owners to accomplish the activities. If you are looking for a format to display your unique thoughts, then the professionally designed Transformation Toolkit Competitive Intelligence Information Analysis Industry Data Analytics Value Stream Model Raw Mockup PDF is the one for you. You can use it as a Google Slides template or a PowerPoint template. Incorporate impressive visuals, symbols, images, and other charts. Modify or reorganize the text boxes as you desire. Experiment with shade schemes and font pairings. Alter, share or cooperate with other people on your work. Download Transformation Toolkit Competitive Intelligence Information Analysis Industry Data Analytics Value Stream Model Raw Mockup PDF and find out how to give a successful presentation. Present a perfect display to your team and make your presentation unforgettable.

Marketers Guide To Data Analysis Optimization Introduction To Marketing Analytics For Strategic Decision Making Icons PDF
This slide covers a brief overview of data analytics to assess the effectiveness of marketing activities. It also includes focus areas such as product intelligence, customer trends, preferences, customer support, messaging, and media. Explore a selection of the finest Marketers Guide To Data Analysis Optimization Introduction To Marketing Analytics For Strategic Decision Making Icons PDF here. With a plethora of professionally designed and pre made slide templates, you can quickly and easily find the right one for your upcoming presentation. You can use our Marketers Guide To Data Analysis Optimization Introduction To Marketing Analytics For Strategic Decision Making Icons PDF to effectively convey your message to a wider audience. Slidegeeks has done a lot of research before preparing these presentation templates. The content can be personalized and the slides are highly editable. Grab templates today from Slidegeeks.

Data Requirements For Analytics Collection And Analysis Sources To Improve Marketing Strategies Download PDF
The following slide indicates the sources to collect the data for analysis to improve marketing strategies. The major sources for data collection highlighted are emails, landing pages, point od sales etc. Persuade your audience using this data requirements for analytics collection and analysis sources to improve marketing strategies download pdf. This PPT design covers four stages, thus making it a great tool to use. It also caters to a variety of topics including emails, management, customers. Download this PPT design now to present a convincing pitch that not only emphasizes the topic but also showcases your presentation skills.

Transformation Toolkit Competitive Intelligence Information Analysis Work Streams For Data Analytics Infographics PDF
This slide shows the work streams structure with team head for implementing the data analytics project. If your project calls for a presentation, then Slidegeeks is your go to partner because we have professionally designed, easy to edit templates that are perfect for any presentation. After downloading, you can easily edit Transformation Toolkit Competitive Intelligence Information Analysis Work Streams For Data Analytics Infographics PDF and make the changes accordingly. You can rearrange slides or fill them with different images. Check out all the handy templates.

Predictive Analytics In The Age Of Big Data Predictive Analytics In Align Sales And Marketing Better Topics PDF
This slide describes how predictive analytics can help align sales and marketing better. Predictive analytics can help get insights from sales and marketing teams that can help to improve several factors, including handing off leads, communication of promotions, and so on. This modern and well arranged Predictive Analytics In The Age Of Big Data Predictive Analytics In Align Sales And Marketing Better Topics PDF provides lots of creative possibilities. It is very simple to customize and edit with the Powerpoint Software. Just drag and drop your pictures into the shapes. All facets of this template can be edited with Powerpoint no extra software is necessary. Add your own material, put your images in the places assigned for them, adjust the colors, and then you can show your slides to the world, with an animated slide included.
Transformation Toolkit Competitive Intelligence Information Analysis Key Failure Reasons For Data Analytics Project Icons PDF
This slide displays the key reasons for why the data analytics project fails. It includes reasons such as incorrect data, poor communication structure, and conflicting data etc. Coming up with a presentation necessitates that the majority of the effort goes into the content and the message you intend to convey. The visuals of a PowerPoint presentation can only be effective if it supplements and supports the story that is being told. Keeping this in mind our experts created Transformation Toolkit Competitive Intelligence Information Analysis Key Failure Reasons For Data Analytics Project Icons PDF to reduce the time that goes into designing the presentation. This way, you can concentrate on the message while our designers take care of providing you with the right template for the situation.

Transformation Toolkit Competitive Intelligence Information Analysis Data Analytics Software Features Template PDF
This slide represents the key features of predictive data analytics including data mining, data visualization, and modelling etc. Coming up with a presentation necessitates that the majority of the effort goes into the content and the message you intend to convey. The visuals of a PowerPoint presentation can only be effective if it supplements and supports the story that is being told. Keeping this in mind our experts created Transformation Toolkit Competitive Intelligence Information Analysis Data Analytics Software Features Template PDF to reduce the time that goes into designing the presentation. This way, you can concentrate on the message while our designers take care of providing you with the right template for the situation.

Marketers Guide To Data Analysis Optimization Major Types Of Marketing Analytics Models Microsoft PDF
This slide covers three types of models to conduct marketing analytics. The mentioned models are descriptive models to identify what happened, predictive models to know what will happen, and prescriptive models to determine how to make it happen. Take your projects to the next level with our ultimate collection of Marketers Guide To Data Analysis Optimization Major Types Of Marketing Analytics Models Microsoft PDF. Slidegeeks has designed a range of layouts that are perfect for representing task or activity duration, keeping track of all your deadlines at a glance. Tailor these designs to your exact needs and give them a truly corporate look with your own brand colors they will make your projects stand out from the rest.
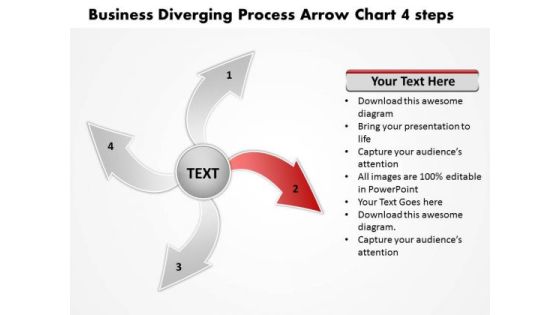
Presentation Diverging Process Arrow Chart 4 Steps Circular PowerPoint Templates
We present our presentation diverging process arrow chart 4 steps Circular PowerPoint templates.Download our Arrows PowerPoint Templates because you can illustrate your ideas and imprint them in the minds of your team with this template. Present our Process and flows PowerPoint Templates because your marketing strategies can funnel down to the cone, stage by stage, refining as you go along. Download our Flow Charts PowerPoint Templates because this slide helps you to give your team an overview of your capability and insight into the minute details of the overall picture highlighting the interdependence at every operational level. Use our Marketing PowerPoint Templates because networking is an imperative in todays world. You need to access the views of others. Similarly you need to give access to them of your abilities. Download our Business PowerPoint Templates because this layout helps you to bring some important aspects of your business process to the notice of all concerned. Streamline the flow of information across the board.Use these PowerPoint slides for presentations relating to Arrow, background, banner,red, concept,creative, design, direction, flow, ten,illustration, infographic, instruction, label,layout, manual, marketing, modern, next,number, offer, one, options, order,pointer, process, product,promotion, sequence, simple, special,step, symbol. The prominent colors used in the PowerPoint template are Red, Blue, Black. Customers tell us our presentation diverging process arrow chart 4 steps Circular PowerPoint templates are specially created by a professional team with vast experience. They diligently strive to come up with the right vehicle for your brilliant Ideas. We assure you our design PowerPoint templates and PPT Slides are Breathtaking. PowerPoint presentation experts tell us our presentation diverging process arrow chart 4 steps Circular PowerPoint templates are second to none. People tell us our flow PowerPoint templates and PPT Slides are Attractive. We assure you our presentation diverging process arrow chart 4 steps Circular PowerPoint templates are Radiant. Use our creative PowerPoint templates and PPT Slides are specially created by a professional team with vast experience. They diligently strive to come up with the right vehicle for your brilliant Ideas.

Executing Advance Data Analytics At Workspace Impact Analysis Of Successful Designs PDF
This slide depicts the impact of successful implementation of infrastructure intelligence in terms improved incident management and customer satisfaction and also depicts that how much the focus area has been improved from the previous state. This is a executing advance data analytics at workspace impact analysis of successful designs pdf template with various stages. Focus and dispense information on four stages using this creative set, that comes with editable features. It contains large content boxes to add your information on topics like impact analysis of successful infrastructure intelligence implementation. You can also showcase facts, figures, and other relevant content using this PPT layout. Grab it now.
Executing Advance Data Analytics At Workspace Impact Analysis Of Successful Icons PDF
This slide depicts the impact of successful implementation of infrastructure intelligence in terms improved incident management and customer satisfaction and also depicts that how much the focus area has been improved from the previous state. This is a executing advance data analytics at workspace impact analysis of successful icons pdf template with various stages. Focus and dispense information on four stages using this creative set, that comes with editable features. It contains large content boxes to add your information on topics like impact analysis of successful infrastructure intelligence implementation. You can also showcase facts, figures, and other relevant content using this PPT layout. Grab it now.

Comprehensive Analysis Of Different Data Lineage Classification Five Ws Of Data Lineage System Designs PDF
This slide outlines the five Ws of the data lineage system and includes who, what, why, where and when. Each contains a list of questions that help perform data lineage and carry out valuable insights from the information. The Comprehensive Analysis Of Different Data Lineage Classification Five Ws Of Data Lineage System Designs PDF is a compilation of the most recent design trends as a series of slides. It is suitable for any subject or industry presentation, containing attractive visuals and photo spots for businesses to clearly express their messages. This template contains a variety of slides for the user to input data, such as structures to contrast two elements, bullet points, and slides for written information. Slidegeeks is prepared to create an impression.
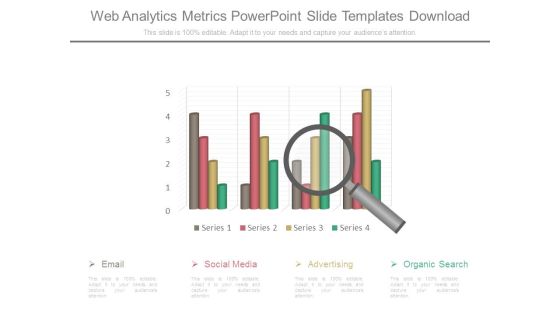
Web Analytics Metrics Powerpoint Slide Templates Download
This is a web analytics metrics powerpoint slide templates download. This is a one stage process. The stages in this process are email, social media, advertising, organic search.

Virtual WAN Architecture Overview Of Software Defined Wan Architecture Layers Icons PDF
This slide describes the overview of SD-WAN architectural layers, including orchestration and analytics, virtual service delivery, and secure cloud network. The purpose of this slide is to highlight the main features and functions of SD-WAN layers. Get a simple yet stunning designed Virtual WAN Architecture Overview Of Software Defined Wan Architecture Layers Icons PDF. It is the best one to establish the tone in your meetings. It is an excellent way to make your presentations highly effective. So, download this PPT today from Slidegeeks and see the positive impacts. Our easy-to-edit Virtual WAN Architecture Overview Of Software Defined Wan Architecture Layers Icons PDF can be your go-to option for all upcoming conferences and meetings. So, what are you waiting for Grab this template today.

Product Wise Pipeline Analysis Ppt PowerPoint Presentation Professional Files
This is a our goal ppt powerpoint presentation slides files. This is a four stage process. The stages in this process are business, marketing, strategy, planning, icons.

Transformation Toolkit Competitive Intelligence Information Analysis Priority Checklist For Data Analytics Program Inspiration PDF
The slide displays the to do list that allows to set the high priority task at first and least priority at last to ensure consistency and completeness while performing the process. Slidegeeks has constructed Transformation Toolkit Competitive Intelligence Information Analysis Priority Checklist For Data Analytics Program Inspiration PDF after conducting extensive research and examination. These presentation templates are constantly being generated and modified based on user preferences and critiques from editors. Here, you will find the most attractive templates for a range of purposes while taking into account ratings and remarks from users regarding the content. This is an excellent jumping off point to explore our content and will give new users an insight into our top notch PowerPoint Templates.
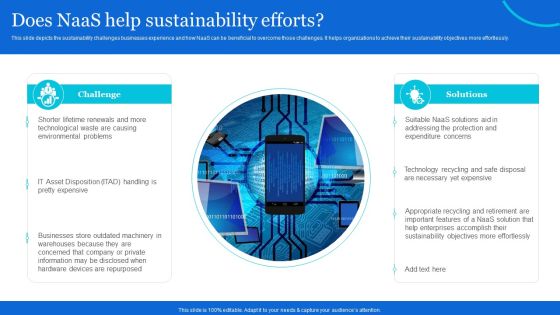
Naas Architectural Framework Does Naas Help Sustainability Efforts Sample PDF
This slide depicts the sustainability challenges businesses experience and how NaaS can be beneficial to overcome those challenges. It helps organizations to achieve their sustainability objectives more effortlessly. Slidegeeks is here to make your presentations a breeze with Naas Architectural Framework Does Naas Help Sustainability Efforts Sample PDF With our easy-to-use and customizable templates, you can focus on delivering your ideas rather than worrying about formatting. With a variety of designs to choose from, youre sure to find one that suits your needs. And with animations and unique photos, illustrations, and fonts, you can make your presentation pop. So whether youre giving a sales pitch or presenting to the board, make sure to check out Slidegeeks first.
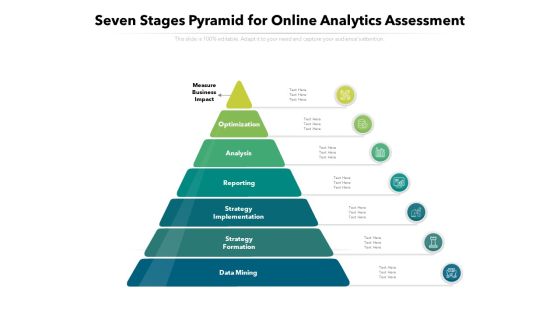
Seven Stages Pyramid For Online Analytics Assessment Ppt PowerPoint Presentation Summary Inspiration PDF
Presenting this set of slides with name seven stages pyramid for online analytics assessment ppt powerpoint presentation summary inspiration pdf. This is a seven stage process. The stages in this process are optimization, analysis, reporting, strategy implementation, strategy formation, data mining. This is a completely editable PowerPoint presentation and is available for immediate download. Download now and impress your audience.
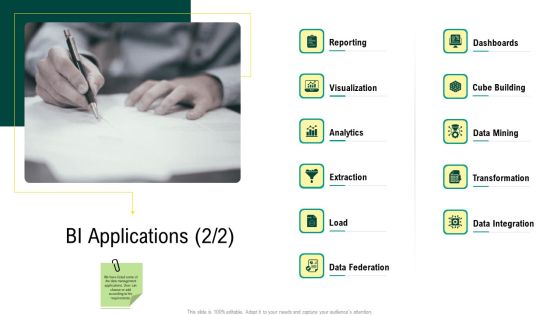
Expert Systems BI Applications Analytics Sample PDF
Presenting expert systems bi applications analytics sample pdf to provide visual cues and insights. Share and navigate important information on elven stages that need your due attention. This template can be used to pitch topics like reporting, visualization, analytics, extraction, data mining, cube building, transformation. In addtion, this PPT design contains high-resolution images, graphics, etc, that are easily editable and available for immediate download.

Market Analysis Ppt PowerPoint Presentation Introduction
This is a market analysis ppt powerpoint presentation introduction. This is a six stage process. The stages in this process are business, marketing, analysis, strategy, chart and graph, growth.
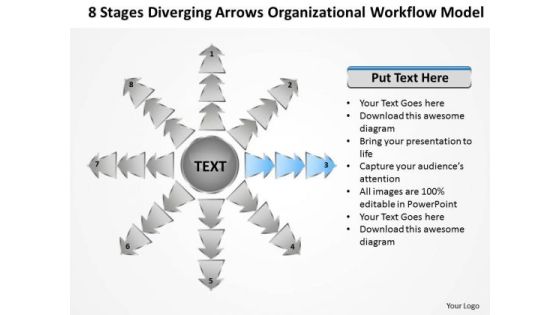
Diverging Arrows Organizational Workflow Model Cycle Process Diagram PowerPoint Slide
We present our diverging arrows organizational workflow model Cycle Process Diagram PowerPoint Slide.Download our Process and Flows PowerPoint Templates because you have the entire picture in mind. Download and present our Arrows PowerPoint Templates because this is the unerring accuracy in reaching the target. the effortless ability to launch into flight. Download and present our Flow Charts PowerPoint Templates because this diagram helps to reaffirm to your team your faith in maintaining the highest ethical standards. Download our Marketing PowerPoint Templates because networking is an imperative in todays world. You need to access the views of others. Similarly you need to give access to them of your abilities. Download our Business PowerPoint Templates because your product has established a foothold in the market. Customers are happy with the value it brings to their lives.Use these PowerPoint slides for presentations relating to Arrow, art, artistic,background, caricature, chart, childish,circular, creative, design, diagram,doodle, draw, flow, graffiti, graphic,grunge, hand, handwritten, icon,illustration, image, isolated, object, pie, pieces, process, raster,report, retro, rough, scribble, segmented, simple, sketch, sketchy, slices,statistic, styling, succeed, success,symbol. The prominent colors used in the PowerPoint template are Yellow, Black, Gray. Professionals tell us our diverging arrows organizational workflow model Cycle Process Diagram PowerPoint Slide are Fun. People tell us our circular PowerPoint templates and PPT Slides are Efficacious. The feedback we get is that our diverging arrows organizational workflow model Cycle Process Diagram PowerPoint Slide will get their audience's attention. Presenters tell us our background PowerPoint templates and PPT Slides are Luxuriant. You can be sure our diverging arrows organizational workflow model Cycle Process Diagram PowerPoint Slide are Breathtaking. PowerPoint presentation experts tell us our circular PowerPoint templates and PPT Slides are Charming.
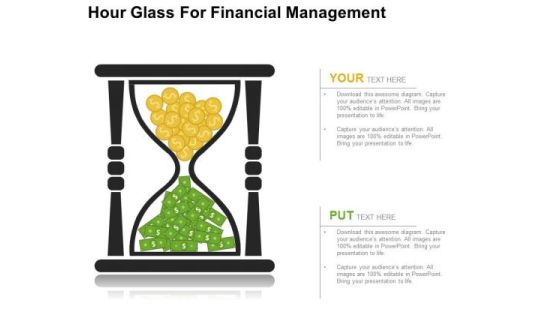
Hour Glass For Financial Management PowerPoint Templates
Create dynamic presentations with this professional slide containing a graphic of hour glass with dollar currency notes and coins. This template is designed to portray the concepts of financial management. Add this slide in your presentations to visually support your content
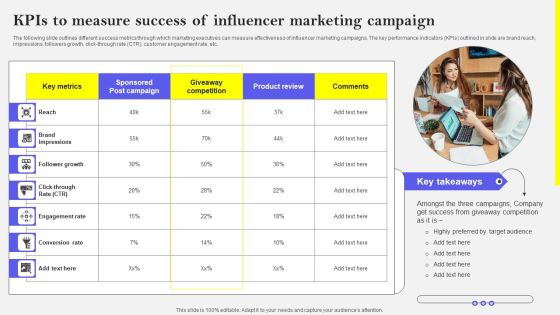
Kpis To Measure Success Of Influencer Marketing Campaign Formats PDF
The following slide outlines different success metrics through which marketing executives can measure effectiveness of influencer marketing campaigns. The key performance indicators KPIs outlined in slide are brand reach, impressions, followers growth, click-through rate CTR, customer engagement rate, etc. The best PPT templates are a great way to save time, energy, and resources. Slidegeeks have 100 percent editable powerpoint slides making them incredibly versatile. With these quality presentation templates, you can create a captivating and memorable presentation by combining visually appealing slides and effectively communicating your message. Download Kpis To Measure Success Of Influencer Marketing Campaign Formats PDF from Slidegeeks and deliver a wonderful presentation.

Data Analytics IT Prerequisites For Data Science Before Implementing In The Organization Information PDF
This slide represents the prerequisites for data science that include knowledge of machine learning, modeling, statistic, database, and programming languages. Presenting data analytics it prerequisites for data science before implementing in the organization information pdf to provide visual cues and insights. Share and navigate important information on five stages that need your due attention. This template can be used to pitch topics like machine learning, statistic, modeling, programming, databases. In addtion, this PPT design contains high resolution images, graphics, etc, that are easily editable and available for immediate download.

Optimizing Marketing Analytics To Enhance Organizational Growth Tracking Followers Count To Improve Professional PDF
The Optimizing Marketing Analytics To Enhance Organizational Growth Tracking Followers Count To Improve Professional PDF is a compilation of the most recent design trends as a series of slides. It is suitable for any subject or industry presentation, containing attractive visuals and photo spots for businesses to clearly express their messages. This template contains a variety of slides for the user to input data, such as structures to contrast two elements, bullet points, and slides for written information. Slidegeeks is prepared to create an impression.

Technology Disaster Recovery Plan Data Loss Statistics Due To Lack Of DRP Guidelines PDF
This slide depicts why a disaster recovery plan is essential for businesses and how small and medium sized enterprises lose their revenue due to downtime and no DR plan. Presenting Technology Disaster Recovery Plan Data Loss Statistics Due To Lack Of DRP Guidelines PDF to provide visual cues and insights. Share and navigate important information on five stages that need your due attention. This template can be used to pitch topics like Recovery System, Businesses, Enterprises. In addtion, this PPT design contains high resolution images, graphics, etc, that are easily editable and available for immediate download.

Graphical Exploratory Data Analysis Powerpoint Slides Clipart
This is a graphical exploratory data analysis powerpoint slides clipart. This is a five stage process. The stages in this process are techniques, information, predictive, focuses, business.

Software Development Life Cycle Planning Security Criteria And Control Measures For IT System Vulnerabilities Brochure PDF
This slide highlights the security criteria for information technology system vulnerabilities with security area which includes management security, operational security and technical security. The Software Development Life Cycle Planning Security Criteria And Control Measures For IT System Vulnerabilities Brochure PDF is a compilation of the most recent design trends as a series of slides. It is suitable for any subject or industry presentation, containing attractive visuals and photo spots for businesses to clearly express their messages. This template contains a variety of slides for the user to input data, such as structures to contrast two elements, bullet points, and slides for written information. Slidegeeks is prepared to create an impression.

Strategies For Effective Leadership SWOT Analysis Portrait PDF
The Strategies For Effective Leadership SWOT Analysis Portrait PDF is a compilation of the most recent design trends as a series of slides. It is suitable for any subject or industry presentation, containing attractive visuals and photo spots for businesses to clearly express their messages. This template contains a variety of slides for the user to input data, such as structures to contrast two elements, bullet points, and slides for written information. Slidegeeks is prepared to create an impression.

Ecommerce Operations Management Metrics To Measure Performance Professional PDF
This slide showcases essential metrics of e-commerce to make informed decisions. Major key performance indicators covered are website traffic, shopping cart abandonment rate, revenue per visitor and on time delivery rate. Presenting Ecommerce Operations Management Metrics To Measure Performance Professional PDF to dispense important information. This template comprises one stage. It also presents valuable insights into the topics including Abandonment Rate, Industry Benchmark, Performance. This is a completely customizable PowerPoint theme that can be put to use immediately. So, download it and address the topic impactfully.

Tools For Customer Service Metrics Measurement And Tracking Download PDF
This slide showcases tools that can help to measure and track the customer service metrics. Its key components are tools, features, free trial, paid version and user reviews. Persuade your audience using this Tools For Customer Service Metrics Measurement And Tracking Download PDF. This PPT design covers four stages, thus making it a great tool to use. It also caters to a variety of topics including Data Visualization, Custom Reports, Goal Tracking. Download this PPT design now to present a convincing pitch that not only emphasizes the topic but also showcases your presentation skills.

Table Of Contents Digital Marketing Techniques To Improve Lead Conversion Rates Key Topics PDF
This is a Table Of Contents Digital Marketing Techniques To Improve Lead Conversion Rates Key Topics PDF template with various stages. Focus and dispense information on eight stages using this creative set, that comes with editable features. It contains large content boxes to add your information on topics like Social Media, Marketing Plan, Dashboards And Metrics. You can also showcase facts, figures, and other relevant content using this PPT layout. Grab it now.

Toolkit For Data Science And Analytics Transition Key Consideration To Implement Data Analytics Guidelines PDF
This slide show the roadmap of essential consideration for performing data analytics in business. Do you have an important presentation coming up Are you looking for something that will make your presentation stand out from the rest Look no further than Toolkit For Data Science And Analytics Transition Key Consideration To Implement Data Analytics Guidelines PDF. With our professional designs, you can trust that your presentation will pop and make delivering it a smooth process. And with Slidegeeks, you can trust that your presentation will be unique and memorable. So why wait Grab Toolkit For Data Science And Analytics Transition Key Consideration To Implement Data Analytics Guidelines PDF today and make your presentation stand out from the rest.
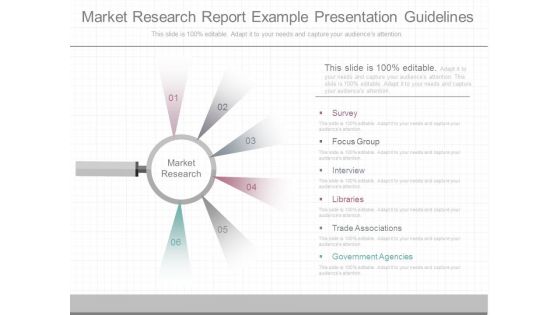
Market Research Report Example Presentation Guidelines
This is a market research report example presentation guidelines. This is a six stage process. The stages in this process are market research, survey, focus group, interview, libraries, trade associations, government agencies.

Monthly Production And Maintenance Process Internal Corporate Audit Schedule Plan Report Topics PDF
This slide covers month wise companys processes internal audit schedule. It includes inspection report of production, purchasing, data analysis, assembling, suppliers evaluation, quality check inspection , etc. with auditor names. Persuade your audience using this Monthly Production And Maintenance Process Internal Corporate Audit Schedule Plan Report Topics PDF. This PPT design covers one stages, thus making it a great tool to use. It also caters to a variety of topics including Data Analysis, Nonconforming Materials, Production. Download this PPT design now to present a convincing pitch that not only emphasizes the topic but also showcases your presentation skills.

Brand And Performance Marketing Services And Metrics Themes PDF
The slide showcases services offered by brand and performance marketing, which helps differentiate between them. There are a few services that are offered by both. The most common elements are the services that are provided by these marketing types, as well as key performance indicators. Presenting Brand And Performance Marketing Services And Metrics Themes PDF to dispense important information. This template comprises three stages. It also presents valuable insights into the topics including Services Provided, Services Provided, Services Provided Performance Marketing. This is a completely customizable PowerPoint theme that can be put to use immediately. So, download it and address the topic impactfully.
Statical Representation Of Sales Operating Cycle Plan Icon Pictures PDF
Persuade your audience using this Statical Representation Of Sales Operating Cycle Plan Icon Pictures PDF. This PPT design covers four stages, thus making it a great tool to use. It also caters to a variety of topics including Statical Representation, Sales Operating, Cycle Plan Icon. Download this PPT design now to present a convincing pitch that not only emphasizes the topic but also showcases your presentation skills.

Effective Data Arrangement For Data Accessibility And Processing Readiness Data Exploration Process In Detail Analysis Ideas PDF
This slide shows the data exploration process in detail that can be used to bring out the basic understanding of the real time data into data analytics. This is a effective data arrangement for data accessibility and processing readiness data exploration process in detail analysis ideas pdf template with various stages. Focus and dispense information on four stages using this creative set, that comes with editable features. It contains large content boxes to add your information on topics like treatment, outlier treatment, variable transformation. You can also showcase facts, figures, and other relevant content using this PPT layout. Grab it now.

Market Evaluation Of IT Industry Pricing Plan Of Market Analysis Tool Infographics PDF
The following slide showcases the pricing plan of select market analytics tool. It contains information about plans such as free trial, standard, professional, and enterprise. The Market Evaluation Of IT Industry Pricing Plan Of Market Analysis Tool Infographics PDF is a compilation of the most recent design trends as a series of slides. It is suitable for any subject or industry presentation, containing attractive visuals and photo spots for businesses to clearly express their messages. This template contains a variety of slides for the user to input data, such as structures to contrast two elements, bullet points, and slides for written information. Slidegeeks is prepared to create an impression.
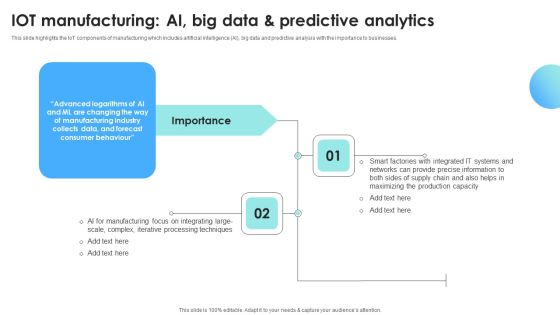
IOT Use Cases For Manufacturing IOT Manufacturing AI Big Data And Predictive Analytics Mockup PDF
This slide highlights the IoT components of manufacturing which includes artificial intelligence AI, big data and predictive analysis with the importance to businesses. This modern and well arranged IOT Use Cases For Manufacturing IOT Manufacturing AI Big Data And Predictive Analytics Mockup PDF provides lots of creative possibilities. It is very simple to customize and edit with the Powerpoint Software. Just drag and drop your pictures into the shapes. All facets of this template can be edited with Powerpoint no extra software is necessary. Add your own material, put your images in the places assigned for them, adjust the colors, and then you can show your slides to the world, with an animated slide included.

Big Data Technology For Real Estate Management Elements PDF
The slide showcases the key areas, big data technology in property management is used to drive Proptech disruption and efficiency of running a business. It covers better analytics, precise property evaluations, improved home prospecting and marketing, data-driven property development and digitalization of back-office processes. Presenting Big Data Technology For Real Estate Management Elements PDF to dispense important information. This template comprises five stages. It also presents valuable insights into the topics including Precise Property Evaluation, Performs Predictive Analysis, Development Opportunities. This is a completely customizable PowerPoint theme that can be put to use immediately. So, download it and address the topic impactfully.

Customer Kpis For Managers Scorecard Template PDF
This slide mentions customer key performance indicator used to formulate executive balanced scorecard. It includes retaining customers, fulfilling customer needs, and formulating loyalty programs. Presenting Customer Kpis For Managers Scorecard Template PDF to dispense important information. This template comprises three stages. It also presents valuable insights into the topics including Customer, Scorecard, Current. This is a completely customizable PowerPoint theme that can be put to use immediately. So, download it and address the topic impactfully.

Yearly Company Financial Performance Indicators Of Organization Ppt Infographics Outline PDF
This slide showcases to past years values of organization for future prediction. Key metrics covered are revenue, net profit, cash flow, sales and EBITDA. Persuade your audience using this Yearly Company Financial Performance Indicators Of Organization Ppt Infographics Outline PDF. This PPT design covers five stages, thus making it a great tool to use. It also caters to a variety of topics including Revenue, Net Profit, Cash Flow. Download this PPT design now to present a convincing pitch that not only emphasizes the topic but also showcases your presentation skills.

Magnifying Glass Opening Retail Store In Untapped Industry For Sales Growth Sample PDF
Do you have to make sure that everyone on your team knows about any specific topic I yes, then you should give Magnifying Glass Opening Retail Store In Untapped Industry For Sales Growth Sample PDF a try. Our experts have put a lot of knowledge and effort into creating this impeccable Magnifying Glass Opening Retail Store In Untapped Industry For Sales Growth Sample PDF. You can use this template for your upcoming presentations, as the slides are perfect to represent even the tiniest detail. You can download these templates from the Slidegeeks website and these are easy to edit. So grab these today.
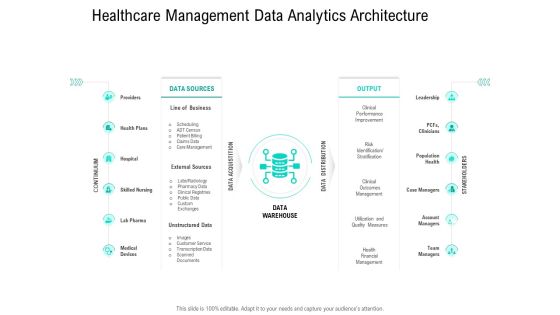
Nursing Administration Healthcare Management Data Analytics Architecture Ppt Visual Aids Pictures PDF
This is a nursing administration healthcare management data analytics architecture ppt visual aids pictures pdf template with various stages. Focus and dispense information on two stages using this creative set, that comes with editable features. It contains large content boxes to add your information on topics like line of business, external sources, management, performance improvement, financial management. You can also showcase facts, figures, and other relevant content using this PPT layout. Grab it now.
Pharmaceutical Management Healthcare Management Data Analytics Architecture Ppt Icon Picture PDF
This is a pharmaceutical management healthcare management data analytics architecture ppt icon picture pdf template with various stages. Focus and dispense information on two stages using this creative set, that comes with editable features. It contains large content boxes to add your information on topics like line of business, external sources, management, performance improvement, financial management. You can also showcase facts, figures, and other relevant content using this PPT layout. Grab it now.
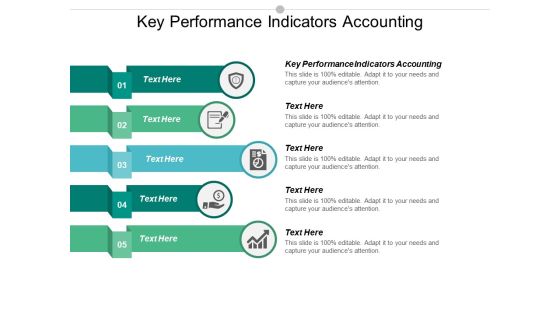
Key Performance Indicators Accounting Ppt Powerpoint Presentation Portfolio Master Slide Cpb
This is a key performance indicators accounting ppt powerpoint presentation portfolio master slide cpb. This is a five stage process. The stages in this process are key performance indicators accounting.

Data And Analytics Ppt PowerPoint Presentation Gallery Graphics Pictures
This is a data and analytics ppt powerpoint presentation gallery graphics pictures. This is a ten stage process. The stages in this process are graph analytics, journey sciences, augmented reality, hyper personalisation, behavioural analytics.

Toolkit For Data Science And Analytics Transition Change Management Plan For Data Analytics Structure PDF
This slide displays the data management change plan starting from the project initiation to strategize, implementing the change and monitors the same. Do you know about Slidesgeeks Toolkit For Data Science And Analytics Transition Change Management Plan For Data Analytics Structure PDF These are perfect for delivering any kind od presentation. Using it, create PowerPoint presentations that communicate your ideas and engage audiences. Save time and effort by using our pre designed presentation templates that are perfect for a wide range of topic. Our vast selection of designs covers a range of styles, from creative to business, and are all highly customizable and easy to edit. Download as a PowerPoint template or use them as Google Slides themes.

Executing Advance Data Analytics At Workspace Determine Role Of Security Centre In Firm Sample PDF
This slide covers information regarding the role of security center in in order to protect sensitive data and how firm behave before, after and towards security centre implementation. This is a executing advance data analytics at workspace determine role of security centre in firm sample pdf template with various stages. Focus and dispense information on four stages using this creative set, that comes with editable features. It contains large content boxes to add your information on topics like determine role of security centre in firm. You can also showcase facts, figures, and other relevant content using this PPT layout. Grab it now.
Statistical Data Icon Of Data Analytics Using Bar Graph Background PDF
Presenting statistical data icon of data analytics using bar graph background pdf to dispense important information. This template comprises four stages. It also presents valuable insights into the topics including statistical data icon of data analytics using bar graph. This is a completely customizable PowerPoint theme that can be put to use immediately. So, download it and address the topic impactfully.
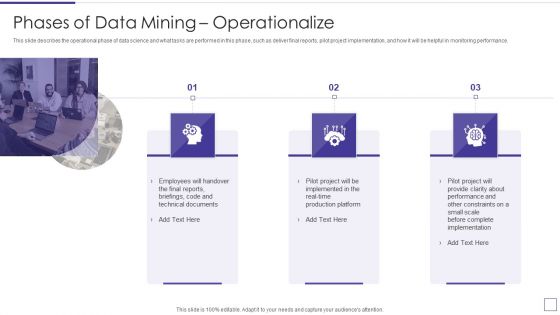
Data Mining Implementation Phases Of Data Mining Operationalize Professional PDF
This slide describes the operational phase of data science and what tasks are performed in this phase, such as deliver final reports, pilot project implementation, and how it will be helpful in monitoring performance.Presenting data mining implementation phases of data mining operationalize professional pdf to provide visual cues and insights. Share and navigate important information on three stages that need your due attention. This template can be used to pitch topics like employees will handover, technical documents, complete implementation In addtion, this PPT design contains high resolution images, graphics, etc, that are easily editable and available for immediate download.

Digital Marketing Key Metrics Ppt PowerPoint Presentation Pictures Inspiration Cpb
Presenting this set of slides with name digital marketing key metrics ppt powerpoint presentation pictures inspiration cpb. This is an editable Powerpoint three stages graphic that deals with topics like digital marketing key metrics to help convey your message better graphically. This product is a premium product available for immediate download and is 100 percent editable in Powerpoint. Download this now and use it in your presentations to impress your audience.

Data Requirements For Analytics Icon With Solution Slides PDF
Persuade your audience using this data requirements for analytics icon with solution slides pdf. This PPT design covers four stages, thus making it a great tool to use. It also caters to a variety of topics including data requirements for analytics icon with solution. Download this PPT design now to present a convincing pitch that not only emphasizes the topic but also showcases your presentation skills.
Financial Data Representation Ppt PowerPoint Presentation Rules
This is a financial data representation ppt powerpoint presentation rules. This is a five stage process. The stages in this process are financial, data, representation, marketing, management, business.

Retail Kpi Dashboard Showing Sales Revenue Customers And Out Of Stock Items Ppt PowerPoint Presentation Outline Example
This is a retail kpi dashboard showing sales revenue customers and out of stock items ppt powerpoint presentation outline example. This is a three stage process. The stages in this process are finance, marketing, management, investment, analysis.
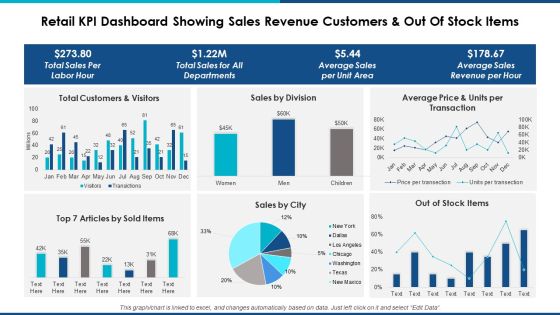
Retail Kpi Dashboard Showing Sales Revenue Customers And Out Of Stock Items Ppt Powerpoint Presentation Professional Background Designs
This is a retail kpi dashboard showing sales revenue customers and out of stock items ppt powerpoint presentation professional background designs. This is a six stage process. The stages in this process are finance, marketing, management, investment, analysis.
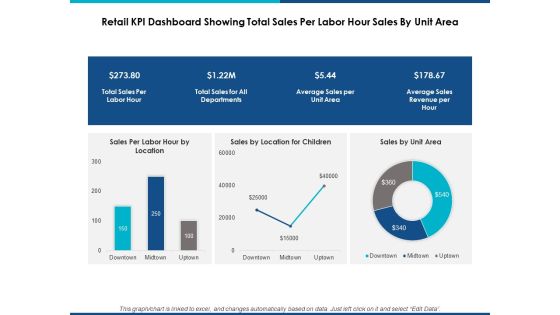
Retail Kpi Dashboard Showing Total Sales Per Labor Hour Sales By Unit Area Ppt Powerpoint Presentation Show Graphic Tips
This is a retail kpi dashboard showing total sales per labor hour sales by unit area ppt powerpoint presentation show graphic tips. This is a three stage process. The stages in this process are finance, marketing, management, investment, analysis.

Value Driven Management Process To Identify Performance Indicator Themes PDF
slide defines the phases leading to defining and implementing value drivers and key performance indicators. The purpose of this template is to analyze value based management model. It also includes elements such as analysis, recommendation, etc. Persuade your audience using this Value Driven Management Process To Identify Performance Indicator Themes PDF. This PPT design covers three stages, thus making it a great tool to use. It also caters to a variety of topics including Recommendation, Analytical Phase, Implementation. Download this PPT design now to present a convincing pitch that not only emphasizes the topic but also showcases your presentation skills.

Marketing Ppt Background Arrow 6 Stages 1 Operations Management PowerPoint 3 Image
We present our marketing PPT Background arrow 6 stages 1 operations management power point 3 Image. Use our Advertising PowerPoint Templates because, you have the product you are very confident of and are very sure it will prove immensely popular with clients all over your target areas. Use our Arrows PowerPoint Templates because, Many a core idea has various enveloping layers. Use our Shapes PowerPoint Templates because, Start with the fundamental basic activities and slowly but surely hone them down to the top of the pyramid, the ultimate goal. Use our Business PowerPoint Templates because, you have the entire picture in mind. Use our Process and Flows PowerPoint Templates because, Start the gears of youthful minds and set them in motion. Use these PowerPoint slides for presentations relating to advertising, arrow, background, banner, blue, bookmark, card, choice, concept, creative, design, direction, flow, label, manual, marketing, modern, next, number, offer, page, paper, pointer, process, product, promotion, sequence, simple, step, symbol. The prominent colors used in the PowerPoint template are Yellow, Gray, and Black
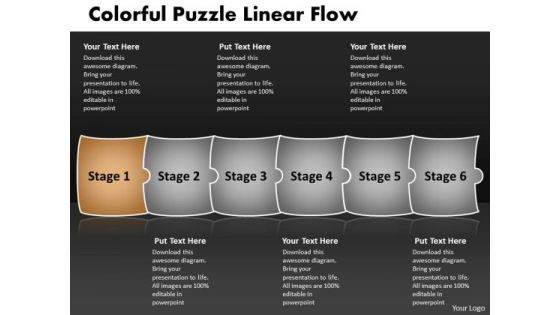
Colorful Puzzle Linear Flow Chart Manufacturing PowerPoint Slides
We present our colorful puzzle linear flow chart manufacturing PowerPoint Slides.Use our Success PowerPoint Templates because,You have the product you are very confident of and are very sure it will prove immensely popular with clients all over your target areas. Use our Puzzles or Jigsaws PowerPoint Templates because, You understand how each drives the next to motor the entire sequence. Use our Shapes PowerPoint Templates because,You will be able to Highlight these individual targets and the paths to their achievement. Use our Business PowerPoint Templates because,It helps you to project your enthusiasm and single mindedness to your colleagues. Use our Metaphors-Visual Concepts PowerPoint Templates because, You have some exciting plans to spread goodwill among the underprivileged, Expound on your ideas and show to your colleagues how they can help others and in the process increase your Brand value.Use these PowerPoint slides for presentations relating to Assembly, complete, concept, copy, finish, finished, fit, idea, interlock, jigsaw, match, metaphor, mystery, outline, patience, picture, piece, play, playing, point, pointing, problem, puzzle, quiz, skill, solution, solved, space, struggle, success, support, teamwork. The prominent colors used in the PowerPoint template are Brown, Gray, Black

Iot Applications For Manufacturing Industry Iot Manufacturing AI Big Data And Predictive Analytics Mockup PDF
This slide highlights the IoT components of manufacturing which includes artificial intelligence AI, big data and predictive analysis with the importance to businesses. Take your projects to the next level with our ultimate collection of Iot Applications For Manufacturing Industry Iot Manufacturing AI Big Data And Predictive Analytics Mockup PDF. Slidegeeks has designed a range of layouts that are perfect for representing task or activity duration, keeping track of all your deadlines at a glance. Tailor these designs to your exact needs and give them a truly corporate look with your own brand colors they will make your projects stand out from the rest.

Alternatives Evaluation Ppt PowerPoint Presentation Background Image
This is a alternatives evaluation ppt powerpoint presentation background image. This is a three stage process. The stages in this process are business, strategy, analysis, marketing, evaluation.

Retail Kpi Dashboard Showing Revenue Vs Units Sold Top 5 Product Categories Ppt PowerPoint Presentation Layouts Designs Download
This is a retail kpi dashboard showing revenue vs units sold top 5 product categories ppt powerpoint presentation layouts designs download. This is a four stage process. The stages in this process are finance, strategy, analysis, marketing.
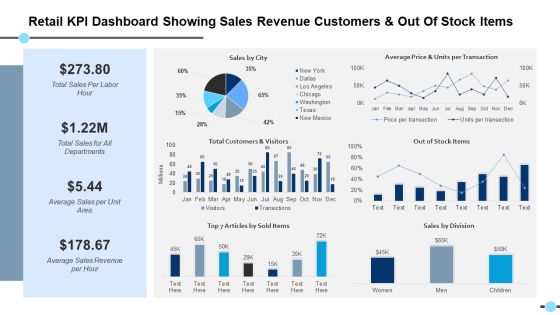
Retail Kpi Dashboard Showing Sales Revenue Customers And Out Of Stock Items Out Of Stock Items Ppt PowerPoint Presentation Files
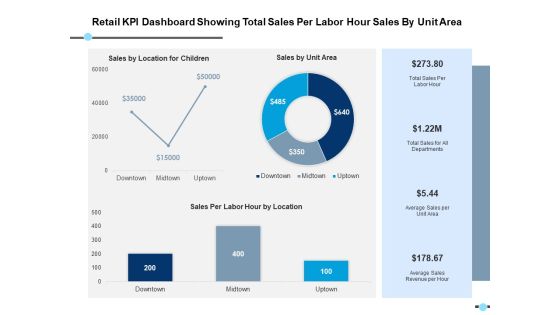
Retail Kpi Dashboard Showing Total Sales Per Labor Hour Sales By Unit Area Ppt PowerPoint Presentation Model Format
This is a retail kpi dashboard showing total sales per labor hour sales by unit area ppt powerpoint presentation model format. This is a three stage process. The stages in this process are finance, strategy, analysis, marketing.

Retail Kpi Dashboard Showing Total Sales Per Labor Hour Sales By Unit Area Ppt PowerPoint Presentation Styles Influencers
This is a retail kpi dashboard showing total sales per labor hour sales by unit area ppt powerpoint presentation styles influencers. This is a three stage process. The stages in this process are finance, marketing, management, investment, analysis.

Key Stages Of Data Analytics Infrastructure To Analyze Information Icons PDF
This slide includes key stages in the data project life cycle that enable organizations to collect, store, analyse, and leverage data. It includes sensing, collection, wrangling, analysis, and storage. Presenting Key Stages Of Data Analytics Infrastructure To Analyze Information Icons PDF to dispense important information. This template comprises five stages. It also presents valuable insights into the topics including Sensing, Collection, Wrangling, Analysis, Storage. This is a completely customizable PowerPoint theme that can be put to use immediately. So, download it and address the topic impactfully.

Key Metrics In Software Sales Strategy Pictures PDF
This slide presents key metrics to be tracked in software sales plan, that helps organisations to keep track of growth and profits generated over time. It includes monthly recurring revenue, average revenue per user, customer lifetime value and lead velocity rate Presenting Key Metrics In Software Sales Strategy Pictures PDF to dispense important information. This template comprises four stages. It also presents valuable insights into the topics including Monthly Recurring Revenue, Customer Lifetime Value, Lead Velocity Rate. This is a completely customizable PowerPoint theme that can be put to use immediately. So, download it and address the topic impactfully.
Approach Email Advertising Report Kpis Download PDF
This slide outlines essential email marketing key performance indicators to measure and track the performance of email campaigns. These KPIs include number of subscribers, open rate, click-through rate, bounce rate, conversion rate, ROI, list growth rate, etc. Presenting Approach Email Advertising Report Kpis Download PDF to dispense important information. This template comprises seven stages. It also presents valuable insights into the topics including Conversion Rate, Bounce Rate, Number Of Subscribers. This is a completely customizable PowerPoint theme that can be put to use immediately. So, download it and address the topic impactfully.

Approaches To Improve Fleet Management With Information Analytics Sample PDF
This slide showcases data driven approaches to fleet management. This template focuses on tracking report on logistics which matter most to business. It includes information related to asset utilization, fuel management, etc. Presenting Approaches To Improve Fleet Management With Information Analytics Sample PDF to dispense important information. This template comprises three stages. It also presents valuable insights into the topics including Asset Utilization, Fuel Management, Fringe Benefit Tax. This is a completely customizable PowerPoint theme that can be put to use immediately. So, download it and address the topic impactfully.
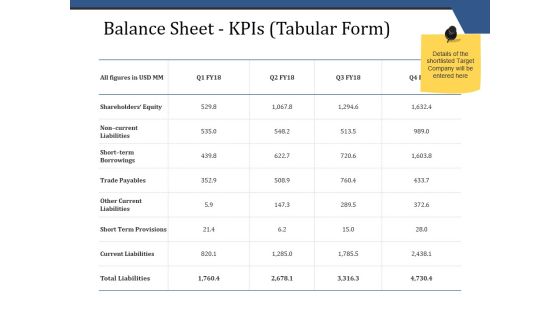
Balance Sheet Kpis Tabular Form Template 1 Ppt PowerPoint Presentation Infographics Picture
This is a balance sheet kpis tabular form template 1 ppt powerpoint presentation infographics picture. This is a four stage process. The stages in this process are business, finance, analysis, investment, strategy.

Balance Sheet Kpis Tabular Form Template 1 Ppt PowerPoint Presentation Outline Pictures
This is a balance sheet kpis tabular form template 1 ppt powerpoint presentation outline pictures. This is a five stage process. The stages in this process are compere, business, marketing, table, strategy.

P And L Kpis Tabular Form Ppt PowerPoint Presentation Pictures Gallery
This is a p and l kpis tabular form ppt powerpoint presentation pictures gallery. This is a four stage process. The stages in this process are business, marketing, graph, strategy, finance.
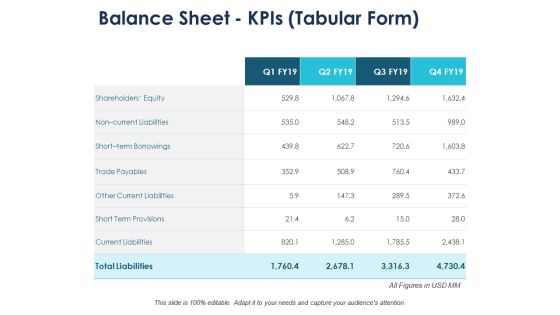
Balance Sheet Kpis Tabular Form Management Ppt PowerPoint Presentation Summary Pictures
This is a balance sheet kpis tabular form management ppt powerpoint presentation summary pictures. This is a four stage process. The stages in this process are compare, marketing, business, management, planning.

Healthcare Management Kpi Metrics Showing Incidents Length Of Stay Ppt PowerPoint Presentation Layout
Presenting this set of slides with name healthcare management kpi metrics showing incidents length of stay ppt powerpoint presentation layout. This is a four stage process. The stages in this process are incidents, satisfaction, compare, dashboard, threat. This is a completely editable PowerPoint presentation and is available for immediate download. Download now and impress your audience.

Accounts Receivable Key Performance Indicators Ppt PowerPoint Presentation Visual Aids Model Cpb
Presenting this set of slides with name accounts receivable key performance indicators ppt powerpoint presentation visual aids model cpb. This is a three stage process. The stages in this process are accounts receivable key performance indicators. This is a completely editable PowerPoint presentation and is available for immediate download. Download now and impress your audience.
Key Performance Indicators Examples Marketing Ppt PowerPoint Presentation Ideas Clipart Cpb
Presenting this set of slides with name key performance indicators examples marketing ppt powerpoint presentation ideas clipart cpb. This is a four stage process. The stages in this process are key performance indicators examples marketing. This is a completely editable PowerPoint presentation and is available for immediate download. Download now and impress your audience.

Data Analytics In Finance Sector Ppt Pictures Mockup PDF
This slide represents the application of data science in financial organizations and its benefits, such as automate risk analytics, algorithmic trading, machine learning algorithms, and personalized relations with customers. This is a data analytics in finance sector ppt pictures mockup pdf template with various stages. Focus and dispense information on four stages using this creative set, that comes with editable features. It contains large content boxes to add your information on topics like customer, strategic, analytics. You can also showcase facts, figures, and other relevant content using this PPT layout. Grab it now.
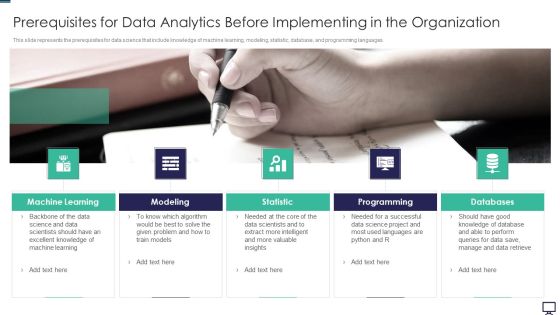
Prerequisites For Data Analytics Before Implementing In The Organization Ppt Professional Design Templates PDF
This slide represents the prerequisites for data science that include knowledge of machine learning, modeling, statistic, database, and programming languages. This is a prerequisites for data analytics before implementing in the organization ppt professional design templates pdf template with various stages. Focus and dispense information on five stages using this creative set, that comes with editable features. It contains large content boxes to add your information on topics like programming, databases, statistic, modeling, machine learning. You can also showcase facts, figures, and other relevant content using this PPT layout. Grab it now.

Kpis To Track Personalized Social Media Marketing Campaign Results Ppt PowerPoint Presentation Diagram Images PDF
This slide showcases KPIs that can help organization in measure the results of personalized social media marketing campaign. KPIs include audience growth rate, engagement rate, conversion rate, customer satisfaction score and click through rate. The Kpis To Track Personalized Social Media Marketing Campaign Results Ppt PowerPoint Presentation Diagram Images PDF is a compilation of the most recent design trends as a series of slides. It is suitable for any subject or industry presentation, containing attractive visuals and photo spots for businesses to clearly express their messages. This template contains a variety of slides for the user to input data, such as structures to contrast two elements, bullet points, and slides for written information. Slidegeeks is prepared to create an impression.
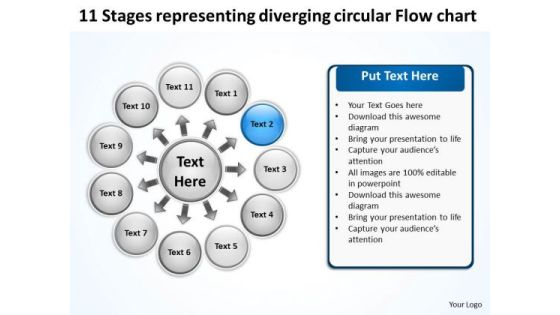
Representing Diverging Circular Flow Chart Process Diagram PowerPoint Templates
We present our representing diverging circular flow chart Process Diagram PowerPoint templates.Use our Ring charts PowerPoint Templates because your group can behave steady in the top bracket. Present our Circle charts PowerPoint Templates because this diagram helps you to harness the opportunities, celebrate your performance till date and focus on greater growth and expansion in coming years. Present our Process and Flows PowerPoint Templates because this slide helps you to give your team an overview of your capability and insight into the minute details of the overall picture highlighting the interdependence at every operational level. Download our Business PowerPoint Templates because you can Flutter your wings and enchant the world. Impress them with the innate attractiveness of your thoughts and words. Download our Marketing PowerPoint Templates because this slide represents the tools of the trade.Use these PowerPoint slides for presentations relating to Button,cerulean, circle, circulation, cobalt,colorful, cyan, cycle, element,emblem, grayshadow, green,icon, indicator, interface, internet, label,link, load, marker, motion, movement,navigationpanel, next, orientation, pagsite, pink, pointer, previous, process, reload, rotation, satined, sign, signpost,smooth, sticker, sticky, symbol. The prominent colors used in the PowerPoint template are Blue, Black, White. Customers tell us our representing diverging circular flow chart Process Diagram PowerPoint templates are Precious. We assure you our cycle PowerPoint templates and PPT Slides are Breathtaking. PowerPoint presentation experts tell us our representing diverging circular flow chart Process Diagram PowerPoint templates are Stunning. People tell us our circulation PowerPoint templates and PPT Slides are Tasteful. We assure you our representing diverging circular flow chart Process Diagram PowerPoint templates are Lush. Use our cyan PowerPoint templates and PPT Slides are Upbeat.
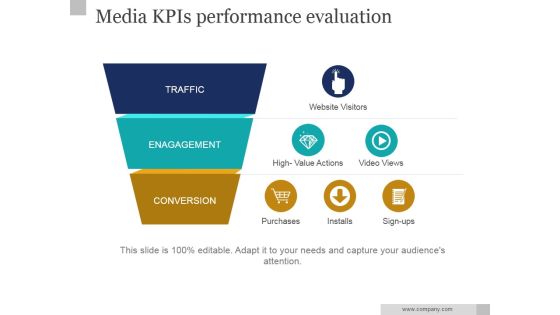
Media Kpis Performance Evaluation Ppt PowerPoint Presentation Background Images
This is a media kpis performance evaluation ppt powerpoint presentation background images. This is a three stage process. The stages in this process are leads, funnel, business, filter.
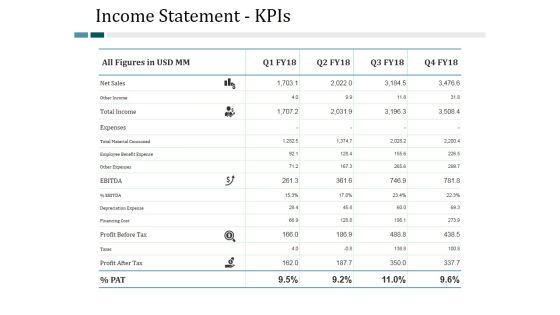
Income Statement Kpis Ppt PowerPoint Presentation Slides Show
This is a income statement kpis ppt powerpoint presentation slides show. This is a four stage process. The stages in this process are business, management, analysis, finance, strategy.

Channel Kpis Ppt PowerPoint Presentation Infographic Template Topics
This is a channel kpis ppt powerpoint presentation infographic template topics. This is a four stage process. The stages in this process are business, timeline, strategy, finance, planning.

Cash Flow Statement Kpis Ppt PowerPoint Presentation Clipart
This is a cash flow statement kpis ppt powerpoint presentation clipart. This is a four stage process. The stages in this process are business, marketing, finance, graph, strategy.

Balance Sheet Kpis Ppt Powerpoint Presentation Outline Shapes
This is a balance sheet kpis ppt powerpoint presentation outline shapes. This is a four stage process. The stages in this process are business, management, planning, strategy, marketing.
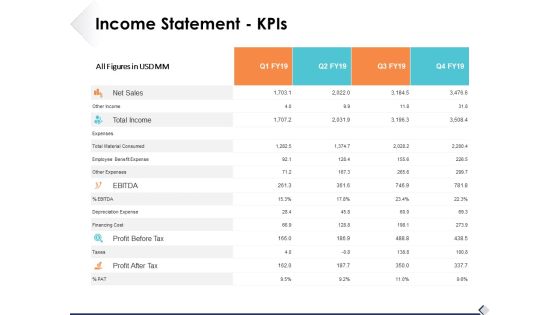
Income Statement Kpis Ppt PowerPoint Presentation Professional Template
This is a income statement kpis ppt powerpoint presentation professional template. This is a four stage process. The stages in this process are business, management, strategy, analysis, icons.

Balance Sheet Kpis Ppt PowerPoint Presentation Summary Layouts
This is a balance sheet kpis ppt powerpoint presentation summary layouts. This is a four stage process. The stages in this process are business, icons, management, strategy, analysis.
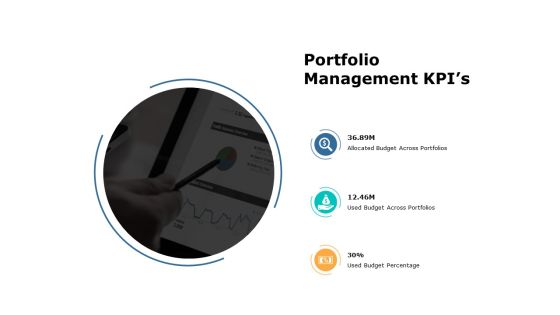
Portfolio Management Kpis Ppt PowerPoint Presentation Summary Gallery
This is a portfolio management kpis ppt powerpoint presentation summary gallery. This is a three stage process. The stages in this process are marketing, business, management.
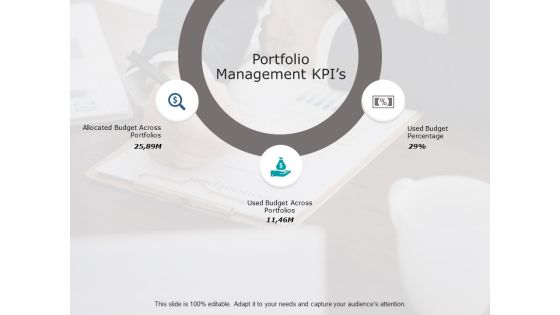
Portfolio Management Kpis Ppt PowerPoint Presentation Infographic Template Smartart
This is a portfolio management kpis ppt powerpoint presentation infographic template smartart. This is a three stage process. The stages in this process are business, management, marketing, process.

Diverging Arrow Process Diagram Relative Circular Flow PowerPoint Templates
We present our diverging arrow process diagram Relative Circular Flow PowerPoint templates.Present our Circle Charts PowerPoint Templates because this slide brings grey areas to the table and explain in detail you assessment of the need for care to ensure continued smooth progress. Download and present our Globe PowerPoint Templates because you can see In any endeavour people matter most. Present our Process and Flows PowerPoint Templates because this slide depicts the occasion for gifting and giving. Download and present our Flow Charts PowerPoint Templates because you can Organize your thoughts and illuminate your ideas accordingly. Use our Business PowerPoint Templates because you can Lead your flock steadily to greater heights. Look around at the vast potential of achievement around you.Use these PowerPoint slides for presentations relating to Arrow, art, artistic,background, caricature, chart, childish,circular, creative, design, diagram,doodle, draw, flow, graffiti, graphic,grunge, hand, handwritten, icon,illustration, image, isolated, object, pie, pieces, process, raster,report, retro, rough, scribble, segmented, simple, sketch, sketchy, slices,statistic, styling, succeed, success,symbol. The prominent colors used in the PowerPoint template are Green, Black, Blue. Professionals tell us our diverging arrow process diagram Relative Circular Flow PowerPoint templates look good visually. People tell us our chart PowerPoint templates and PPT Slides are second to none. The feedback we get is that our diverging arrow process diagram Relative Circular Flow PowerPoint templates are Wonderful. Presenters tell us our caricature PowerPoint templates and PPT Slides provide great value for your money. Be assured of finding the best projection to highlight your words. You can be sure our diverging arrow process diagram Relative Circular Flow PowerPoint templates are Lush. PowerPoint presentation experts tell us our artistic PowerPoint templates and PPT Slides are Attractive.

Marketing Ppt Background Arrow Process 4 Stages Project Management PowerPoint 3 Graphic
We present our marketing PPT Background arrow process 4 stages project management power point 3 Graphic. Use our Advertising PowerPoint Templates because; illustrate your plans on using the many social media modes available to inform society at large of the benefits of your product. Use our Arrows PowerPoint Templates because, now fire the arrows to emblazon the desired path by which you will achieve anticipated results. Use our Shapes PowerPoint Templates because, Probe the minds of your colleagues, see their faces light up as they assimilate and understand the value of your suggestions. Use our Business PowerPoint Templates because, you have the entire picture in mind. Use our Process and Flows PowerPoint Templates because, Spread the light of knowledge around you, clear the doubts and enlighten the questioning minds with your brilliance and ability. Use these PowerPoint slides for presentations relating to advertising, arrow, background, banner, blue, bookmark, card, choice, concept, creative, design, direction, flow, instruction, label, layout, manual, marketing, pointer, process, product, promotion, sequence, step, symbol, vector. The prominent colors used in the PowerPoint template are Green, Gray, and Black
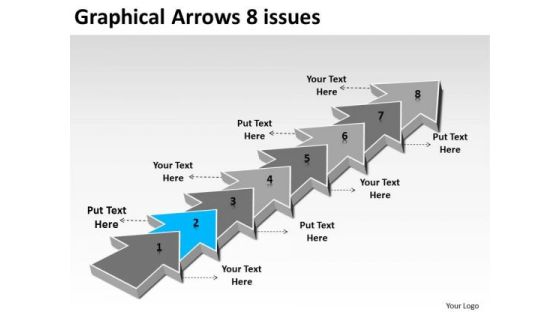
Graphical Arrows 8 Issues Free Flowchart Maker PowerPoint Templates
We present our graphical arrows 8 issues free flowchart maker PowerPoint templates. Use our Marketing PowerPoint Templates because, Targets: - You have a handle on all the targets, a master of the game, the experienced and consummate juggler. Use our Arrows PowerPoint Templates because, now you need to get it all together to form the complete picture and reach the goal. Use our Business PowerPoint Templates because, Ideas roll along in your mind like billiard balls. Use our Process and Flows PowerPoint Templates because; evolve the strategy to take you down the required path with appropriate, efficient and effective marketing along the way. Use our Leadership PowerPoint Templates because, the color coding of our templates are specifically designed to highlight you points. Use these PowerPoint slides for presentations relating to Advertising, arrow, background, banner, bookmark, card, choice, concept, creative, design, direction, flow, idea, illustration, info graphic, instruction, label, layout, marketing, modern, next, options, process, product, promotion, sequence, simple, step, symbol, template, triangle. The prominent colors used in the PowerPoint template are Blue, Gray, and White

3d Interconnected Puzzle Illustrating 4 Stages Flow Charts Vision PowerPoint Templates
We present our 3d interconnected puzzle illustrating 4 stages flow charts vision PowerPoint templates.Use our Success PowerPoint Templates because, The success of your venture depends on the performance of every team member. Use our Puzzles or Jigsaws PowerPoint Templates because,This helps you to comprehend your plan to get the entire act together. Use our Shapes PowerPoint Templates because,This diagram helps in examine each brilliant thought in thorough detail highlighting all the pros and cons as minutely as possible. Use our Business PowerPoint Templates because,The fruits of your labour are beginning to show.Enlighten them on the great plans you have for their enjoyment Use our Metaphors-Visual Concepts PowerPoint Templates because,This template helps you to delve on these thoughts and brief your team on the value of your depth of understanding of the subject.Use these PowerPoint slides for presentations relating to Assembly, complete, concept, copy, finish, finished, fit, idea, interlock, jigsaw, match, metaphor, mystery, outline, patience, picture, piece, play, playing, point, pointing, problem, puzzle, quiz, skill, solution, solved, space, struggle, success, support, teamwork. The prominent colors used in the PowerPoint template are Blue, Gray, Black

Nine Stages Diverging Factors Flow Chart Ppt Circular Diagram PowerPoint Templates
We present our nine stages diverging factors flow chart ppt Circular Diagram PowerPoint templates.Download and present our Arrows PowerPoint Templates because this slide depicts the occasion for gifting and giving. Download our Signs PowerPoint Templates because you can Churn the wheels of the brains of your colleagues. Use our Process and Flows PowerPoint Templates because this structure meant to ensure smooth transition to the next level. Present our Business PowerPoint Templates because project your ideas to you colleagues and complete the full picture. Download and present our Flow charts PowerPoint Templates because you watch them slowly start to savour the flavour you have served them.Use these PowerPoint slides for presentations relating to Arrow, art, blue, button, chart, clip,communication, design, diagram,element, graph, graphic, green, icon,illustration, isolated, loop, network,process, purple, recycling, red, round,set, shape, shiny, symbol, teamwork,. The prominent colors used in the PowerPoint template are Gray, Black, White. People tell us our nine stages diverging factors flow chart ppt Circular Diagram PowerPoint templates will make the presenter look like a pro even if they are not computer savvy. Customers tell us our communication PowerPoint templates and PPT Slides are Great. Professionals tell us our nine stages diverging factors flow chart ppt Circular Diagram PowerPoint templates are Luxuriant. Presenters tell us our chart PowerPoint templates and PPT Slides are Luxurious. Use our nine stages diverging factors flow chart ppt Circular Diagram PowerPoint templates are Beautiful. Presenters tell us our communication PowerPoint templates and PPT Slides will make the presenter successul in his career/life.
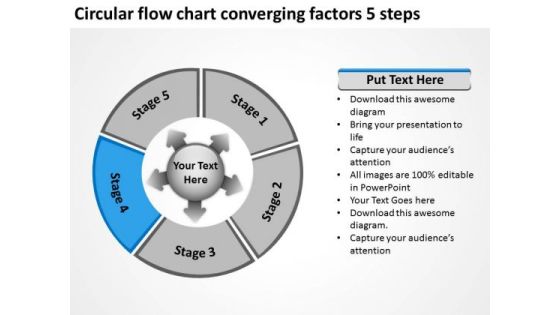
Circular Flow Chart Converging Factors 5 Steps Ppt Target Process PowerPoint Templates
We present our circular flow chart converging factors 5 steps ppt Target Process PowerPoint templates.Use our Business PowerPoint Templates because project your ideas to you colleagues and complete the full picture. Use our Process and Flows PowerPoint Templates because the fruit of your labour is about to ripen. Present our Marketing PowerPoint Templates because you can Explain the contribution of each of the elements and how they provide impetus to the next phase. Download and present our Flow Charts PowerPoint Templates because very often it is important to reflect on the basics. Download and present our Shapes PowerPoint Templates because colours generate instant reactions in our brains.Use these PowerPoint slides for presentations relating to Diagram, Arrow, Chart, Circle, Circular, Circulation, Concept, Connection, Continuity, Course, Direction, Duplicate, Flow, Presentation, Procedure, Process, Round, Step, Strategy, Success, System, Work Flow. The prominent colors used in the PowerPoint template are Blue, White, Gray. People tell us our circular flow chart converging factors 5 steps ppt Target Process PowerPoint templates are Playful. Use our Chart PowerPoint templates and PPT Slides are designed by a team of presentation professionals. Professionals tell us our circular flow chart converging factors 5 steps ppt Target Process PowerPoint templates are Swanky. Presenters tell us our Concept PowerPoint templates and PPT Slides are Enchanting. Professionals tell us our circular flow chart converging factors 5 steps ppt Target Process PowerPoint templates are Pretty. PowerPoint presentation experts tell us our Concept PowerPoint templates and PPT Slides are Functional.
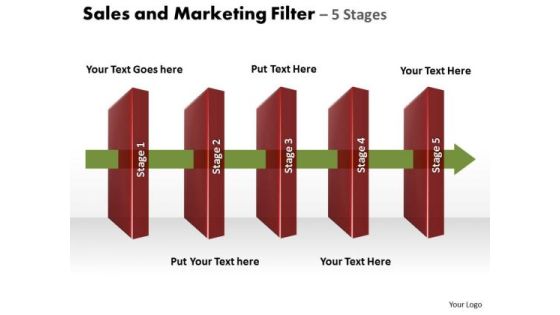
Filter Process 5 Stages Editable PowerPoint Slides Templates
We present our filter process 5 stages editable powerpoint slides templates.Download and present our Symbol PowerPoint Templates because your quicksilver ideas are the arrows in your quiver. Use our Arrows PowerPoint Templates because this diagram helps in examine each brilliant thought in thorough detail highlighting all the pros and cons as minutely as possible. Download our Business PowerPoint Templates because profit levels have been steady over the recent past. Spread your heightened excitement to others in the room. Use our Shapes PowerPoint Templates because forward thinking is the way to go. Present our Process and Flows PowerPoint Templates because You can Connect the dots. Fan expectations as the whole picture emerges.Use these PowerPoint slides for presentations relating to Air, Art, Black, Blue, Button, Chart, Clip, Design, Diagram, Document, Element, File, Filter, Graph, Graphic, Green, Icon, Illustration, Isolated, Process, Red, Round, Set, Shape, Step, Symbol, Three, White. The prominent colors used in the PowerPoint template are Green, Red, White. You can be sure our filter process 5 stages editable powerpoint slides templates will help them to explain complicated concepts. Professionals tell us our Chart PowerPoint templates and PPT Slides are Sparkling. People tell us our filter process 5 stages editable powerpoint slides templates are Ritzy. People tell us our Blue PowerPoint templates and PPT Slides are Luxurious. People tell us our filter process 5 stages editable powerpoint slides templates are Festive. PowerPoint presentation experts tell us our Chart PowerPoint templates and PPT Slides are Royal.
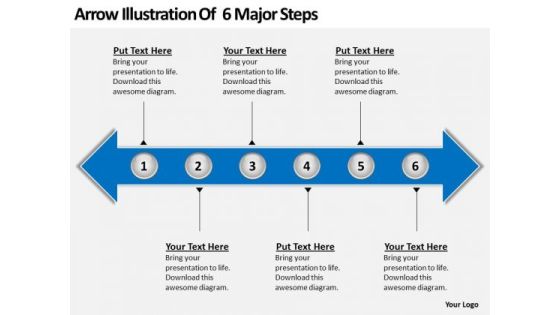
Arrow Illustration Of 6 Major Steps PowerPoint Templates Ppt Slides Graphics
We present our Arrow Illustration Of 6 Major Steps PowerPoint Templates PPT Slides Graphics.Use our Marketing PowerPoint Templates because They will Put your wonderful verbal artistry on display. Our PowerPoint Templates and Slides will provide you the necessary glam and glitter. Download our Timelines PowerPoint Templates because Our PowerPoint Templates and Slides will let you Illuminate the road ahead to Pinpoint the important landmarks along the way. Present our Business PowerPoint Templates because Our PowerPoint Templates and Slides offer you the needful to organise your thoughts. Use them to list out your views in a logical sequence. Download and present our Arrows PowerPoint Templates because Our PowerPoint Templates and Slides will let you Illuminate the road ahead to Pinpoint the important landmarks along the way. Use our Time planning PowerPoint Templates because You can Connect the dots. Fan expectations as the whole picture emerges.Use these PowerPoint slides for presentations relating to Art, Background, Button, Call, City, Colorful, Concept, Country, Destination, Editable, Flag, Fuel, Geography, Graphic, Home, Icon, Illustration, Journey, Land, Locate, Location, Macro, Map, Mapping, Mark, Navigate, Needle, Petrol, Pin, Pinpoint, Place, Pointing, Pump, Push, Pushpin, Restaurant, Road, Roadmap, Service, Set, Shiny, Space, Symbol, Town, Travel, Trip. The prominent colors used in the PowerPoint template are Blue, Gray, White.

8 Blocks Of Structured Data Plans PowerPoint Templates
We present our 8 blocks of structured data plans PowerPoint templates.Download and present our Circle Charts PowerPoint Templates because You can Inspire your team with our PowerPoint Templates and Slides. Let the force of your ideas flow into their minds. Download and present our Signs PowerPoint Templates because You can Connect the dots. Fan expectations as the whole picture emerges. Present our Shapes PowerPoint Templates because Our PowerPoint Templates and Slides will embellish your thoughts. See them provide the desired motivation to your team. Download our Business PowerPoint Templates because It will let you Set new benchmarks with our PowerPoint Templates and Slides. They will keep your prospects well above par. Present our Metaphors-Visual Concepts PowerPoint Templates because You are an avid believer in ethical practices. Highlight the benefits that accrue with our PowerPoint Templates and Slides.Use these PowerPoint slides for presentations relating to circler, decoration, circled, vector, symbol, orange, textures, illustration, circular, artwork, round, circule, objects, art, sizes. The prominent colors used in the PowerPoint template are Blue, Black, Gray.

Information Studies Phases Of Data Science Operationalize Pictures PDF
This slide describes the operational phase of data science and what tasks are performed in this phase, such as deliver final reports, pilot project implementation, and how it will be helpful in monitoring performance. This is a Information Studies Phases Of Data Science Operationalize Pictures PDF template with various stages. Focus and dispense information on three stages using this creative set, that comes with editable features. It contains large content boxes to add your information on topics like Technical Documents, Implemented, Production Platform. You can also showcase facts, figures, and other relevant content using this PPT layout. Grab it now.

Customer Data Analytics Architecture Ppt PowerPoint Presentation Pictures Background Cpb
Presenting this set of slides with name customer data analytics architecture ppt powerpoint presentation pictures background cpb. This is an editable Powerpoint four stages graphic that deals with topics like customer data analytics architecture to help convey your message better graphically. This product is a premium product available for immediate download and is 100 percent editable in Powerpoint. Download this now and use it in your presentations to impress your audience.

Data Management Analytics Platform Ppt PowerPoint Presentation Pictures Sample Cpb
Presenting this set of slides with name data management analytics platform ppt powerpoint presentation pictures sample cpb. This is an editable Powerpoint four stages graphic that deals with topics like data management analytics platform to help convey your message better graphically. This product is a premium product available for immediate download and is 100 percent editable in Powerpoint. Download this now and use it in your presentations to impress your audience.

Big Data Analytics Applications Ppt PowerPoint Presentation Pictures Professional Cpb
Presenting this set of slides with name big data analytics applications ppt powerpoint presentation pictures professional cpb. This is an editable Powerpoint five stages graphic that deals with topics like big data analytics applications to help convey your message better graphically. This product is a premium product available for immediate download and is 100 percent editable in Powerpoint. Download this now and use it in your presentations to impress your audience.

Supply Chain Key Performance Indicators Ppt PowerPoint Presentation Gallery Slideshow Cpb
Presenting this set of slides with name supply chain key performance indicators ppt powerpoint presentation gallery slideshow cpb. This is an editable Powerpoint six stages graphic that deals with topics like supply chain key performance indicators to help convey your message better graphically. This product is a premium product available for immediate download and is 100 percent editable in Powerpoint. Download this now and use it in your presentations to impress your audience.

Key Performance Indicators Employee Evaluation Ppt PowerPoint Presentation Model Visual Aids Cpb
Presenting this set of slides with name key performance indicators employee evaluation ppt powerpoint presentation model visual aids cpb. This is an editable Powerpoint five stages graphic that deals with topics like key performance indicators employee evaluation to help convey your message better graphically. This product is a premium product available for immediate download and is 100 percent editable in Powerpoint. Download this now and use it in your presentations to impress your audience.

Measuring Innovation Key Performance Indicators Ppt PowerPoint Presentation Gallery Portfolio Cpb
Presenting this set of slides with name measuring innovation key performance indicators ppt powerpoint presentation gallery portfolio cpb. This is an editable Powerpoint four stages graphic that deals with topics like measuring innovation key performance indicators to help convey your message better graphically. This product is a premium product available for immediate download and is 100 percent editable in Powerpoint. Download this now and use it in your presentations to impress your audience.
Disaster Recovery Key Performance Indicators Ppt PowerPoint Presentation Outline Graphic Tips Cpb
Presenting this set of slides with name disaster recovery key performance indicators ppt powerpoint presentation outline graphic tips cpb. This is an editable Powerpoint three stages graphic that deals with topics like disaster recovery key performance indicators to help convey your message better graphically. This product is a premium product available for immediate download and is 100 percent editable in Powerpoint. Download this now and use it in your presentations to impress your audience.
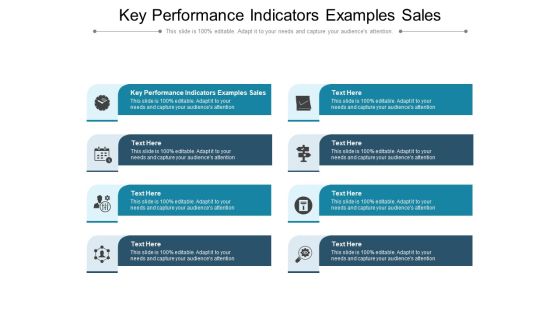
Key Performance Indicators Examples Sales Ppt PowerPoint Presentation File Example Cpb Pdf
Presenting this set of slides with name key performance indicators examples sales ppt powerpoint presentation file example cpb pdf. This is an editable Powerpoint eight stages graphic that deals with topics like key performance indicators examples sales to help convey your message better graphically. This product is a premium product available for immediate download and is 100 percent editable in Powerpoint. Download this now and use it in your presentations to impress your audience.
Key Performance Indicators Quality Assurance Examples Ppt PowerPoint Presentation Gallery Examples Cpb Pdf
Presenting this set of slides with name key performance indicators quality assurance examples ppt powerpoint presentation gallery examples cpb pdf. This is an editable Powerpoint five stages graphic that deals with topics like key performance indicators quality assurance examples to help convey your message better graphically. This product is a premium product available for immediate download and is 100 percent editable in Powerpoint. Download this now and use it in your presentations to impress your audience.
Leader Assessing Project Score Based Key Performance Indicators Ppt PowerPoint Presentation Summary Icons PDF
Persuade your audience using this leader assessing project score based key performance indicators ppt powerpoint presentation summary icons pdf. This PPT design covers three stages, thus making it a great tool to use. It also caters to a variety of topics including leader assessing project score based key performance indicators. Download this PPT design now to present a convincing pitch that not only emphasizes the topic but also showcases your presentation skills.

Supplier Scorecard Supplier Comparison Scorecard With Key Performance Indicator Chart Formats PDF
This is a supplier scorecard supplier comparison scorecard with key performance indicator chart formats pdf template with various stages. Focus and dispense information on one stages using this creative set, that comes with editable features. It contains large content boxes to add your information on topics like supplier comparison scorecard, key performance, indicator chart. You can also showcase facts, figures, and other relevant content using this PPT layout. Grab it now.
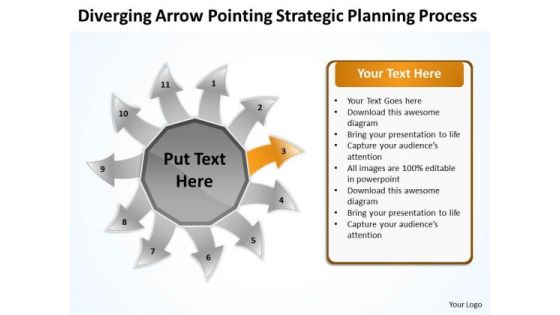
Diverging Arrow Pointing Strategic Planning Process Ppt Radial PowerPoint Slide
We present our diverging arrow pointing strategic planning process ppt Radial PowerPoint Slide.Use our Arrows PowerPoint Templates because all for one and one for all. Download and present our Flow Charts PowerPoint Templates because you should explain the process by which you intend to right it. Present our Process and Flows PowerPoint Templates because using our templates for your colleagues will impart knowledge to feed. Use our Ring Charts PowerPoint Templates because you have some excellent plans to spread some more of it across your community. Use our Business PowerPoint Templates because it will demonstrate the strength of character under severe stress. Shine the torch ahead and bring the light to shine on all.Use these PowerPoint slides for presentations relating to Arrow, art, artistic,background, caricature, chart, childish,circular, creative, design, diagram,doodle, draw, flow, graffiti, graphic,grunge, hand, handwritten, icon,illustration, image, isolated, object, pie, pieces, process, raster,report, retro, rough, scribble, segmented, simple, sketch, sketchy, slices,statistic, styling, succeed, success,symbol. The prominent colors used in the PowerPoint template are Green lime, Gray, White. Professionals tell us our diverging arrow pointing strategic planning process ppt Radial PowerPoint Slide are Royal. People tell us our caricature PowerPoint templates and PPT Slides are Nifty. The feedback we get is that our diverging arrow pointing strategic planning process ppt Radial PowerPoint Slide will help you be quick off the draw. Just enter your specific text and see your points hit home. Presenters tell us our chart PowerPoint templates and PPT Slides are No-nonsense. You can be sure our diverging arrow pointing strategic planning process ppt Radial PowerPoint Slide will help you be quick off the draw. Just enter your specific text and see your points hit home. PowerPoint presentation experts tell us our creative PowerPoint templates and PPT Slides are Luxuriant.
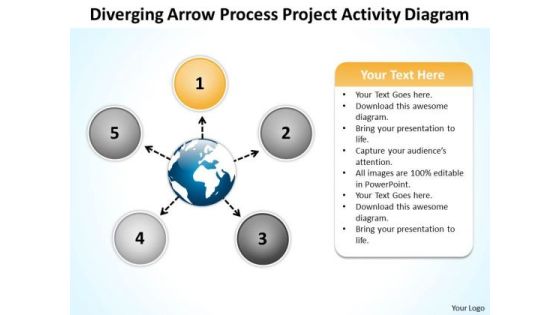
Diverging Arrow Process Project Activity Diagram Ppt Radial Chart PowerPoint Slide
We present our diverging arrow process project activity diagram ppt Radial Chart PowerPoint Slide.Download our Globe PowerPoint Templates because sprout your thoughts into the minds of your colleagues. Present our Circle Charts PowerPoint Templates because your brain is always churning out ideas like cogs in a wheel. Use our Ring Charts PowerPoint Templates because it can bring your ideas to the fore so that all around can know. Dissect each idea to the core and select the best. Download and present our Business PowerPoint Templates because this template can project the path to sucess that you have charted. Use our Marketing PowerPoint Templates because networking is an imperative in todays world. You need to access the views of others. Similarly you need to give access to them of your abilities.Use these PowerPoint slides for presentations relating to Arrow, art, caricature, chart, childish,circular, creative, design, diagram,doodle, draw, flow, graffiti, graphic,grunge, hand, handwritten, icon,illustration, image, isolated, object, pie, pieces, process, raster,report, retro, rough, scribble, segmented, simple, sketch, sketchy, slices,statistic, styling, succeed, success,symbol. The prominent colors used in the PowerPoint template are Gray, Black, White. Professionals tell us our diverging arrow process project activity diagram ppt Radial Chart PowerPoint Slide are Wistful. People tell us our caricature PowerPoint templates and PPT Slides are Wistful. The feedback we get is that our diverging arrow process project activity diagram ppt Radial Chart PowerPoint Slide are Swanky. Presenters tell us our circular PowerPoint templates and PPT Slides will make the presenter look like a pro even if they are not computer savvy. You can be sure our diverging arrow process project activity diagram ppt Radial Chart PowerPoint Slide are Multicolored. PowerPoint presentation experts tell us our circular PowerPoint templates and PPT Slides will help you be quick off the draw. Just enter your specific text and see your points hit home.

Diverging Arrow Process Project Activity Diagram Ppt Radial Chart PowerPoint Slides
We present our diverging arrow process project activity diagram ppt Radial Chart PowerPoint Slides.Use our Arrows PowerPoint Templates because this slide illustrates your thoughts and experiences to your staff. Present our Flow Charts PowerPoint Templates because there are a bucketful of brilliant ideas swirling around within your group. Present our Process and Flows PowerPoint Templates because Our PowerPoint Templates and Slides will give you great value for your money. Be assured of finding the best projection to highlight your words. Download and present our Business PowerPoint Templates because the fruits of your labour are beginning to show.Enlighten them on the great plans you have for their enjoyment. Use our Shapes PowerPoint Templates because stable ideas are the building blocks of a sucessful structure.Use these PowerPoint slides for presentations relating to Arrow, art, artistic,background, caricature, chart, childish,circular, creative, design, diagram,doodle, draw, flow, graffiti, graphic,grunge, hand, handwritten, icon,illustration, image, isolated, object, pie, pieces, process, raster,report, retro, rough, scribble, segmented, simple, sketch, sketchy, slices,statistic, styling, succeed, success,symbol. The prominent colors used in the PowerPoint template are Blue navy, Black, Gray. Professionals tell us our diverging arrow process project activity diagram ppt Radial Chart PowerPoint Slides are Flirty. People tell us our caricature PowerPoint templates and PPT Slides are Bold. The feedback we get is that our diverging arrow process project activity diagram ppt Radial Chart PowerPoint Slides are Stylish. Presenters tell us our circular PowerPoint templates and PPT Slides are Clever. You can be sure our diverging arrow process project activity diagram ppt Radial Chart PowerPoint Slides are Energetic. PowerPoint presentation experts tell us our creative PowerPoint templates and PPT Slides are Great.
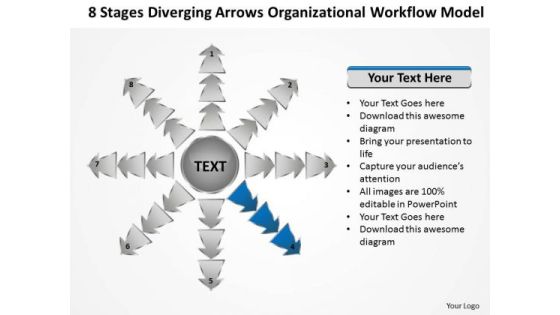
Diverging Arrows Organizational Workflow Model Circular Spoke Diagram PowerPoint Slides
We present our diverging arrows organizational workflow model Circular Spoke Diagram PowerPoint Slides.Use our Process and Flows PowerPoint Templates because you have a clear vision of the cake you want. Use our Arrows PowerPoint Templates because you can Unravel the desired and essential elements of your overall strategy. Download and present our Flow Charts PowerPoint Templates because this is An innovative slide design depicting driving home the relevance of a steady rhythm. Download and present our Marketing PowerPoint Templates because profit is fairly earned in what you believe. Use our Business PowerPoint Templates because you too have got the framework of your companys growth in place.Use these PowerPoint slides for presentations relating to Arrow, art, artistic,background, caricature, chart, childish,circular, creative, design, diagram,doodle, draw, flow, graffiti, graphic,grunge, hand, handwritten, icon,illustration, image, isolated, object, pie, pieces, process, raster,report, retro, rough, scribble, segmented, simple, sketch, sketchy, slices,statistic, styling, succeed, success,symbol. The prominent colors used in the PowerPoint template are Blue, Gray, White. Professionals tell us our diverging arrows organizational workflow model Circular Spoke Diagram PowerPoint Slides are Energetic. People tell us our childish PowerPoint templates and PPT Slides are Elegant. The feedback we get is that our diverging arrows organizational workflow model Circular Spoke Diagram PowerPoint Slides are Fashionable. Presenters tell us our caricature PowerPoint templates and PPT Slides are Great. You can be sure our diverging arrows organizational workflow model Circular Spoke Diagram PowerPoint Slides are readymade to fit into any presentation structure. PowerPoint presentation experts tell us our childish PowerPoint templates and PPT Slides are the best it can get when it comes to presenting.
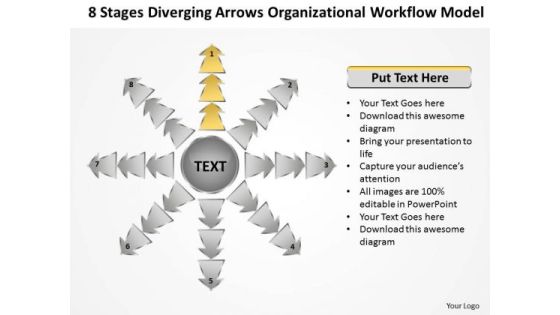
Diverging Arrows Organizational Workflow Model Cycle Process Diagram PowerPoint Slides
We present our diverging arrows organizational workflow model Cycle Process Diagram PowerPoint Slides.Use our Process and Flows PowerPoint Templates because you have it all down to a nicety, slice by slice, layer by layer. Use our Arrows PowerPoint Templates because this is a good example of the strength of teamwork. Download our Flow Charts PowerPoint Templates because this is a wonderful graphics to see the smiles of happiness spread as your audience realizes the value of your words. Present our Marketing PowerPoint Templates because The marketplace is the merger of your dreams and your ability. Download our Business PowerPoint Templates because you are sure you have the right people for your plans.Use these PowerPoint slides for presentations relating to Circular, creative, design, diagram,doodle, draw, flow, graffiti, graphic,grunge, hand, handwritten, icon,illustration, image, isolated, object, pie, pieces, process, raster,report, retro, rough, scribble, segmented, simple, sketch, sketchy, slices,statistic, styling, succeed, success,symbol. The prominent colors used in the PowerPoint template are Gray, Black, White. Professionals tell us our diverging arrows organizational workflow model Cycle Process Diagram PowerPoint Slides will save the presenter time. People tell us our graphic PowerPoint templates and PPT Slides are Tasteful. The feedback we get is that our diverging arrows organizational workflow model Cycle Process Diagram PowerPoint Slides effectively help you save your valuable time. Presenters tell us our doodle PowerPoint templates and PPT Slides are Luxurious. You can be sure our diverging arrows organizational workflow model Cycle Process Diagram PowerPoint Slides are Striking. PowerPoint presentation experts tell us our diagram PowerPoint templates and PPT Slides are One-of-a-kind.
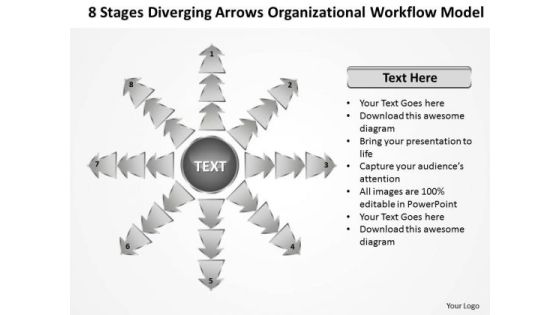
Diverging Arrows Organizational Workflow Model Network Software PowerPoint Slides
We present our diverging arrows organizational workflow model Network Software PowerPoint Slides.Use our Process and Flows PowerPoint Templates because your marketing strategies can funnel down to the cone, stage by stage, refining as you go along. Download our Arrows PowerPoint Templates because you have the people in place, selected the team leaders and all are raring to go. Present our Flow Charts PowerPoint Templates because it Creates a winner with your passion and dream. Download and present our Marketing PowerPoint Templates because networking is an imperative in todays world. You need to access the views of others. Similarly you need to give access to them of your abilities. Use our Business PowerPoint Templates because this structure meant to ensure smooth transition to the next level.Use these PowerPoint slides for presentations relating to Arrow, art, artistic,background, caricature, chart, childish,circular, creative, design, diagram,doodle, draw, flow, graffiti, graphic,grunge, hand, handwritten, icon,illustration, image, isolated, object, pie, pieces, process, raster,report, retro, rough, scribble, segmented, simple, sketch, sketchy, slices,statistic, styling, succeed, success,symbol. The prominent colors used in the PowerPoint template are Green, Black, White. Professionals tell us our diverging arrows organizational workflow model Network Software PowerPoint Slides are Chic. People tell us our circular PowerPoint templates and PPT Slides are Perfect. The feedback we get is that our diverging arrows organizational workflow model Network Software PowerPoint Slides are Swanky. Presenters tell us our background PowerPoint templates and PPT Slides are Ritzy. You can be sure our diverging arrows organizational workflow model Network Software PowerPoint Slides are Fabulous. PowerPoint presentation experts tell us our circular PowerPoint templates and PPT Slides are Attractive.
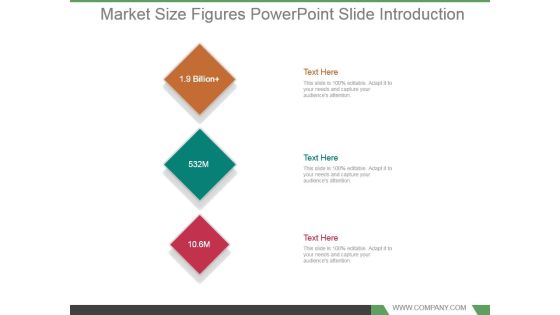
Market Size Figures Powerpoint Slide Introduction
This is a market size figures powerpoint slide introduction. This is a three stage process. The stages in this process are business, marketing, strategy, figure, size.

Comparison Ppt PowerPoint Presentation Portfolio Example File
This is a comparison ppt powerpoint presentation portfolio example file. This is a two stage process. The stages in this process are business, marketing, comparison, finance, management.

Competitive Analysis Matrix Ppt PowerPoint Presentation Model Deck
This is a competitive analysis matrix ppt powerpoint presentation model deck. This is a six stage process. The stages in this process are new organization, table, business, marketing, strategy.
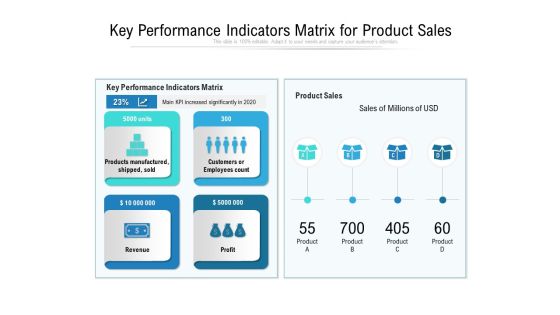
Key Performance Indicators Matrix For Product Sales Ppt PowerPoint Presentation File Clipart PDF
Presenting key performance indicators matrix for product sales ppt powerpoint presentation file clipart pdf to dispense important information. This template comprises four stages. It also presents valuable insights into the topics including manufactured, revenue, performance. This is a completely customizable PowerPoint theme that can be put to use immediately. So, download it and address the topic impactfully.

Table Of Contents Commercial Activities Marketing Tools Guidelines PDF
Presenting table of contents commercial activities marketing tools guidelines pdf to provide visual cues and insights. Share and navigate important information on twelve stages that need your due attention. This template can be used to pitch topics like trade show, trade marketing, campaign dashboard, monitoring, strategic partnership. In addtion, this PPT design contains high resolution images, graphics, etc, that are easily editable and available for immediate download.

CRM System Deployment Plan Implementation Steps Determine Metrics Supporting Icons PDF
This slide covers various KPIs that need to be measured to achieve organizational goals. It includes metrics such as salespersons performance report, number of leads converted, leads generated through campaigns, monthly sales report, number of unresolved cases, etc. This is a CRM System Deployment Plan Implementation Steps Determine Metrics Supporting Icons PDF template with various stages. Focus and dispense information on one stages using this creative set, that comes with editable features. It contains large content boxes to add your information on topics like Report And Dashboard, Metrics, Resource. You can also showcase facts, figures, and other relevant content using this PPT layout. Grab it now.

Information Transformation Process Toolkit Key Steps For Predictive Data Analytics Project Introduction PDF
The slide shows the predictive data analytics process focusing on data analysis, machine learning, predictive modelling and monitoring. Presenting Information Transformation Process Toolkit Key Steps For Predictive Data Analytics Project Introduction PDF to provide visual cues and insights. Share and navigate important information on six stages that need your due attention. This template can be used to pitch topics like Data Analysis And Massaging, Data Collection, Requirement Collection. In addtion, this PPT design contains high resolution images, graphics, etc, that are easily editable and available for immediate download.

Classified Data Memo Record With Strategic Goals Key Performance Indicators Of The Company Guidelines PDF
This slide provides information about the key performance indicators of the company for 5 years in terms of turnover, gross profit, operating profit margin etc. This is a classified data memo record with strategic goals key performance indicators of the company guidelines pdf template with various stages. Focus and dispense information on five stages using this creative set, that comes with editable features. It contains large content boxes to add your information on topics like turnover, gross profit, gross profit margin, operating profit, operating profit margin. You can also showcase facts, figures, and other relevant content using this PPT layout. Grab it now.

Competitive Sales Strategy Development Plan For Revenue Growth Key Performance Indicators Elements PDF
This slide shows the key performance indicators after implementing sales strategy such as total revenue, average revenue per customer, market share, win rate, year-over-year growth, customer lifetime value, etc. Presenting Competitive Sales Strategy Development Plan For Revenue Growth Key Performance Indicators Elements PDF to provide visual cues and insights. Share and navigate important information on four stages that need your due attention. This template can be used to pitch topics like Market Share, Total Revenue, Sales Expense Ratio. In addtion, this PPT design contains high resolution images, graphics, etc, that are easily editable and available for immediate download.

Online Data Research Advisory Project Ppt PowerPoint Presentation File Themes PDF
This slide exhibits online data research consulting project process and methods, It includes- tools and methods, process, service features and so on. Presenting online data research advisory project ppt powerpoint presentation file themes pdf to dispense important information. This template comprises five stages. It also presents valuable insights into the topics including report preparation, data analysis, data collection, develop research plan, problem. This is a completely customizable PowerPoint theme that can be put to use immediately. So, download it and address the topic impactfully.

Oracle Cloud Data Analytics Administration IT Agenda For Oracle Analytics Cloud Background PDF
This is a oracle cloud data analytics administration it agenda for oracle analytics cloud background pdf template with various stages. Focus and dispense information on three stages using this creative set, that comes with editable features. It contains large content boxes to add your information on topics like problems, overcome, business, solutions, organization. You can also showcase facts, figures, and other relevant content using this PPT layout. Grab it now.
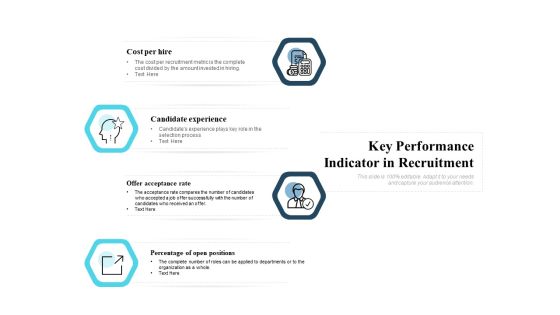
Key Performance Indicator In Recruitment Ppt PowerPoint Presentation Show Graphic Tips
Presenting this set of slides with name key performance indicator in recruitment ppt powerpoint presentation show graphic tips. This is a four stage process. The stages in this process are cost per hire, candidate experience, offer acceptance rate, percentage of open positions. This is a completely editable PowerPoint presentation and is available for immediate download. Download now and impress your audience.

Medicine Promotion Key Performance Indicators Ppt PowerPoint Presentation Ideas Slideshow PDF
Presenting this set of slides with name medicine promotion key performance indicators ppt powerpoint presentation ideas slideshow pdf. This is a three stage process. The stages in this process are pre launch, organizational, readiness, at launch, market, readiness, post launch, launch success. This is a completely editable PowerPoint presentation and is available for immediate download. Download now and impress your audience.

Wellness Program Promotion Key Performance Indicators Ppt PowerPoint Presentation Infographics Inspiration PDF
Presenting this set of slides with name wellness program promotion key performance indicators ppt powerpoint presentation infographics inspiration pdf. This is a three stage process. The stages in this process are pre launch, organizational, readiness, at launch, market, readiness, post launch, launch success. This is a completely editable PowerPoint presentation and is available for immediate download. Download now and impress your audience.
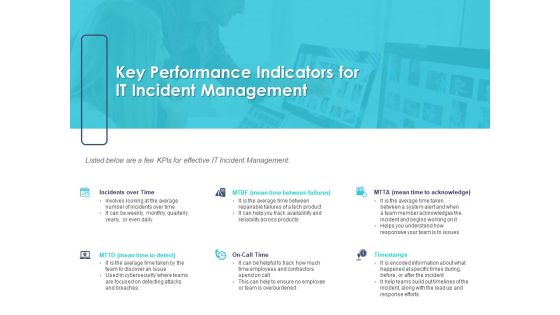
Managing ITIL Incidents Planning Key Performance Indicators For IT Incident Management Diagrams PDF
Presenting this set of slides with name managing itil incidents planning key performance indicators for it incident management diagrams pdf. This is a six stage process. The stages in this process are management, effective, acknowledge, cybersecurity. This is a completely editable PowerPoint presentation and is available for immediate download. Download now and impress your audience.

Key Performance Indicators For Market Sizing Ppt PowerPoint Presentation Visuals PDF
Presenting key performance indicators for market sizing ppt powerpoint presentation visuals pdf to dispense important information. This template comprises three stages. It also presents valuable insights into the topics including tam, sam, som. This is a completely customizable PowerPoint theme that can be put to use immediately. So, download it and address the topic impactfully.
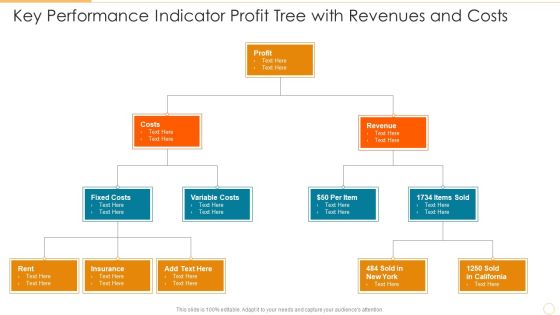
Key Performance Indicator Profit Tree With Revenues And Costs Template PDF
Presenting key performance indicator profit tree with revenues and costs template pdf to dispense important information. This template comprises three stages. It also presents valuable insights into the topics including costs, profit, revenue. This is a completely customizable PowerPoint theme that can be put to use immediately. So, download it and address the topic impactfully.

Organizational Key Performance Indicator Tree Depicting Market And Company Revenue Graphics PDF
Presenting organizational key performance indicator tree depicting market and company revenue graphics pdf to dispense important information. This template comprises three stages. It also presents valuable insights into the topics including total market revenue, company revenue, increase market share. This is a completely customizable PowerPoint theme that can be put to use immediately. So, download it and address the topic impactfully.
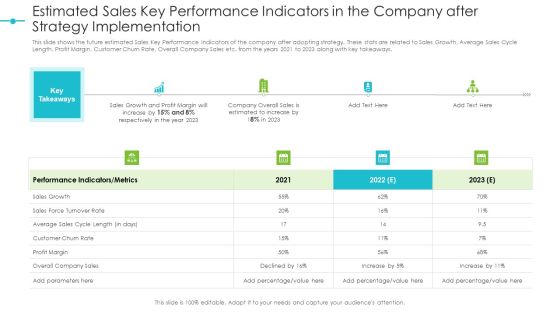
Estimated Sales Key Performance Indicators In The Company After Strategy Implementation Structure PDF
This slide shows the future estimated Sales Key Performance Indicators of the company after adopting strategy. These stats are related to Sales Growth, Average Sales Cycle Length, Profit Margin, Customer Churn Rate, Overall Company Sales etc. from the years 2021 to 2023 along with key takeaways. This is a estimated sales key performance indicators in the company after strategy implementation structure pdf template with various stages. Focus and dispense information on four stages using this creative set, that comes with editable features. It contains large content boxes to add your information on topics like performance, sales, growth, profit margin. You can also showcase facts, figures, and other relevant content using this PPT layout. Grab it now.
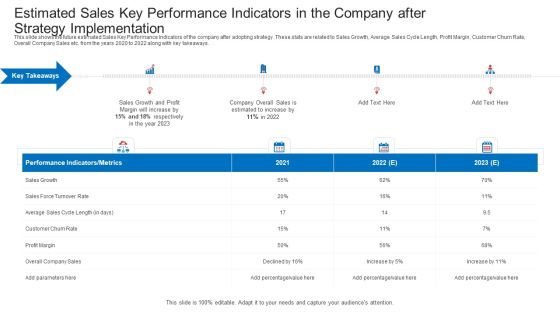
Estimated Sales Key Performance Indicators In The Company After Strategy Implementation Information PDF
This slide shows the future estimated Sales Key Performance Indicators of the company after adopting strategy. These stats are related to Sales Growth, Average Sales Cycle Length, Profit Margin, Customer Churn Rate, Overall Company Sales etc. from the years 2021 to 2023 along with key takeaways. This is a estimated sales key performance indicators in the company after strategy implementation information pdf template with various stages. Focus and dispense information on four stages using this creative set, that comes with editable features. It contains large content boxes to add your information on topics like performance, sales, growth, profit margin. You can also showcase facts, figures, and other relevant content using this PPT layout. Grab it now.
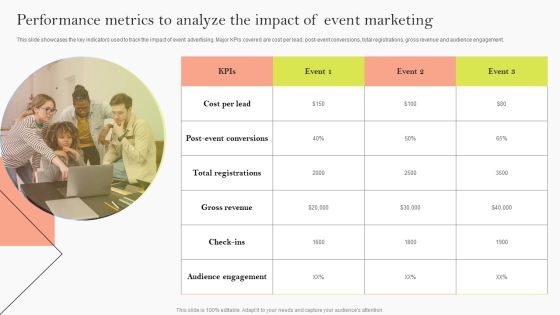
Performance Metrics To Analyze The Impact Of Event Marketing Ppt Model Good PDF
This slide showcases the key indicators used to track the impact of event advertising. Major KPIs covered are cost per lead, post-event conversions, total registrations, gross revenue and audience engagement. This modern and well arranged Performance Metrics To Analyze The Impact Of Event Marketing Ppt Model Good PDF provides lots of creative possibilities. It is very simple to customize and edit with the Powerpoint Software. Just drag and drop your pictures into the shapes. All facets of this template can be edited with Powerpoint no extra software is necessary. Add your own material, put your images in the places assigned for them, adjust the colors, and then you can show your slides to the world, with an animated slide included.
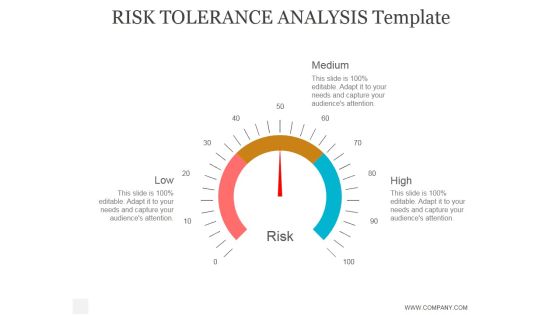
Risk Tolerance Analysis Template Ppt PowerPoint Presentation Example
This is a risk tolerance analysis template ppt powerpoint presentation example. This is a four stage process. The stages in this process are business, strategy, marketing, analysis, success, arrow.

Monitoring Employee Activity Ppt PowerPoint Presentation Slides Images Cpb
This is a monitoring employee activity ppt powerpoint presentation slides images cpb. This is a four stage process. The stages in this process are monitoring employee activity.

Employee Activity Monitor Ppt Powerpoint Presentation Gallery Portrait Cpb
This is a employee activity monitor ppt powerpoint presentation gallery portrait cpb. This is a three stage process. The stages in this process are employee activity monitor.
Five Key Performance Indicators Of Sales Team With Icons Ppt PowerPoint Presentation Gallery Introduction PDF
Persuade your audience using this five key performance indicators of sales team with icons ppt powerpoint presentation gallery introduction pdf. This PPT design covers five stages, thus making it a great tool to use. It also caters to a variety of topics including sales, win, revenue. Download this PPT design now to present a convincing pitch that not only emphasizes the topic but also showcases your presentation skills.
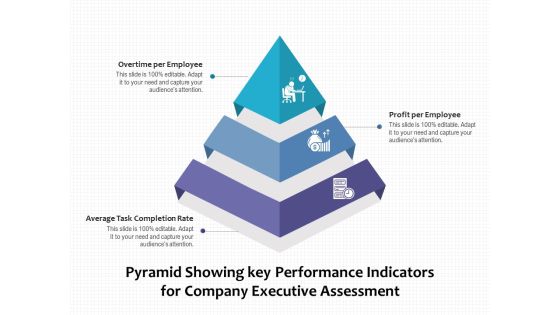
Pyramid Showing Key Performance Indicators For Company Executive Assessment Ppt PowerPoint Presentation Portfolio Rules PDF
Presenting pyramid showing key performance indicators for company executive assessment ppt powerpoint presentation portfolio rules pdf to dispense important information. This template comprises three stages. It also presents valuable insights into the topics including overtime per employee, profit per employee, average task completion rate. This is a completely customizable PowerPoint theme that can be put to use immediately. So, download it and address the topic impactfully.

Pyramid Showing Key Performance Indicators For Ecommerce Website Evaluation Ppt PowerPoint Presentation Portfolio Layout Ideas PDF
Persuade your audience using this pyramid showing key performance indicators for ecommerce website evaluation ppt powerpoint presentation portfolio layout ideas pdf. This PPT design covers three stages, thus making it a great tool to use. It also caters to a variety of topics including average order value, gross profit, shopping cart abandonment rate. Download this PPT design now to present a convincing pitch that not only emphasizes the topic but also showcases your presentation skills.

Pyramid Showing Key Performance Indicators For Healthcare Assessment Ppt PowerPoint Presentation Show Background Image PDF
Presenting pyramid showing key performance indicators for healthcare assessment ppt powerpoint presentation show background image pdf to dispense important information. This template comprises four stages. It also presents valuable insights into the topics including average treatment charge, average hospital stay, bed occupancy rate, average patient wait time. This is a completely customizable PowerPoint theme that can be put to use immediately. So, download it and address the topic impactfully.

Pyramid Showing Key Performance Indicators Of Customer Assessment Ppt PowerPoint Presentation Styles Graphics Template PDF
Presenting pyramid showing key performance indicators of customer assessment ppt powerpoint presentation styles graphics template pdf to dispense important information. This template comprises four stages. It also presents valuable insights into the topics including net promoter score, customer satisfaction and retention, customer acquisition cost, customer lifetime value. This is a completely customizable PowerPoint theme that can be put to use immediately. So, download it and address the topic impactfully.
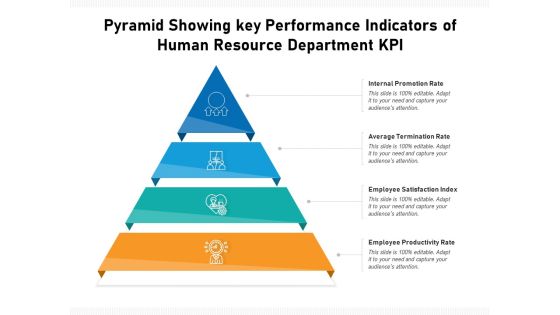
Pyramid Showing Key Performance Indicators Of Human Resource Department KPI Ppt PowerPoint Presentation Infographics Samples PDF
Persuade your audience using this pyramid showing key performance indicators of human resource department kpi ppt powerpoint presentation infographics samples pdf. This PPT design covers four stages, thus making it a great tool to use. It also caters to a variety of topics including internal promotion rate, average termination rate, employee satisfaction index, employee productivity rate. Download this PPT design now to present a convincing pitch that not only emphasizes the topic but also showcases your presentation skills.
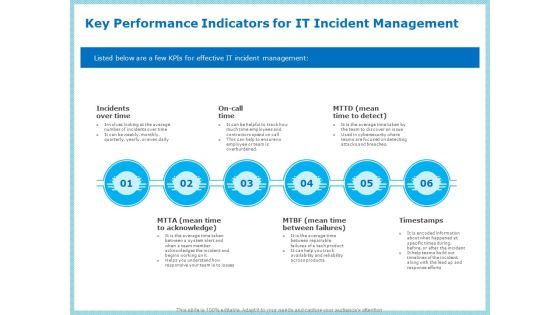
IT Infrastructure Library Incident Handling Procedure Key Performance Indicators For IT Incident Management Professional PDF
This is a it infrastructure library incident handling procedure key performance indicators for it incident management professional pdf template with various stages. Focus and dispense information on six stages using this creative set, that comes with editable features. It contains large content boxes to add your information on topics like incidents over time, timestamps, mean time to detect, on call time. You can also showcase facts, figures, and other relevant content using this PPT layout. Grab it now.
Key Performance Indicators Of Nss Electronic Manufacturing Company With Future Targets Icons PDF
Presenting key performance indicators of nss electronic manufacturing company with future targets icons pdf to provide visual cues and insights. Share and navigate important information on five stages that need your due attention. This template can be used to pitch topics like company revenue, labor shortage rate, on standard operating efficiency. In addtion, this PPT design contains high resolution images, graphics, etc, that are easily editable and available for immediate download.

Decreasing Insurance Rate In Countryside Communities Case Competition Key Performance Indicators Total Icons PDF
Presenting decreasing insurance rate in countryside communities case competition key performance indicators total icons pdf to provide visual cues and insights. Share and navigate important information on two stages that need your due attention. This template can be used to pitch topics like total numbers of customers, customer satisfaction level, insurance policies sold. In addtion, this PPT design contains high resolution images, graphics, etc, that are easily editable and available for immediate download.
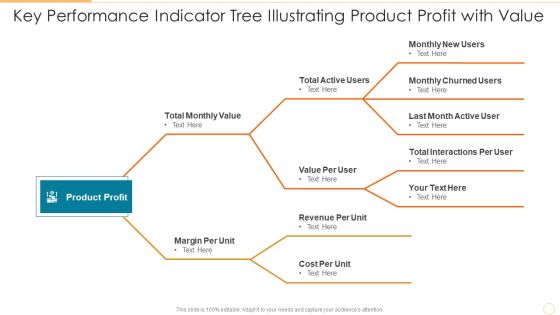
Key Performance Indicator Tree Illustrating Product Profit With Value Brochure PDF
Persuade your audience using this key performance indicator tree illustrating product profit with value brochure pdf. This PPT design covers three stages, thus making it a great tool to use. It also caters to a variety of topics including value per user, revenue per unit, cost per unit. Download this PPT design now to present a convincing pitch that not only emphasizes the topic but also showcases your presentation skills.
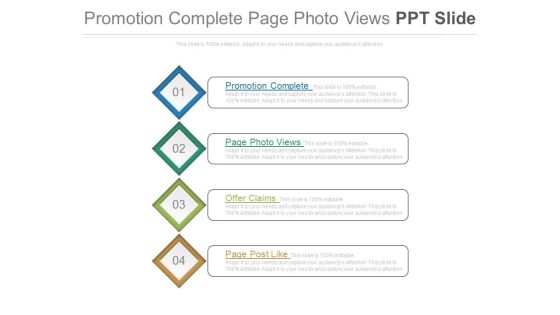
Promotion Complete Page Photo Views Ppt Slide
This is a promotion complete page photo views ppt slide. This is a four stage process. The stages in this process are marketing, success, business.

Scrapbooking Photo Book Timeline Diagram Powerpoint Slides
This is a scrapbooking photo book timeline diagram powerpoint slides. This is a eight stage process. The stages in this process are business, marketing, years, timeline, future, success.

Major In Big Latest Facts About Data And Analytics Portrait PDF
This slide covers major trends in big data and analytics. It involves latest trends such as digital transformation, climate change research, real time analytics and data governance. Presenting Major In Big Latest Facts About Data And Analytics Portrait PDF to dispense important information. This template comprises Four stages. It also presents valuable insights into the topics including Digital Transformation, Climate Change Research, Real Time Analytics. This is a completely customizable PowerPoint theme that can be put to use immediately. So, download it and address the topic impactfully.

Enterprise Staffing Data Software Comparison Professional PDF
The following slide showcases comparison of software that assists in gathering recruitment data. The table include software rating and features such as automation, recruitment marketing and analytics. Persuade your audience using this Enterprise Staffing Data Software Comparison Professional PDF. This PPT design covers five stages, thus making it a great tool to use. It also caters to a variety of topics including Automation, Recruitment Marketing, Analytics. Download this PPT design now to present a convincing pitch that not only emphasizes the topic but also showcases your presentation skills.

Break Even Analysis Ppt PowerPoint Presentation Styles Template
This is a break even analysis ppt powerpoint presentation styles template. This is a five stage process. The stages in this process are fixed cost, variable cost, key comments on the table, units of output, business.

Challenges In Online Marketing Analytics Elements PDF
This slide presents some pain points in digital marketing analytics that hinder smooth data sourcing and analysis helpful in gaining insights on them and taking appropriate action. This includes non-existing data, data silos, difficulty in analyzing, difficulty in trusting data. Presenting Challenges In Online Marketing Analytics Elements PDF to dispense important information. This template comprises four stages. It also presents valuable insights into the topics including Data Silos, Difficult Analyze Data, Difficult Trust Data. This is a completely customizable PowerPoint theme that can be put to use immediately. So, download it and address the topic impactfully.
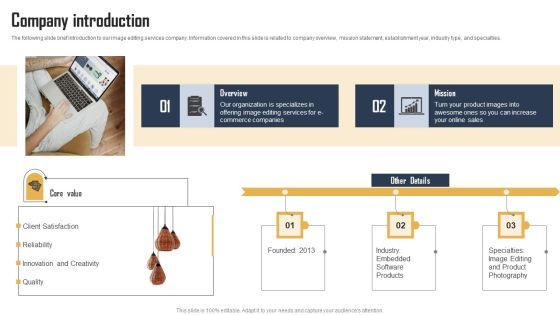
Ecommerce Photo Editing Services Fundraising Deck Company Introduction Professional PDF
The following slide brief introduction to our image editing services company. Information covered in this slide is related to company overview, mission statement, establishment year, industry type, and specialties. The Ecommerce Photo Editing Services Fundraising Deck Company Introduction Professional PDF is a compilation of the most recent design trends as a series of slides. It is suitable for any subject or industry presentation, containing attractive visuals and photo spots for businesses to clearly express their messages. This template contains a variety of slides for the user to input data, such as structures to contrast two elements, bullet points, and slides for written information. Slidegeeks is prepared to create an impression.
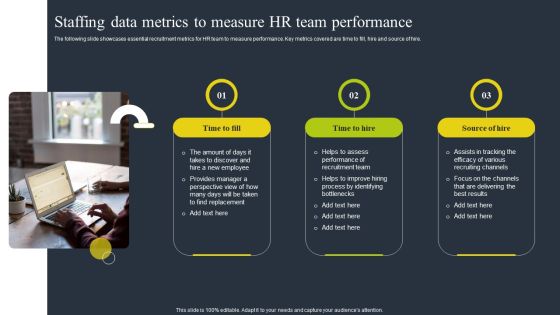
Staffing Data Metrics To Measure HR Team Performance Graphics PDF
The following slide showcases essential recruitment metrics for HR team to measure performance. Key metrics covered are time to fill, hire and source of hire. Presenting Staffing Data Metrics To Measure HR Team Performance Graphics PDF to dispense important information. This template comprises three stages. It also presents valuable insights into the topics including Employee, Recruitment Team, Recruiting Channels. This is a completely customizable PowerPoint theme that can be put to use immediately. So, download it and address the topic impactfully.

9 Process Diagram For Data Analytic Skills Ppt PowerPoint Presentation Ideas PDF
Persuade your audience using this 9 process diagram for data analytic skills ppt powerpoint presentation ideas pdf. This PPT design covers nine stages, thus making it a great tool to use. It also caters to a variety of topics including 9 process diagram for data analytic skills. Download this PPT design now to present a convincing pitch that not only emphasizes the topic but also showcases your presentation skills.
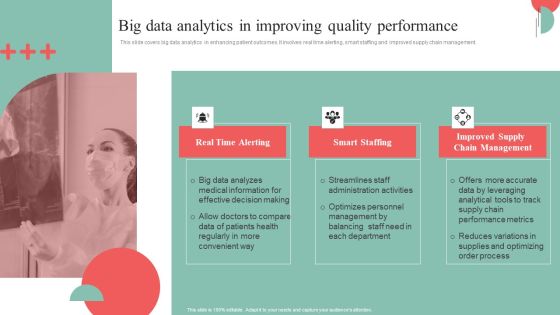
Incorporating HIS To Enhance Healthcare Services Big Data Analytics In Improving Quality Performance Microsoft PDF
This slide covers big data analytics in enhancing patient outcomes. It involves real time alerting, smart staffing and improved supply chain management. There are so many reasons you need a Incorporating HIS To Enhance Healthcare Services Big Data Analytics In Improving Quality Performance Microsoft PDF. The first reason is you cannot spend time making everything from scratch, Thus, Slidegeeks has made presentation templates for you too. You can easily download these templates from our website easily.
Key Issues Of Data Analytics With Shortage Of Skills Ppt PowerPoint Presentation File Inspiration PDF
Presenting key issues of data analytics with shortage of skills ppt powerpoint presentation file inspiration pdf to dispense important information. This template comprises one stages. It also presents valuable insights into the topics including data, skills, visual representation. This is a completely customizable PowerPoint theme that can be put to use immediately. So, download it and address the topic impactfully.

Running Facebook Advertisement Campaign To Boost Sales Ppt PowerPoint Presentation File Portfolio PDF
The following slide outlines overview of Facebook ad campaign that can assist brands in increasing product or service revenue. The slide provides information about campaign goals, ad format, projected expenditure, target audience, content techniques, and key performance indicators KPIs. The Running Facebook Advertisement Campaign To Boost Sales Ppt PowerPoint Presentation File Portfolio PDF is a compilation of the most recent design trends as a series of slides. It is suitable for any subject or industry presentation, containing attractive visuals and photo spots for businesses to clearly express their messages. This template contains a variety of slides for the user to input data, such as structures to contrast two elements, bullet points, and slides for written information. Slidegeeks is prepared to create an impression.
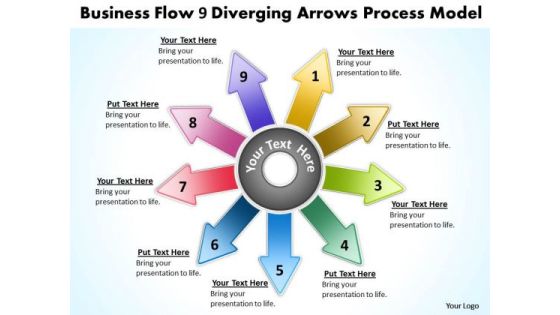
Templates Flow 9 Diverging Arrows Process Model Circular PowerPoint Slides
We present our templates flow 9 diverging arrows process model Circular PowerPoint Slides.Download our Arrows PowerPoint Templates because this template contains the material to highlight the key issues of your presentation. Use our Circle Charts PowerPoint Templates because we all know that alphabetical order is a time honoured concept. Use our Shapes PowerPoint Templates because it highlights the important timelines and milestones of this exciting journey. Download and present our Business PowerPoint Templates because your fledgling career is in the chrysallis stage. Nurture it and watch it grow into a beautiful butterfly. Download our Flow Charts PowerPoint Templates because it helps to churn the mixture to the right degree and pound home your views and expectations in a spectacularly grand and virtuoso fluid performance.Use these PowerPoint slides for presentations relating to arrow, arrowheads, badge, banner, blue, button, cerulean, cobalt, colored, colorful, connection, cursor, cyan, design element, designator, directional, download, emblem, gray shadow, green, icon, indicator, interface, internet, link, load, magenta, marker, navigation panel, next, orientation, page site, pictogram, pink, pointer, red, right, satined, sign, signpost, smooth, symbol, . The prominent colors used in the PowerPoint template are Purple, Red, Green. Presenters tell us our templates flow 9 diverging arrows process model Circular PowerPoint Slides are Detailed. You can be sure our cerulean PowerPoint templates and PPT Slides will impress their bosses and teams. Professionals tell us our templates flow 9 diverging arrows process model Circular PowerPoint Slides are Royal. People tell us our blue PowerPoint templates and PPT Slides are Ultra. People tell us our templates flow 9 diverging arrows process model Circular PowerPoint Slides are Swanky. Professionals tell us our blue PowerPoint templates and PPT Slides effectively help you save your valuable time.

Employee Internet Activity Monitoring Ppt PowerPoint Presentation Inspiration Format Cpb
This is a employee internet activity monitoring ppt powerpoint presentation inspiration format cpb. This is a nine stage process. The stages in this process are employee internet activity monitoring.

Corporate Resource Planning What Is Cloud ERP System Inspiration PDF
This slide defines the cloud ERP system, how data is stored at cloud servers and accessed through web browsers. It also shows how it is beneficial to save costs.Presenting Corporate Resource Planning What Is Cloud ERP System Inspiration PDF to provide visual cues and insights. Share and navigate important information on three stages that need your due attention. This template can be used to pitch topics like Data Warehouse, Portable Devices, Internet Of Things In addtion, this PPT design contains high resolution images, graphics, etc, that are easily editable and available for immediate download.

Decision Support System Basic Architecture Of Data Warehouse Ppt File Background Designs PDF
This slide depicts the basic architecture of a data warehouse and how information is processed and stored in this architecture through metadata, raw data, and summary data. Presenting Decision Support System Basic Architecture Of Data Warehouse Ppt File Background Designs PDF to provide visual cues and insights. Share and navigate important information on one stages that need your due attention. This template can be used to pitch topics like Data Sources, Warehouse, Analysis, Reporting. In addtion, this PPT design contains high resolution images, graphics, etc, that are easily editable and available for immediate download.

Predictive Data Model Uses And Benefits Of Predictive Analytics In Manufacturing Introduction PDF
This slide talks about using predictive analytics in manufacturing forecasting for optimal use of resources. The use cases include predictive maintenance analytics, quality, predictive demand, and workforce analytics. If your project calls for a presentation, then Slidegeeks is your go-to partner because we have professionally designed, easy-to-edit templates that are perfect for any presentation. After downloading, you can easily edit Predictive Data Model Uses And Benefits Of Predictive Analytics In Manufacturing Introduction PDF and make the changes accordingly. You can rearrange slides or fill them with different images. Check out all the handy templates

Playbook For Enterprise Transformation Administration Key Kpis For Digital Transformation Sample PDF
Purpose of the following slide is to show the KPI which can be used to measure the digital transformation, these KPIs can be customer experience, user metrics and application metrics. This is a Playbook For Enterprise Transformation Administration Key Kpis For Digital Transformation Sample PDF template with various stages. Focus and dispense information on five stages using this creative set, that comes with editable features. It contains large content boxes to add your information on topics like User Metrics, Application Metrics, Customer Experience Metrics. You can also showcase facts, figures, and other relevant content using this PPT layout. Grab it now.

What Is Big Data Analytics Ppt PowerPoint Presentation File Background Images PDF
This is a What Is Big Data Analytics Ppt PowerPoint Presentation File Background Images PDF template with various stages. Focus and dispense information on eight stages using this creative set, that comes with editable features. It contains large content boxes to add your information on topics like Cloud Technology, Visualization, Analysis. You can also showcase facts, figures, and other relevant content using this PPT layout. Grab it now.

Information Studies Tasks And Skills Of Data And Analytics Manager Introduction PDF
This slide depicts the tasks performed by a data and analytics manager and skills he should have, such as leadership and project management qualities, interpersonal communication skills, and so on. Presenting Information Studies Tasks And Skills Of Data And Analytics Manager Introduction PDF to provide visual cues and insights. Share and navigate important information on six stages that need your due attention. This template can be used to pitch topics like Interpersonal Communication, Leadership Project Management, Database Systems. In addtion, this PPT design contains high resolution images, graphics, etc, that are easily editable and available for immediate download.

Table Of Contenst Toolkit For Data Science And Analytics Transition Professional PDF
Here you can discover an assortment of the finest PowerPoint and Google Slides templates. With these templates, you can create presentations for a variety of purposes while simultaneously providing your audience with an eye catching visual experience. Download Table Of Contenst Toolkit For Data Science And Analytics Transition Professional PDF to deliver an impeccable presentation. These templates will make your job of preparing presentations much quicker, yet still, maintain a high level of quality. Slidegeeks has experienced researchers who prepare these templates and write high quality content for you. Later on, you can personalize the content by editing the Table Of Contenst Toolkit For Data Science And Analytics Transition Professional PDF.

Predictive Data Model Applications Of Predictive Analytics Fraud Detection Microsoft PDF
This slide represents the application of predictive analytics in fraud detection in various industries. Predictive analytics help combat these frauds by sifting through large amounts of information and submitting the suspicious ones to the investigation teams. Get a simple yet stunning designed Predictive Data Model Applications Of Predictive Analytics Fraud Detection Microsoft PDF. It is the best one to establish the tone in your meetings. It is an excellent way to make your presentations highly effective. So, download this PPT today from Slidegeeks and see the positive impacts. Our easy-to-edit Predictive Data Model Applications Of Predictive Analytics Fraud Detection Microsoft PDF can be your go-to option for all upcoming conferences and meetings. So, what are you waiting for Grab this template today.
