Business Snapshot
Electronic Data Management For R And D Vector Icon Ppt PowerPoint Presentation File Inspiration PDF
Persuade your audience using this electronic data management for r and d vector icon ppt powerpoint presentation file inspiration pdf. This PPT design covers three stages, thus making it a great tool to use. It also caters to a variety of topics including electronic data management for r and d vector icon. Download this PPT design now to present a convincing pitch that not only emphasizes the topic but also showcases your presentation skills.

Key Performance Indicators Cycle Ppt Slide
This is a key performance indicators cycle ppt slide. This is a five stage process. The stages in this process are key performance indicators, kpi.
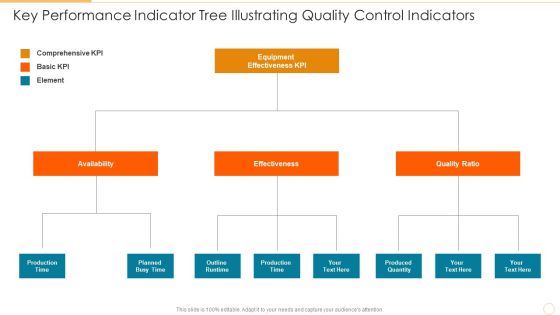
Key Performance Indicator Tree Illustrating Quality Control Indicators Information PDF
Presenting key performance indicator tree illustrating quality control indicators information pdf to dispense important information. This template comprises three stages. It also presents valuable insights into the topics including availability, effectiveness, quality ratio. This is a completely customizable PowerPoint theme that can be put to use immediately. So, download it and address the topic impactfully.

Executing Automotive Marketing Tactics For Sales Boost Magnifying Glass Topics PDF
This modern and well arranged Executing Automotive Marketing Tactics For Sales Boost Magnifying Glass Topics PDF provides lots of creative possibilities. It is very simple to customize and edit with the Powerpoint Software. Just drag and drop your pictures into the shapes. All facets of this template can be edited with Powerpoint no extra software is necessary. Add your own material, put your images in the places assigned for them, adjust the colors, and then you can show your slides to the world, with an animated slide included.

Bar Chart With Magnifying Glass And Dollar Symbol For Financial Analysis Ppt PowerPoint Presentation File Structure PDF
Presenting this set of slides with name bar chart with magnifying glass and dollar symbol for financial analysis ppt powerpoint presentation file structure pdf. This is a one stage process. The stages in this process is bar chart with magnifying glass and dollar symbol for financial analysis. This is a completely editable PowerPoint presentation and is available for immediate download. Download now and impress your audience.

Industry Report Of Packaged Food Products Part 2 Nomad Foods Core Competency Clipart PDF
The Industry Report Of Packaged Food Products Part 2 Nomad Foods Core Competency Clipart PDF is a compilation of the most recent design trends as a series of slides. It is suitable for any subject or industry presentation, containing attractive visuals and photo spots for businesses to clearly express their messages. This template contains a variety of slides for the user to input data, such as structures to contrast two elements, bullet points, and slides for written information. Slidegeeks is prepared to create an impression.

Submission Of Project Viability Report For Bank Loan Table Of Contents Elements PDF
Purpose of this slide is to address staffing strategy matrix. Here each strategy is identified as either directly applicable to a specific work type or indirectly applicable. The Submission Of Project Viability Report For Bank Loan Table Of Contents Elements PDF is a compilation of the most recent design trends as a series of slides. It is suitable for any subject or industry presentation, containing attractive visuals and photo spots for businesses to clearly express their messages. This template contains a variety of slides for the user to input data, such as structures to contrast two elements, bullet points, and slides for written information. Slidegeeks is prepared to create an impression.

Call Center Application Market Industry Growth Drivers Of Contact Center Software Market Platforms Pictures PDF
Following slide provides information about the growth drivers of Contact Center Software Industry globally that help food delivery companies to successfully execute their growth strategy. This is a call center application market industry growth drivers of contact center software market platforms pictures pdf template with various stages. Focus and dispense information on five stages using this creative set, that comes with editable features. It contains large content boxes to add your information on topics like social media, customer relationship management, enhanced network connectivity, cloud based contact. You can also showcase facts, figures, and other relevant content using this PPT layout. Grab it now.
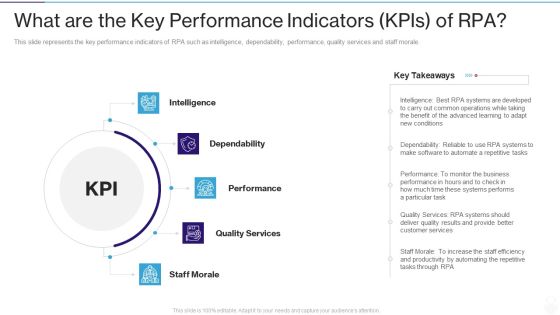
RPA IT What Are The Key Performance Indicators Kpis Of RPA Ppt Professional Design Templates PDF
This slide represents the key performance indicators of RPA such as intelligence, dependability, performance, quality services and staff morale. This is a rpa it what are the key performance indicators kpis of rpa ppt professional design templates pdf template with various stages. Focus and dispense information on five stages using this creative set, that comes with editable features. It contains large content boxes to add your information on topics like staff morale, quality services, performance, dependability, intelligence. You can also showcase facts, figures, and other relevant content using this PPT layout. Grab it now.
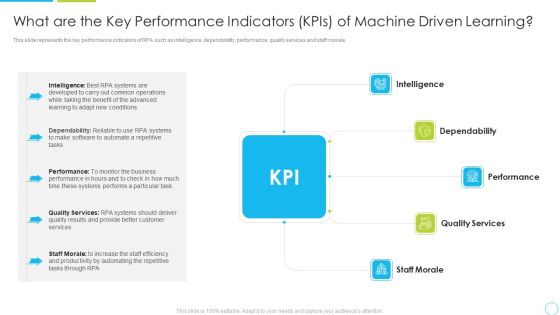
What Are The Key Performance Indicators Kpis Of Machine Driven Learning Ppt Styles Slideshow PDF
This slide represents the key performance indicators of RPA such as intelligence, dependability, performance, quality services and staff morale. This is a what are the key performance indicators kpis of machine driven learning ppt styles slideshow pdf template with various stages. Focus and dispense information on five stages using this creative set, that comes with editable features. It contains large content boxes to add your information on topics like dependability, intelligence, performance, quality services, staff morale. You can also showcase facts, figures, and other relevant content using this PPT layout. Grab it now.
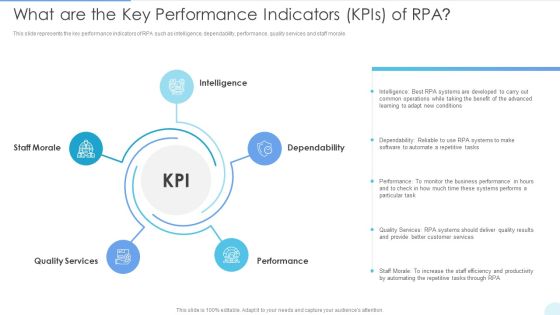
What Are The Key Performance Indicators Kpis Of RPA Structure PDF
This slide represents the key performance indicators of RPA such as intelligence, dependability, performance, quality services and staff morale. This is a What Are The Key Performance Indicators Kpis Of RPA Structure PDF template with various stages. Focus and dispense information on five stages using this creative set, that comes with editable features. It contains large content boxes to add your information on topics like Dependability, Performance, Quality Services. You can also showcase facts, figures, and other relevant content using this PPT layout. Grab it now.

Corporate Product And Overall Corporate Branding Performance Tracking Dashboard Sample PDF
This slide provides information regarding corporate branding performance tracking dashboard in terms of leads, conversion metrics, web traffic, etc. Do you have an important presentation coming up Are you looking for something that will make your presentation stand out from the rest Look no further than Corporate Product And Overall Corporate Branding Performance Tracking Dashboard Sample PDF. With our professional designs, you can trust that your presentation will pop and make delivering it a smooth process. And with Slidegeeks, you can trust that your presentation will be unique and memorable. So why wait Grab Corporate Product And Overall Corporate Branding Performance Tracking Dashboard Sample PDF today and make your presentation stand out from the rest.

Data Lineage Implementation Features Of Data Lineage Tools Template PDF
This slide talks about the features of data lineage tools that include visualization, customization and connection, reports, data catalogue, simple installation, and automated documentation. These features make information transparent, reliable, and ready for analysis. The best PPT templates are a great way to save time, energy, and resources. Slidegeeks have 100 percent editable powerpoint slides making them incredibly versatile. With these quality presentation templates, you can create a captivating and memorable presentation by combining visually appealing slides and effectively communicating your message. Download Data Lineage Implementation Features Of Data Lineage Tools Template PDF from Slidegeeks and deliver a wonderful presentation.

What Are The Key Performance Indicators Kpis Of RPA Robotic Process Automation Technology Graphics PDF
This slide represents the key performance indicators of RPA such as intelligence, dependability, performance, quality services and staff morale.This is a What Are The Key Performance Indicators Kpis Of RPA Robotic Process Automation Technology Graphics PDF template with various stages. Focus and dispense information on five stages using this creative set, that comes with editable features. It contains large content boxes to add your information on topics like Dependability, Intelligence, Quality Services. You can also showcase facts, figures, and other relevant content using this PPT layout. Grab it now.

Data Interpretation And Analysis Playbook The Problem With Todays Bi Projects Data Analytics Playbook Introduction PDF
This template depicts that the big data under control is a significant challenge for businesses. It also illustrates that Organizations need for data and analytics has exceeded the volume of insights that companies can currently generate. This is a data interpretation and analysis playbook the problem with todays bi projects data analytics playbook introduction pdf template with various stages. Focus and dispense information on seven stages using this creative set, that comes with editable features. It contains large content boxes to add your information on topics like organization, analysts, business, data driven. You can also showcase facts, figures, and other relevant content using this PPT layout. Grab it now.
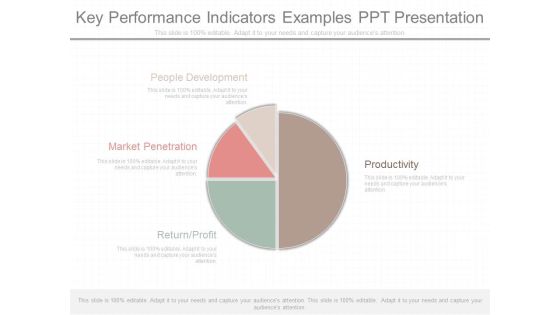
Key Performance Indicators Examples Ppt Presentation
This is a key performance indicators examples ppt presentation. This is a four stage process. The stages in this process are people development, productivity, market penetration, return profit.
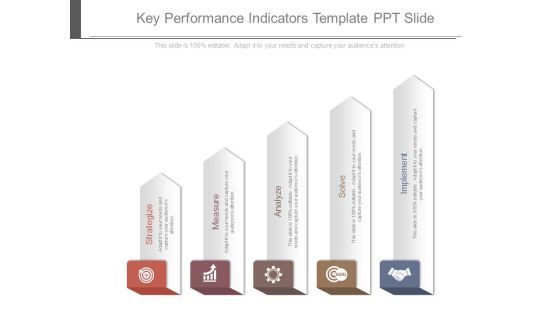
Key Performance Indicators Template Ppt Slide
This is a key performance indicators template ppt slide. This is a five stage process. The stages in this process are strategize, measure, analyze, solve, implement.

Key Performance Indicators For Growth Powerpoint Slides
This is a key performance indicators for growth powerpoint slides. This is a five stage process. The stages in this process are kpi.

Data Assimilation BI Applications Monitoring Ppt Icon Maker PDF
Presenting data assimilation bi applications monitoring ppt icon maker pdf to provide visual cues and insights. Share and navigate important information on nine stages that need your due attention. This template can be used to pitch topics like digital dashboards, business, monitoring, data warehouse, data mining. In addtion, this PPT design contains high resolution images, graphics, etc, that are easily editable and available for immediate download.

Call Center Quality Enhancement Plan Table Of Contents Brochure PDF
Slidegeeks is here to make your presentations a breeze with Call Center Quality Enhancement Plan Table Of Contents Brochure PDF With our easy to use and customizable templates, you can focus on delivering your ideas rather than worrying about formatting. With a variety of designs to choose from, you are sure to find one that suits your needs. And with animations and unique photos, illustrations, and fonts, you can make your presentation pop. So whether you are giving a sales pitch or presenting to the board, make sure to check out Slidegeeks first.
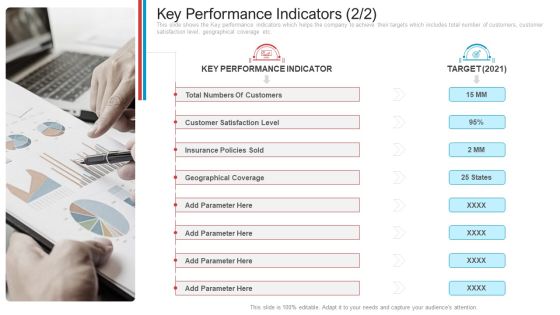
Key Performance Indicators Customers Introduction PDF
This slide shows the Key performance indicators which helps the company to achieve their targets which includes total number of customers, customer satisfaction level, geographical coverage etc. Presenting key performance indicators customers introduction pdf. to provide visual cues and insights. Share and navigate important information on seven stages that need your due attention. This template can be used to pitch topics like total numbers of customers, customer satisfaction level, insurance policies sold, geographical coverage, key performance indicator. In addtion, this PPT design contains high resolution images, graphics, etc, that are easily editable and available for immediate download.

Key Performance Indicators Ppt PowerPoint Presentation Show Graphics Design
Presenting this set of slides with name key performance indicators ppt powerpoint presentation show graphics design. This is a five stage process. The stages in this process are business, management, planning, strategy, marketing. This is a completely editable PowerPoint presentation and is available for immediate download. Download now and impress your audience.

Key Performance Indicators Ppt PowerPoint Presentation Outline Samples
Presenting this set of slides with name key performance indicators ppt powerpoint presentation outline samples. This is a five stage process. The stages in this process are business, management, planning, strategy, marketing. This is a completely editable PowerPoint presentation and is available for immediate download. Download now and impress your audience.
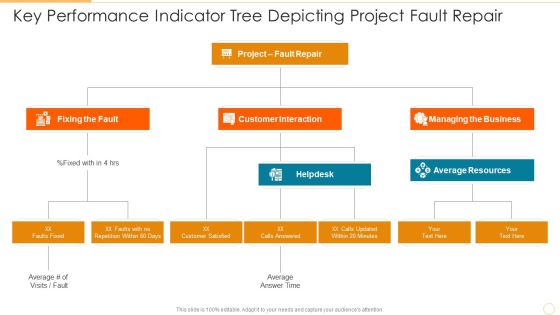
Key Performance Indicator Tree Depicting Project Fault Repair Diagrams PDF
Presenting key performance indicator tree depicting project fault repair diagrams pdf to dispense important information. This template comprises three stages. It also presents valuable insights into the topics including customer interaction, managing the business, fixing the fault. This is a completely customizable PowerPoint theme that can be put to use immediately. So, download it and address the topic impactfully.
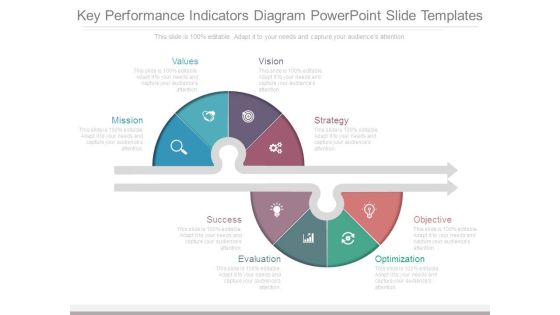
Key Performance Indicators Diagram Powerpoint Slide Templates
This is a key performance indicators diagram powerpoint slide templates. This is a eight stage process. The stages in this process are mission, values, vision, strategy, success, evaluation, optimization, objective.

Global Environmental And Market Trends Retail Market Trends Ppt PowerPoint Presentation Styles Information
This is a global environmental and market trends retail market trends ppt powerpoint presentation styles information. This is a eight stage process. The stages in this process are icons, management, strategy, analysis, marketing.

Key Performance Indicators Ppt PowerPoint Presentation Pictures Design Templates
This is a key performance indicators ppt powerpoint presentation pictures design templates. This is a five stage process. The stages in this process are day sales outstanding, cost of goods sold, customer retention rate.

ADC Cosmetics Company Dashboard With Variables Ppt Backgrounds PDF
This slide shows a cosmetics and skin care sales dashboard with KPIs such as Profit Margin in 2019, Cross Selling Rate , Market Size , Stock Turnover Rate , Social Media Usage, Revenue etc.Presenting adc cosmetics company dashboard with variables ppt backgrounds pdf. to provide visual cues and insights. Share and navigate important information on eight stages that need your due attention. This template can be used to pitch topics like stock turnover rate 2021, social media usage 2021, net promotor score 2021. In addtion, this PPT design contains high resolution images, graphics, etc, that are easily editable and available for immediate download.

ADC Cosmetics Company Dashboard With Variables Summary PDF
This slide shows a cosmetics and skin care sales dashboard with KPIs such as Profit Margin in 2021, Cross Selling Rate , Market Size , Stock Turnover Rate , Social Media Usage, Revenue etc. Presenting adc cosmetics company dashboard with variables summary pdf to provide visual cues and insights. Share and navigate important information on eight stages that need your due attention. This template can be used to pitch topics like profit margin, cross selling rate, market size, revenue, stock turnover rate. In addtion, this PPT design contains high resolution images, graphics, etc, that are easily editable and available for immediate download.

Toolkit For Data Science And Analytics Transition Vendor Data Profile For Data Analytics Software Infographics PDF
This slide represents the list of vendors along with accompanying information including the key features, pros and cons of each vendor software. If your project calls for a presentation, then Slidegeeks is your go to partner because we have professionally designed, easy to edit templates that are perfect for any presentation. After downloading, you can easily edit Toolkit For Data Science And Analytics Transition Vendor Data Profile For Data Analytics Software Infographics PDF and make the changes accordingly. You can rearrange slides or fill them with different images. Check out all the handy templates.

Retail KPI Dashboard Showing Revenue Vs Units Sold Ppt PowerPoint Presentation Professional Smartart
This is a retail kpi dashboard showing revenue vs units sold ppt powerpoint presentation professional smartart. This is a four stage process. The stages in this process are finance, analysis, business, investment, marketing.

Retail KPI Dashboard Showing Sales Revenue Customers Ppt PowerPoint Presentation Show Background Designs
This is a retail kpi dashboard showing sales revenue customers ppt powerpoint presentation show background designs. This is a six stage process. The stages in this process are finance, analysis, business, investment, marketing.
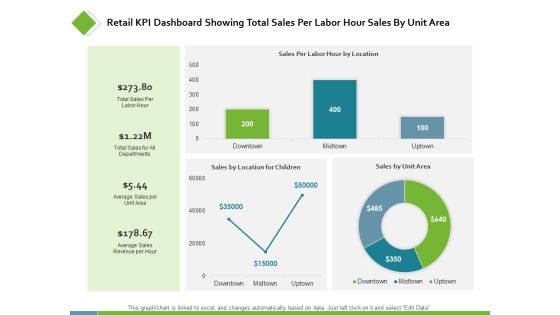
Retail KPI Dashboard Showing Total Sales Per Labor Ppt PowerPoint Presentation Styles Examples
This is a retail kpi dashboard showing total sales per labor ppt powerpoint presentation styles examples. This is a three stage process. The stages in this process are finance, analysis, business, investment, marketing.

Data Interpretation And Analysis Playbook Final Thoughts For Data Analytics Playbook Graphics PDF
This template covers the data analytics company final thoughts at the end of the e-book. This is a data interpretation and analysis playbook final thoughts for data analytics playbook graphics pdf template with various stages. Focus and dispense information on five stages using this creative set, that comes with editable features. It contains large content boxes to add your information on topics like business, analytics, growth, organization. You can also showcase facts, figures, and other relevant content using this PPT layout. Grab it now.

Illustration Of 6 Data Processes And Flows Circular Spoke Chart PowerPoint Slides
We present our illustration of 6 data processes and flows Circular Spoke Chart PowerPoint Slides.Present our Arrows PowerPoint Templates because this slide helps you to communicate your concerns and educate your team along the path to success. Download our Process and Flows PowerPoint Templates because it Highlights the results of you thought process and convinces your team of the reasons for selecting a particular path to follow. Present our Business PowerPoint Templates because project your ideas to you colleagues and complete the full picture. Download our Shapes PowerPoint Templates because different personalities, different abilities but formidable together. Download and present our Circle Charts PowerPoint Templates because this slide shows each path to the smallest detail.Use these PowerPoint slides for presentations relating to Arrows, Background, Blue, Chart, Circle, Circular, Circulation, Color, Connection, Continuity, Cycle, Cyclic, Diagram, Direction, Empty, Flow, Four, Dimensional, Graph, Icon, Presentation, Process, Progress, Reason, Recycle, Recycling, Repetition, Report, Result, Ring, Rotation, Round, Scheme, Section, Step, Symbol, Teamwork. The prominent colors used in the PowerPoint template are Yellow, Gray, White. Professionals tell us our illustration of 6 data processes and flows Circular Spoke Chart PowerPoint Slides are Beautiful. You can be sure our Circulation PowerPoint templates and PPT Slides are Charming. Customers tell us our illustration of 6 data processes and flows Circular Spoke Chart PowerPoint Slides look good visually. Professionals tell us our Circle PowerPoint templates and PPT Slides are Endearing. People tell us our illustration of 6 data processes and flows Circular Spoke Chart PowerPoint Slides are Energetic. People tell us our Chart PowerPoint templates and PPT Slides are Breathtaking.

Magnifying Glass Ppt PowerPoint Presentation Pictures Example File
This is a magnifying glass ppt powerpoint presentation pictures example file. This is a four stage process. The stages in this process are magnifier glass, research, business, marketing, focus.
Magnifying Glass Template 2 Ppt PowerPoint Presentation Pictures Deck
This is a magnifying glass template 2 ppt powerpoint presentation pictures deck. This is a one stage process. The stages in this process are business, magnifying glass, marketing, technology, planning.

Magnifying Glass Research Technology Ppt Powerpoint Presentation File Picture
This is a magnifying glass research technology ppt powerpoint presentation file picture. This is a four stage process. The stages in this process are magnifying glass, research, marketing, strategy, business.

Magnify Glass Technology Ppt PowerPoint Presentation Pictures Ideas
This is a magnify glass technology ppt powerpoint presentation pictures ideas. This is a one stage process. The stages in this process are magnifying glass, research, marketing, strategy, business.
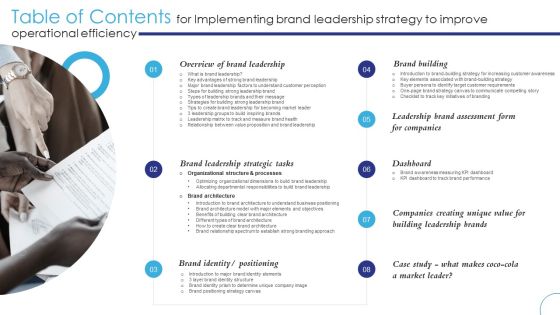
Table Of Contents For Implementing Brand Leadership Strategy To Improve Operationals Graphics PDF
Overview Brand Leadership, Brand Building, Dashboard
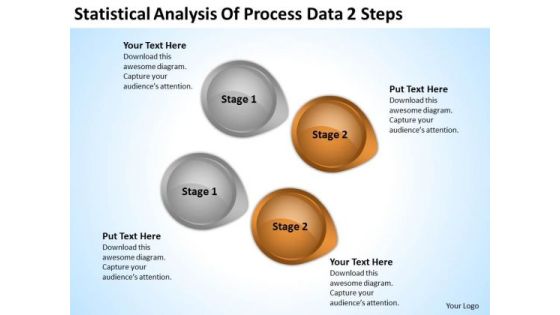
Arrow In PowerPoint Statistical Analysis Of Process Data 2 Steps Ppt Slide
We present our arrow in powerpoint statistical analysis of process data 2 steps ppt Slide.Download our Business PowerPoint Templates because Our PowerPoint Templates and Slides will weave a web of your great ideas. They are gauranteed to attract even the most critical of your colleagues. Use our Circle Charts PowerPoint Templates because Our PowerPoint Templates and Slides will let your words and thoughts hit bullseye everytime. Download our Arrows PowerPoint Templates because Our PowerPoint Templates and Slides will let you Hit the right notes. Watch your audience start singing to your tune. Download and present our Shapes PowerPoint Templates because You have the co-ordinates for your destination of success. Let our PowerPoint Templates and Slides map out your journey. Download and present our Signs PowerPoint Templates because It will let you Set new benchmarks with our PowerPoint Templates and Slides. They will keep your prospects well above par.Use these PowerPoint slides for presentations relating to 3d, abstract, analysis, arrow, background, business, button, chart, circle, circular, color, concept, conservation, cycle, development, diagram, direction, eco, ecology, energy, environment, flow, flowchart, globe, graphic, growing, growth, icon, internet, isolated, object, power, process, protection, recyclable, recycle, recycling, render, resource, saving, sign, solution, sphere, statistic, sustainable, symbol, technology, white. The prominent colors used in the PowerPoint template are Brown, Gray, Black. You can be sure our arrow in powerpoint statistical analysis of process data 2 steps ppt Slide are designed by professionals People tell us our button PowerPoint templates and PPT Slides will make the presenter look like a pro even if they are not computer savvy. You can be sure our arrow in powerpoint statistical analysis of process data 2 steps ppt Slide are designed by professionals Use our arrow PowerPoint templates and PPT Slides have awesome images to get your point across. Presenters tell us our arrow in powerpoint statistical analysis of process data 2 steps ppt Slide will make the presenter successul in his career/life. We assure you our arrow PowerPoint templates and PPT Slides are visually appealing.
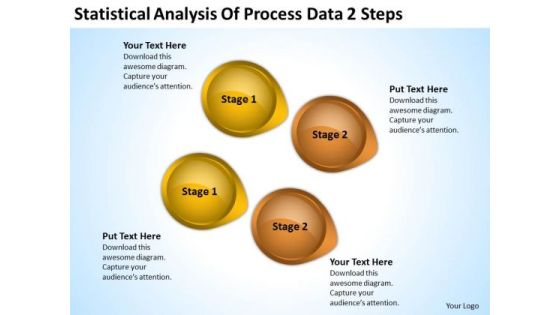
Power Point Arrows Statistical Analysis Of Process Data 2 Steps PowerPoint Templates
We present our power point arrows statistical analysis of process data 2 steps PowerPoint templates.Download and present our Business PowerPoint Templates because It is Aesthetically crafted by artistic young minds. Our PowerPoint Templates and Slides are designed to display your dexterity. Present our Arrows PowerPoint Templates because You can Rise to the occasion with our PowerPoint Templates and Slides. You will bring your audience on their feet in no time. Download and present our Circle Charts PowerPoint Templates because Our PowerPoint Templates and Slides help you pinpoint your timelines. Highlight the reasons for your deadlines with their use. Present our Shapes PowerPoint Templates because You aspire to touch the sky with glory. Let our PowerPoint Templates and Slides provide the fuel for your ascent. Present our Symbol PowerPoint Templates because You have gained great respect for your brilliant ideas. Use our PowerPoint Templates and Slides to strengthen and enhance your reputation.Use these PowerPoint slides for presentations relating to abstract, arrow, art, background, banner, blue, bright, business, circle, color, colorful, concept, conceptual, connection, creative, cycle, design, different, element, empty, flower, form, frame, graphic, green, group, idea, illustration, match, message, order, part, petal, piece, place, red, ring, shape, solution, special, speech, strategy, symbol, template, text, usable, vector, web, website. The prominent colors used in the PowerPoint template are Yellow, Brown, Black. People tell us our power point arrows statistical analysis of process data 2 steps PowerPoint templates will impress their bosses and teams. People tell us our circle PowerPoint templates and PPT Slides are designed by professionals Presenters tell us our power point arrows statistical analysis of process data 2 steps PowerPoint templates are second to none. We assure you our banner PowerPoint templates and PPT Slides will make the presenter successul in his career/life. Presenters tell us our power point arrows statistical analysis of process data 2 steps PowerPoint templates will help you be quick off the draw. Just enter your specific text and see your points hit home. Professionals tell us our background PowerPoint templates and PPT Slides will make the presenter look like a pro even if they are not computer savvy.

Key Performance Indicators For Smarketing Ppt Icon Graphic Images PDF
This slide shows various KPIs which can be used to measure marketing and sales alignment. These are overall revenue, sales cycle length, marketing qualified leads, etc. Presenting Key Performance Indicators For Smarketing Ppt Icon Graphic Images PDF to dispense important information. This template comprises one stages. It also presents valuable insights into the topics including KPIs, Overall Revenue, Sales Cycle Length. This is a completely customizable PowerPoint theme that can be put to use immediately. So, download it and address the topic impactfully.

Company Success Strategy Powerpoint Ideas
This is a company success strategy powerpoint ideas. This is a five stage process. The stages in this process are business, marketing, success, strategy, target.

Dashboard For Tracking Impact Of Procurement Process Automation Inspiration PDF
This slide covers the dashboard for analysing procurement performance after automation. It include KPIs such as on-time delivery, percentage of returns, compliance index percentage, procurement ROI, cost-saving, budget spent on training, etc. Here you can discover an assortment of the finest PowerPoint and Google Slides templates. With these templates, you can create presentations for a variety of purposes while simultaneously providing your audience with an eye catching visual experience. Download Dashboard For Tracking Impact Of Procurement Process Automation Inspiration PDF to deliver an impeccable presentation. These templates will make your job of preparing presentations much quicker, yet still, maintain a high level of quality. Slidegeeks has experienced researchers who prepare these templates and write high quality content for you. Later on, you can personalize the content by editing the Dashboard For Tracking Impact Of Procurement Process Automation Inspiration PDF.

Cost Breakdown Structure Ppt Presentation
This is a cost breakdown structure ppt presentation. This is a five stage process. The stages in this process are process design, needs analysis, concept analysis r, execution, feedback.

API Outline Magnifying Glass Ppt Model Diagrams PDF
Presenting api outline magnifying glass ppt model diagrams pdf to provide visual cues and insights. Share and navigate important information on one stage that need your due attention. This template can be used to pitch topics likemagnifying glass. In addition, this PPT design contains high-resolution images, graphics, etc, that are easily editable and available for immediate download.

Software Integration WBS Magnifying Glass Ppt PowerPoint Presentation Infographic Template Backgrounds PDF
Presenting software integration wbs magnifying glass ppt powerpoint presentation infographic template backgrounds pdf to provide visual cues and insights. Share and navigate important information on four stages that need your due attention. This template can be used to pitch topics like magnifying glass. In addtion, this PPT design contains high resolution images, graphics, etc, that are easily editable and available for immediate download.
Magnifying Glass Vector Illustrating Buyer Behavior Icon Ppt Outline Information PDF
Persuade your audience using this magnifying glass vector illustrating buyer behavior icon ppt outline information pdf. This PPT design covers three stages, thus making it a great tool to use. It also caters to a variety of topics including magnifying glass vector illustrating buyer behavior icon. Download this PPT design now to present a convincing pitch that not only emphasizes the topic but also showcases your presentation skills.
Find Files In Folder Vector Icon Ppt Outline Demonstration
Persuade your audience using this find files in folder vector icon ppt outline demonstration. This PPT design covers three stages, thus making it a great tool to use. It also caters to a variety of topics including find files in folder vector icon. Download this PPT design now to present a convincing pitch that not only emphasizes the topic but also showcases your presentation skills.
Candidate Screening For Job Selection Vector Icon Ppt PowerPoint Presentation File Mockup PDF
Presenting candidate screening for job selection vector icon ppt powerpoint presentation file mockup pdf to dispense important information. This template comprises three stages. It also presents valuable insights into the topics including candidate screening for job selection vector icon. This is a completely customizable PowerPoint theme that can be put to use immediately. So, download it and address the topic impactfully.
Product Shipment Process Vector Icon Ppt Styles Slides PDF
Presenting product shipment process vector icon ppt styles slides pdf to dispense important information. This template comprises three stages. It also presents valuable insights into the topics including product shipment process vector icon. This is a completely customizable PowerPoint theme that can be put to use immediately. So, download it and address the topic impactfully.

Market Research Icon For Competitive Assessment Mockup PDF
Persuade your audience using this Market Research Icon For Competitive Assessment Mockup PDF. This PPT design covers three stages, thus making it a great tool to use. It also caters to a variety of topics including Market Research Icon, Competitive Assessment. Download this PPT design now to present a convincing pitch that not only emphasizes the topic but also showcases your presentation skills.

Fundamental Challenges Icon With Magnifying Glass Information PDF
Presenting Fundamental Challenges Icon With Magnifying Glass Information PDF to dispense important information. This template comprises four stages. It also presents valuable insights into the topics including Fundamental Challenges Icon, Magnifying Glass. This is a completely customizable PowerPoint theme that can be put to use immediately. So, download it and address the topic impactfully.

Fraud Avoidance Playbook Magnifying Glass Background PDF
This is a Fraud Avoidance Playbook Magnifying Glass Background PDF template with various stages. Focus and dispense information on three stages using this creative set, that comes with editable features. It contains large content boxes to add your information on topics like Magnifying Glass. You can also showcase facts, figures, and other relevant content using this PPT layout. Grab it now.

Five Year Sales Projection Graph Icon Graphics PDF
Persuade your audience using this Five Year Sales Projection Graph Icon Graphics PDF. This PPT design covers three stages, thus making it a great tool to use. It also caters to a variety of topics including Five Year Sales, Projection Graph Icon. Download this PPT design now to present a convincing pitch that not only emphasizes the topic but also showcases your presentation skills.
Icon For Target Market Assessment Survey Diagrams PDF
Persuade your audience using this Icon For Target Market Assessment Survey Diagrams PDF. This PPT design covers four stages, thus making it a great tool to use. It also caters to a variety of topics including Icon For Target Market, Assessment Survey. Download this PPT design now to present a convincing pitch that not only emphasizes the topic but also showcases your presentation skills.
Leadership Talent Recruitment And Search Icon Inspiration PDF
Persuade your audience using this Leadership Talent Recruitment And Search Icon Inspiration PDF. This PPT design covers Three stages, thus making it a great tool to use. It also caters to a variety of topics including Leadership Talent, Recruitment And Search. Download this PPT design now to present a convincing pitch that not only emphasizes the topic but also showcases your presentation skills.
Expenditure Assessment Icon For Budget Planning Topics PDF
Presenting Expenditure Assessment Icon For Budget Planning Topics PDF to dispense important information. This template comprises Four stages. It also presents valuable insights into the topics including Expenditure Assessment, Icon For Budget Planning. This is a completely customizable PowerPoint theme that can be put to use immediately. So, download it and address the topic impactfully.
SEO Content Review Summary Icon Diagrams PDF
Persuade your audience using this SEO Content Review Summary Icon Diagrams PDF. This PPT design covers Four stages, thus making it a great tool to use. It also caters to a variety of topics including Content Review, Summary Icon. Download this PPT design now to present a convincing pitch that not only emphasizes the topic but also showcases your presentation skills.


 Continue with Email

 Home
Home


