Business Snapshot
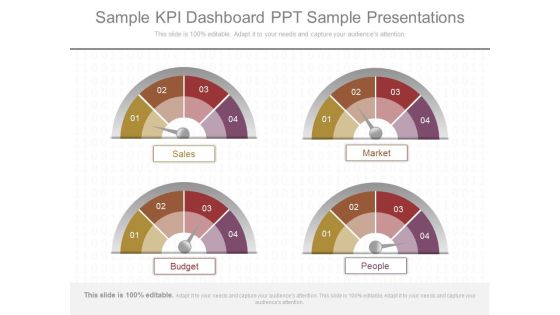
Sample Kpi Dashboard Ppt Sample Presentations
This is a sample kpi dashboard ppt sample presentations. This is a four stage process. The stages in this process are sales, market, budget, people.
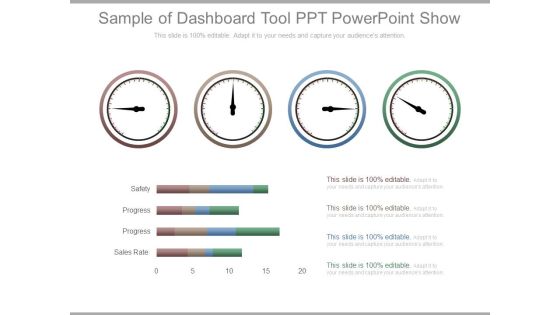
Sample Of Dashboard Tool Ppt Powerpoint Show
This is a sample of dashboard tool ppt powerpoint show. This is a four stage process. The stages in this process are safety, progress, sales rate.
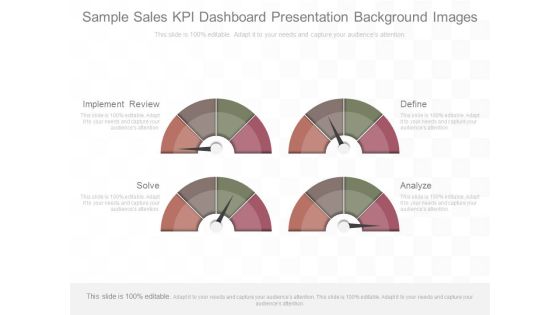
Sample Sales Kpi Dashboard Presentation Background Images
This is a sample sales kpi dashboard presentation background images. This is a four stage process. The stages in this process are implement review, define, solve, analyze.
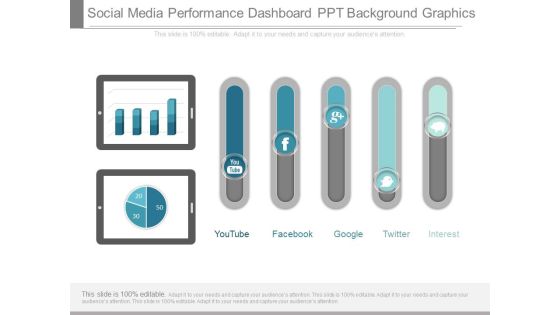
Social Media Performance Dashboard Ppt Background Graphics
This is a social media performance dashboard ppt background graphics. This is a seven stage process. The stages in this process are youtube, facebook, google, twitter, pinterest.

Enterprise Dashboard Ppt Presentation Powerpoint Example
This is a enterprise dashboard ppt presentation powerpoint example. This is a three stage process. The stages in this process are balance scorecard, enterprise performance, industry trends.
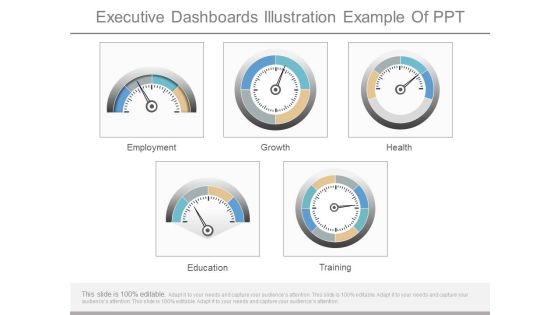
Executive Dashboards Illustration Example Of Ppt
This is a executive dashboards illustration example of ppt. This is a five stage process. The stages in this process are employment, growth, health, education, training.
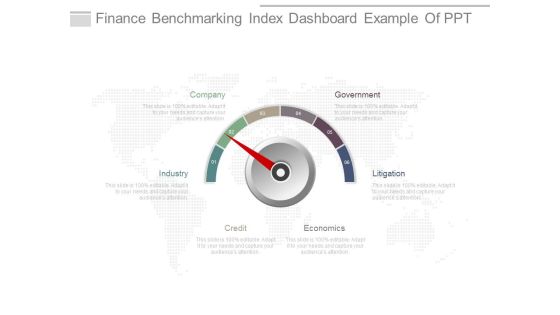
Finance Benchmarking Index Dashboard Example Of Ppt
This is a finance benchmarking index dashboard example of ppt. This is a six stage process. The stages in this process are industry, company, government, litigation, economics, credit.
Info Dashboard Ppt Presentation Powerpoint Example
This is a info dashboard ppt presentation powerpoint example. This is a two stage process. The stages in this process are often single page, real time user interface.

Kpi Dashboard Ppt Presentation Background Images
This is a kpi dashboard ppt presentation background images. This is a three stage process. The stages in this process are revenue, labor cost, customer satisfaction.

Kpi Reporting Dashboard Powerpoint Slide Background Designs
This is a kpi reporting dashboard powerpoint slide background designs. This is a three stage process. The stages in this process are stability, model assessment, characteristic.
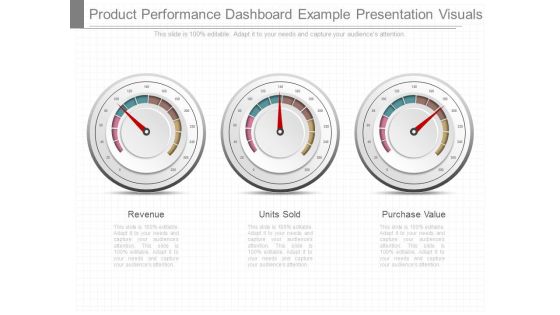
Product Performance Dashboard Example Presentation Visuals
This is a product performance dashboard example presentation visuals. This is a three stage process. The stages in this process are revenue, units sold, purchase value.
Project Tracking Dashboard Template Ppt Sample
This is a project tracking dashboard template ppt sample. This is a five stage process. The stages in this process are requirements, analytics, needs, performance, analysis.

Dashboard Design Tools Ppt Presentation Slides
This is a dashboard design tools ppt presentation slides. This is a three stage process. The stages in this process are performance, speed, energy.

Dashboard Project Plan Presentation Powerpoint Example
This is a dashboard project plan presentation powerpoint example. This is a four stage process. The stages in this process are build, test, design, analysis.
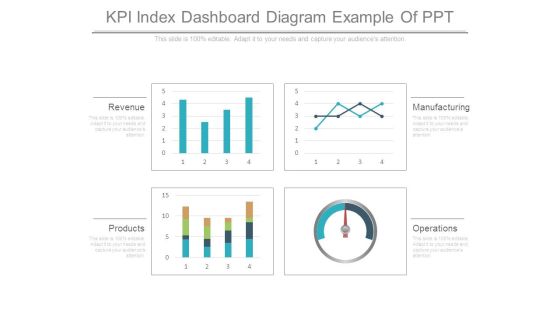
Kpi Index Dashboard Diagram Example Of Ppt
This is a kpi index dashboard diagram example of ppt. This is a four stage process. The stages in this process are revenue, products, operations, manufacturing.
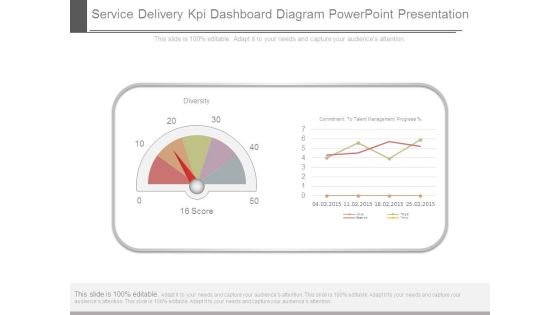
Service Delivery Kpi Dashboard Diagram Powerpoint Presentation
This is a service delivery kpi dashboard diagram powerpoint presentation. This is a two stage process. The stages in this process are diversity, commitment to talent management progress.
Team Work Analysis Dashboard Ppt Icon
This is a team work analysis dashboard ppt icon. This is a four stage process. The stages in this process are reward, completion, overdue plans, problems.
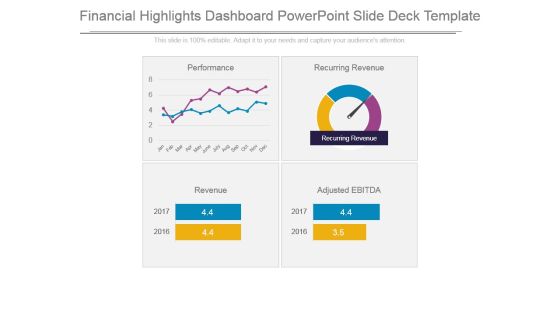
Financial Highlights Dashboard Powerpoint Slide Deck Template
This is a financial highlights dashboard powerpoint slide deck template. This is a four stage process. The stages in this process are recurring revenue, performance, revenue, adjusted ebitda.

Dashboard Ppt PowerPoint Presentation Inspiration Introduction
This is a dashboard ppt powerpoint presentation inspiration introduction. This is a three stage process. The stages in this process are low, medium, high.

Dashboard Ppt PowerPoint Presentation Gallery Graphics Template
This is a dashboard ppt powerpoint presentation gallery graphics template. This is a three stage process. The stages in this process are low, medium, high, measurement.

Gathering Customer Strategies For Website Content Personalization Pictures PDF
The slide showcases personalization strategies for website content that can help organization to increase the conversion rate. Key strategies include headline, call to action, blog posts and social proof personalization. Retrieve professionally designed Gathering Customer Strategies For Website Content Personalization Pictures PDF to effectively convey your message and captivate your listeners. Save time by selecting pre-made slideshows that are appropriate for various topics, from business to educational purposes. These themes come in many different styles, from creative to corporate, and all of them are easily adjustable and can be edited quickly. Access them as PowerPoint templates or as Google Slides themes. You dont have to go on a hunt for the perfect presentation because Slidegeeks got you covered from everywhere.

Dashboard Measurement Ppt PowerPoint Presentation Gallery Layouts
Presenting this set of slides with name dashboard measurement ppt powerpoint presentation gallery layouts. This is a two stage process. The stages in this process are dashboard, marketing, management, investment, analysis. This is a completely editable PowerPoint presentation and is available for immediate download. Download now and impress your audience.

Security In 5G Technology Architecture 5G Network Structure Pictures PDF
This slide depicts the security in 5G architecture, including the standards detailed by 3GPP 3rd Generation Partnership Project, such as SUPI, unified authentication, extensible authentication standards, and flexible security policies.Retrieve professionally designed Security In 5G Technology Architecture 5G Network Structure Pictures PDF to effectively convey your message and captivate your listeners. Save time by selecting pre-made slideshows that are appropriate for various topics, from business to educational purposes. These themes come in many different styles, from creative to corporate, and all of them are easily adjustable and can be edited quickly. Access them as PowerPoint templates or as Google Slides themes. You Do not have to go on a hunt for the perfect presentation because Slidegeeks got you covered from everywhere.

Trends Associated With Information And Communications Technology Pictures PDF
This slide represents trends associated with information and communications technology ICT. It covers artificial intelligence, blockchain, computer vision and customer data platform. Retrieve professionally designed Trends Associated With Information And Communications Technology Pictures PDF to effectively convey your message and captivate your listeners. Save time by selecting pre made slideshows that are appropriate for various topics, from business to educational purposes. These themes come in many different styles, from creative to corporate, and all of them are easily adjustable and can be edited quickly. Access them as PowerPoint templates or as Google Slides themes. You do not have to go on a hunt for the perfect presentation because Slidegeeks got you covered from everywhere.

Various Types Of Mobile Banking Users Ppt Pictures Vector PDF
This slide shows details about different types of mobile banking users who uses mobile banking for different purposes. It includes basic, advanced, heavy, tech-savvy, security focused and convenience oriented users. Retrieve professionally designed Various Types Of Mobile Banking Users Ppt Pictures Vector PDF to effectively convey your message and captivate your listeners. Save time by selecting pre made slideshows that are appropriate for various topics, from business to educational purposes. These themes come in many different styles, from creative to corporate, and all of them are easily adjustable and can be edited quickly. Access them as PowerPoint templates or as Google Slides themes. You do not have to go on a hunt for the perfect presentation because Slidegeeks got you covered from everywhere.

Cyber Security Incident Management Team Structure Pictures PDF
This slide represents the org chart of team which is responsible for minimizing and managing cyber security incidents. It includes details related to team structure of cyber security incident management team Retrieve professionally designed Cyber Security Incident Management Team Structure Pictures PDF to effectively convey your message and captivate your listeners. Save time by selecting pre made slideshows that are appropriate for various topics, from business to educational purposes. These themes come in many different styles, from creative to corporate, and all of them are easily adjustable and can be edited quickly. Access them as PowerPoint templates or as Google Slides themes. You do not have to go on a hunt for the perfect presentation because Slidegeeks got you covered from everywhere.

Key Benefits Of Utilizing Event Marketing Ppt Pictures Guide PDF
This slide provides an overview of the major benefits of event marketing. The advantages covered are increase brand awareness, reach target audience, build relationship with customers and boost sales. Retrieve professionally designed Key Benefits Of Utilizing Event Marketing Ppt Pictures Guide PDF to effectively convey your message and captivate your listeners. Save time by selecting pre made slideshows that are appropriate for various topics, from business to educational purposes. These themes come in many different styles, from creative to corporate, and all of them are easily adjustable and can be edited quickly. Access them as PowerPoint templates or as Google Slides themes. You do not have to go on a hunt for the perfect presentation because Slidegeeks got you covered from everywhere.

Implementing Marketing Strategies Overview Social Media Marketing Pictures PDF
Purpose of the following slide is to display social media marketing as organization strategy. It provides and overview of the strategy along with key elements such as profile optimization, posting, advertisement etc. Welcome to our selection of the Implementing Marketing Strategies Overview Social Media Marketing Pictures PDF. These are designed to help you showcase your creativity and bring your sphere to life. Planning and Innovation are essential for any business that is just starting out. This collection contains the designs that you need for your everyday presentations. All of our PowerPoints are 100 percent editable, so you can customize them to suit your needs. This multi-purpose template can be used in various situations. Grab these presentation templates today.

Clear Point Strategy Dashboard Ppt Presentation
This is a clear point strategy dashboard ppt presentation. This is a four stage process. The stages in this process are financial perspective, internal processes perspective, learning and growth perspective, customer perspective.

Software Dashboard Manager Test Diagram Presentation Examples
This is a software dashboard manager test diagram presentation examples. This is a four stage process. The stages in this process are issues by risk level, reported issues, location on map, top contributing factors.
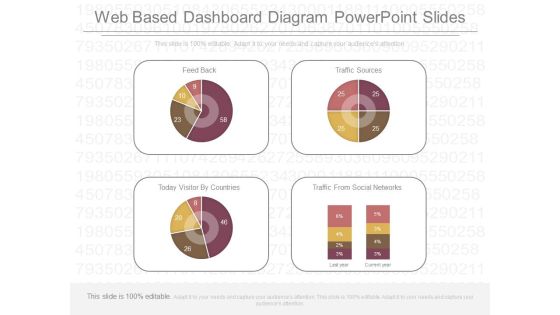
Web Based Dashboard Diagram Powerpoint Slides
This is a web based dashboard diagram powerpoint slides. This is a four stage process. The stages in this process are feed back, traffic sources, today visitor by countries, traffic from social networks.
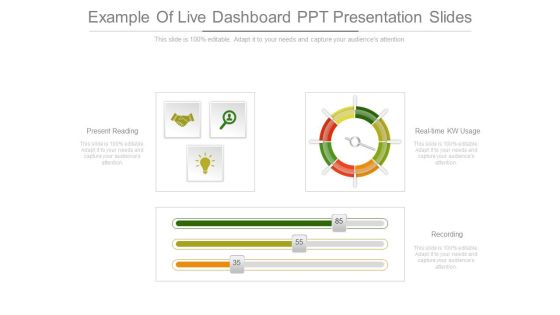
Example Of Live Dashboard Ppt Presentation Slides
This is a example of live dashboard ppt presentation slides. This is a three stage process. The stages in this process are present reading, real time kw usage, recording.
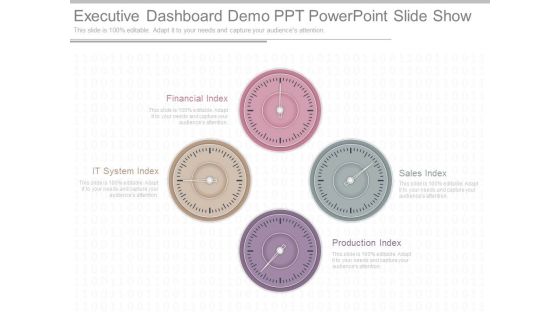
Executive Dashboard Demo Ppt Powerpoint Slide Show
This is a executive dashboard demo ppt powerpoint slide show. This is a four stage process. The stages in this process are financial index, it system index, production index, sales index.
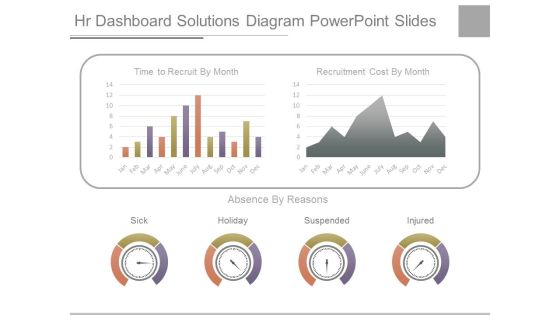
Hr Dashboard Solutions Diagram Powerpoint Slides
This is a hr dashboard solutions diagram powerpoint slides. This is a two stage process. The stages in this process are time to recruit by month, recruitment cost by month, sick, holiday, suspended, injured.

Project Management Kpi Dashboard Diagram Powerpoint Images
This is a project management kpi dashboard diagram powerpoint images. This is a four stage process. The stages in this process are project budget, project goals, project task management, project schedule.

Project Management Status Dashboard Diagram Powerpoint Ideas
This is a project management status dashboard diagram powerpoint ideas. This is a six stage process. The stages in this process are tabular reports, project s status, task status, visual reports, completed tasks, task in progress.
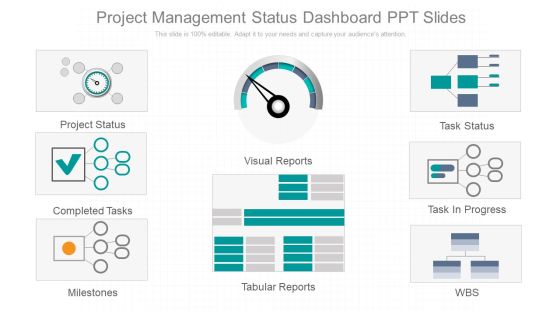
Project Management Status Dashboard Ppt Slides
This is a project management status dashboard ppt slides. This is a eight stage process. The stages in this process are project status, completed tasks, milestones, visual reports, tabular reports, task status, task in progress, wbs.

Competitive Intelligence Dashboard Diagram Ppt Slides
This is a competitive intelligence dashboard diagram ppt slides. This is a four stage process. The stages in this process are monthly sales, inventory turns, customer complaints, company, subject area.
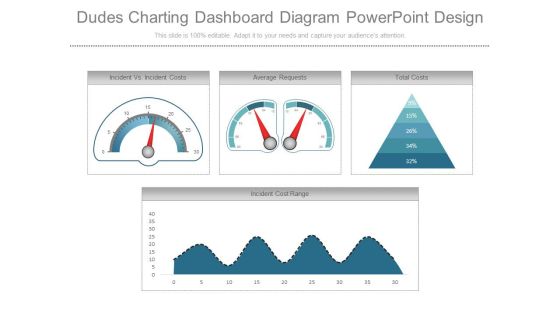
Dudes Charting Dashboard Diagram Powerpoint Design
This is a dudes charting dashboard diagram powerpoint design. This is a four stage process. The stages in this process are incident vs incident costs, average requests, total costs, incident cost range.
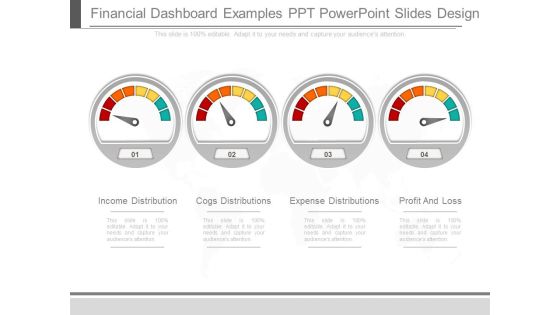
Financial Dashboard Examples Ppt Powerpoint Slides Design
This is a financial dashboard examples ppt powerpoint slides design. This is a four stage process. The stages in this process are income distribution, cogs distributions, expense distributions, profit and loss.

Manufacturing Dashboard Examples Ppt Slide Show
This is a manufacturing dashboard examples ppt slide show. This is a five stage process. The stages in this process are units per hour, effective rate, units until, time unit, status information.
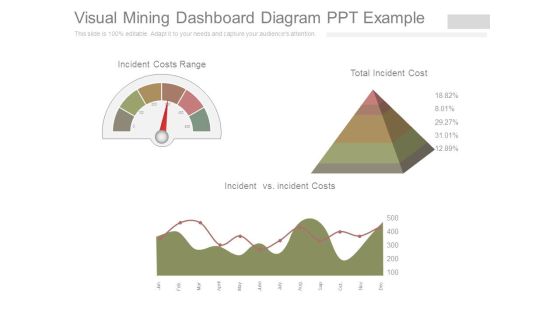
Visual Mining Dashboard Diagram Ppt Example
This is a visual mining dashboard diagram ppt example. This is a three stage process. The stages in this process are incident costs range, incident vs incident costs, total incident cost.

Executive Dashboards Systems Example Of Ppt Presentation
This is a executive dashboards systems example of ppt presentation. This is a five stage process. The stages in this process are schedule management, resource management, document management, inventory management, meeting management.
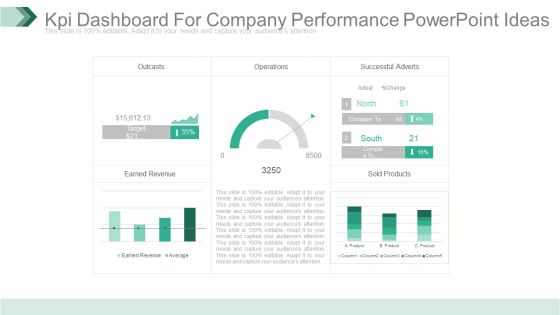
Kpi Dashboard For Company Performance Powerpoint Ideas
This is a kpi dashboard for company performance powerpoint ideas. This is a five stage process. The stages in this process are outcasts, operations, successful adverts, earned revenue, sold products.

Dashboards For Lead Scoring Powerpoint Topics
This is a dashboards for lead scoring powerpoint topics. This is a four stage process. The stages in this process are number of scoring rules, projects completed, adoption of lead scoring solutions chosen, number of dimensions.

Kpi Dashboard For Operations Powerpoint Slide Images
This is a kpi dashboard for operations powerpoint slide images. This is a four stage process. The stages in this process are outcasts, earned revenue, operations, successful adverts, sold products.
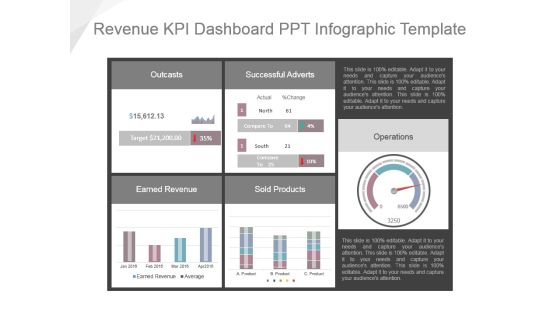
Revenue Kpi Dashboard Ppt Infographic Template
This is a revenue kpi dashboard ppt infographic template. This is a five stage process. The stages in this process are outcasts, successful adverts, earned revenue, sold products, operations.

Financial Highlights Growth Analysis Dashboard Powerpoint Slide
This is a financial highlights growth analysis dashboard powerpoint slide. This is a four stage process. The stages in this process are profit and loss, sales, operating expenses, operating income, net income, profitability.

Finance Dashboard Ppt PowerPoint Presentation Design Ideas
This is a finance dashboard ppt powerpoint presentation design ideas. This is a two stage process. The stages in this process are sales, operating expenses, operating income, net income.

Project Dashboard Ppt PowerPoint Presentation Professional Show
This is a project dashboard ppt powerpoint presentation professional show. This is a six stage process. The stages in this process are primary resources, timeline, objective, main focus, key discussion items.
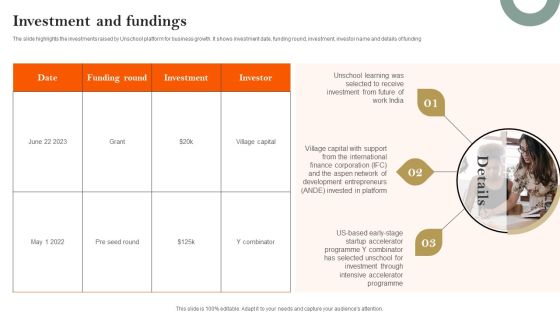
E Learning Platform Company Profile Investment And Fundings Pictures PDF
The slide highlights the investments raised by Unschool platform for business growth. It shows investment date, funding round, investment, investor name and details of funding. Do you have to make sure that everyone on your team knows about any specific topic I yes, then you should give E Learning Platform Company Profile Investment And Fundings Pictures PDF a try. Our experts have put a lot of knowledge and effort into creating this impeccable E Learning Platform Company Profile Investment And Fundings Pictures PDF. You can use this template for your upcoming presentations, as the slides are perfect to represent even the tiniest detail. You can download these templates from the Slidegeeks website and these are easy to edit. So grab these today.

Data Lineage Implementation Case Study Commercial Bank Pictures PDF
This slide outlines the data lineage case study carried out in a commercial bank that provides banking services in sixty states and wanted an information flow visualization for operational intelligence, development of uniformity with business vocabulary, and so on. Do you have to make sure that everyone on your team knows about any specific topic I yes, then you should give Data Lineage Implementation Case Study Commercial Bank Pictures PDF a try. Our experts have put a lot of knowledge and effort into creating this impeccable Data Lineage Implementation Case Study Commercial Bank Pictures PDF. You can use this template for your upcoming presentations, as the slides are perfect to represent even the tiniest detail. You can download these templates from the Slidegeeks website and these are easy to edit. So grab these today.
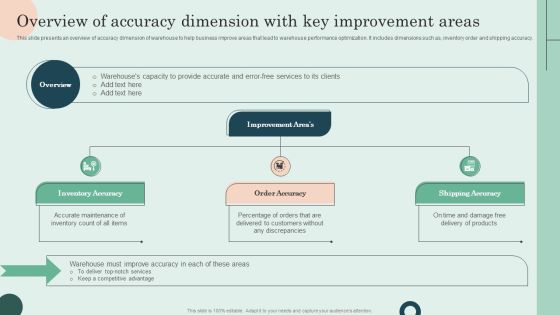
Overview Of Accuracy Dimension With Key Improvement Areas Pictures PDF
This slide presents an overview of accuracy dimension of warehouse to help business improve areas that lead to warehouse performance optimization. It includes dimensions such as, inventory order and shipping accuracy. Get a simple yet stunning designed Overview Of Accuracy Dimension With Key Improvement Areas Pictures PDF. It is the best one to establish the tone in your meetings. It is an excellent way to make your presentations highly effective. So, download this PPT today from Slidegeeks and see the positive impacts. Our easy-to-edit Overview Of Accuracy Dimension With Key Improvement Areas Pictures PDF can be your go-to option for all upcoming conferences and meetings. So, what are you waiting for Grab this template today.
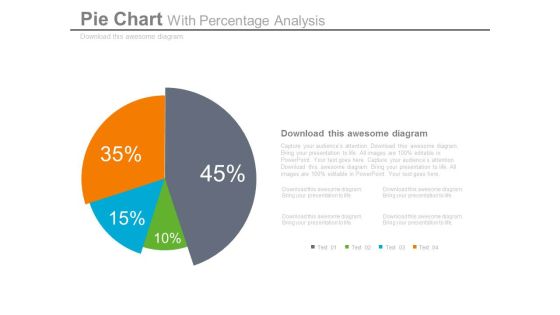
Pie Chart Dashboard Style For Percentage Analysis Powerpoint Slides
This dashboard PPT template contains graphics of pie chart. This dashboard PowerPoint template helps to display percentage analysis in a visual manner. Download this PPT slide for quick decision-making.

Implementing Client Onboarding Process Understanding Product Awareness For Higher Consumer Adoption Rate Pictures PDF
This slide provides glimpse about product awareness and how it can help our business organization to retain strong fit customers. It includes ways to increase product awareness, advantages of product awareness, product awareness strategies, etc. Explore a selection of the finest Implementing Client Onboarding Process Understanding Product Awareness For Higher Consumer Adoption Rate Pictures PDF here. With a plethora of professionally designed and pre-made slide templates, you can quickly and easily find the right one for your upcoming presentation. You can use our Implementing Client Onboarding Process Understanding Product Awareness For Higher Consumer Adoption Rate Pictures PDF to effectively convey your message to a wider audience. Slidegeeks has done a lot of research before preparing these presentation templates. The content can be personalized and the slides are highly editable. Grab templates today from Slidegeeks.
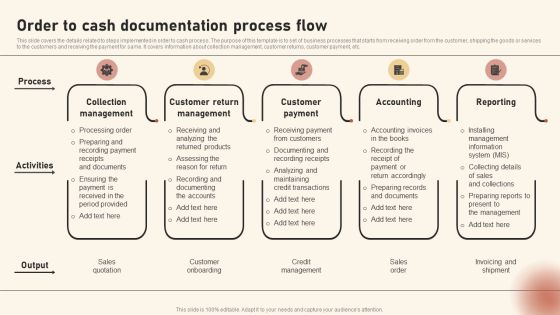
Order To Cash Documentation Process Flow Pictures PDF
This slide covers the details related to steps implemented in order to cash process. The purpose of this template is to set of business processes that starts from receiving order from the customer, shipping the goods or services to the customers and receiving the payment for same. It covers information about collection management, customer returns, customer payment, etc. Presenting Order To Cash Documentation Process Flow Pictures PDF to dispense important information. This template comprises five stages. It also presents valuable insights into the topics including Collection Management, Customer Return Management, Customer Payment. This is a completely customizable PowerPoint theme that can be put to use immediately. So, download it and address the topic impactfully.
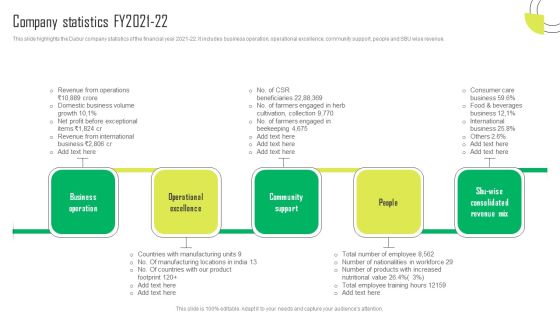
Herbal Products Company Profile Company Statistics FY2021 22 Pictures PDF
This slide highlights the Dabur company statistics of the financial year 2021-22. It includes business operation, operational excellence, community support, people and SBU wise revenue. Are you in need of a template that can accommodate all of your creative concepts This one is crafted professionally and can be altered to fit any style. Use it with Google Slides or PowerPoint. Include striking photographs, symbols, depictions, and other visuals. Fill, move around, or remove text boxes as desired. Test out color palettes and font mixtures. Edit and save your work, or work with colleagues. Download Herbal Products Company Profile Company Statistics FY2021 22 Pictures PDF and observe how to make your presentation outstanding. Give an impeccable presentation to your group and make your presentation unforgettable.

Magnify Glass Ppt PowerPoint Presentation Styles
This is a magnify glass ppt powerpoint presentation styles. This is a five stage process. The stages in this process are big data, analysis, success, business, strategy.
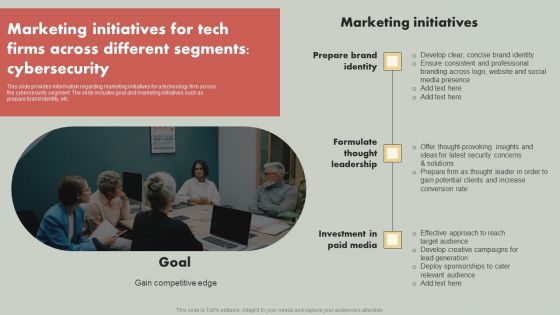
IT Reducing Costs And Management Tips Marketing Initiatives For Tech Firms Across Segments Cybersecurity Pictures PDF
This slide provides information regarding marketing initiatives for a technology firm across the cybersecurity segment. The slide includes goal and marketing initiatives such as prepare brand identity, etc. Welcome to our selection of the IT Reducing Costs And Management Tips Marketing Initiatives For Tech Firms Across Segments Cybersecurity Pictures PDF. These are designed to help you showcase your creativity and bring your sphere to life. Planning and Innovation are essential for any business that is just starting out. This collection contains the designs that you need for your everyday presentations. All of our PowerPoints are 100 percent editable, so you can customize them to suit your needs. This multi purpose template can be used in various situations. Grab these presentation templates today.

Phases Of Data Analytics Operationalize Ppt Pictures Files PDF
This slide describes the operational phase of data science and what tasks are performed in this phase, such as deliver final reports, pilot project implementation, and how it will be helpful in monitoring performance. Presenting phases of data analytics operationalize ppt pictures files pdf to provide visual cues and insights. Share and navigate important information on three stages that need your due attention. This template can be used to pitch topics like phases of data analytics operationalize. In addtion, this PPT design contains high resolution images, graphics, etc, that are easily editable and available for immediate download.


 Continue with Email

 Home
Home


