Business Snapshot

Challenges In The Channel Ppt PowerPoint Presentation Professional Shapes
This is a challenges in the channel ppt powerpoint presentation professional shapes. This is a five stage process. The stages in this process are manufacturer, direct, channels, distributor, end customers.
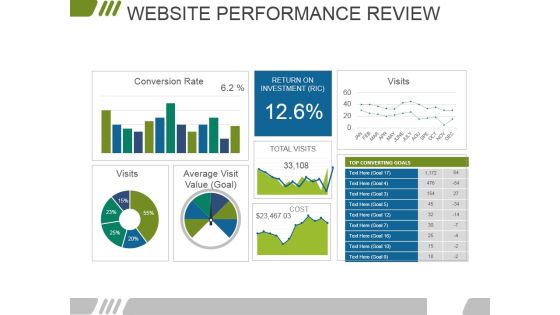
Website Performance Review Template 2 Ppt PowerPoint Presentation Infographics Background Designs
This is a website performance review template 2 ppt powerpoint presentation infographics background designs. This is a three stage process. The stages in this process are conversion rate, visits, return on investment, average visit value.

Market Leader In A Segment Ppt PowerPoint Presentation Layouts Demonstration
This is a market leader in a segment ppt powerpoint presentation layouts demonstration. This is a two stage process. The stages in this process are parameters, company xx capabilities, high quality standards, past experience, list of all approvals required by customers.

Key Trends In The Industry Ppt PowerPoint Presentation Professional Backgrounds
This is a key trends in the industry ppt powerpoint presentation professional backgrounds. This is a six stage process. The stages in this process are focus, meet channels needs, differentiated capabilities, best cost, end customer centric.

Key Financial Ratios Ppt PowerPoint Presentation Outline Slide
This is a key financial ratios ppt powerpoint presentation outline slide. This is a eight stage process. The stages in this process are return on assets, return on equity, return on investment, current ratio, debt equity ratio.
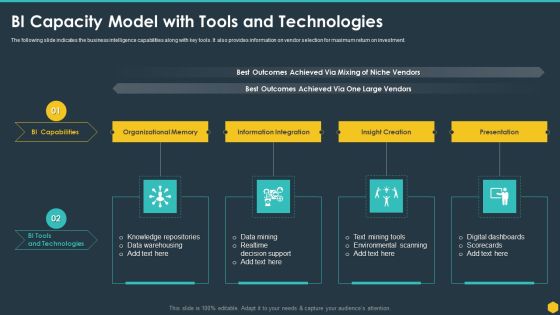
BI Capacity Model With Tools And Technologies BI Transformation Toolset Guidelines PDF
The following slide indicates the business intelligence capabilities along with key tools. It also provides information on vendor selection for maximum return on investment. This is a BI Capacity Model With Tools And Technologies BI Transformation Toolset Guidelines PDF template with various stages. Focus and dispense information on four stages using this creative set, that comes with editable features. It contains large content boxes to add your information on topics like Data Warehousing, Data Mining, Environmental Scanning, Digital Dashboards. You can also showcase facts, figures, and other relevant content using this PPT layout. Grab it now.

Data Mining Dashboard Diagram Example Ppt Presentation
This is a data mining dashboard diagram example ppt presentation. This is a six stage process. The stages in this process are select a region, nuclear power plants in the state of illinois.

Stock Photo 3d Man Standing On Target Arrow PowerPoint Slide
This image slide displays 3d man standing on target arrow. This image slide has been crafted with graphic of target, arrow and gear in center. This image slide depicts process. You can change size, color and orientation of icons to your liking. Use this image slide, in your presentations to express views on process needed for reaching the goal or target. This image slide may also be used in presentations to exhibit different business strategies. This image slide will impart professional appearance to your presentations.

Stock Photo Leader Red Arrow Jumping The Wall PowerPoint Slide
This image slide displays wall and arrows . This image slide has been crafted with graphic of arrows and individual red arrow jumping over the wall. This image depicts leadership. You may change size, color and orientation of any icon to your liking. Use this PowerPoint template, in your presentations to express views on teamwork, leadership, growth, achievements and success. This image slide may also be used in presentations to represent different business strategies. This image slide will enhance the quality of your presentations.

Impact Of Modern Data Analytics Infrastructure On Organisation Elements PDF
This slide includes the impact of an AI-driven modern data ecosystem that allows organizations to generate business value. It includes higher returns, customer engagement, process improvement, and reduction in cost. Presenting Impact Of Modern Data Analytics Infrastructure On Organisation Elements PDF to dispense important information. This template comprises four stages. It also presents valuable insights into the topics including Higher Returns, Process Improvement, Customer Engagement, Reduction In Cost. This is a completely customizable PowerPoint theme that can be put to use immediately. So, download it and address the topic impactfully.

Have Team Photos Ppt PowerPoint Presentation Model Inspiration
This is a have team photos ppt powerpoint presentation model inspiration. This is a three stage process. The stages in this process are team photos, team work , communication, team management.

Toolkit For Data Science And Analytics Transition Work Streams For Data Analytics With Its Roles Brochure PDF
This slide shows the work streams structure with team head for implementing the data analytics project. Welcome to our selection of the Toolkit For Data Science And Analytics Transition Work Streams For Data Analytics With Its Roles Brochure PDF. These are designed to help you showcase your creativity and bring your sphere to life. Planning and Innovation are essential for any business that is just starting out. This collection contains the designs that you need for your everyday presentations. All of our PowerPoints are 100 percent editable, so you can customize them to suit your needs. This multi purpose template can be used in various situations. Grab these presentation templates today.

Augmented Analytics Implementation IT Workflow Of Augmented Analytics Demonstration PDF
This slide depicts the workflow of augmented analytics, including data preparation and management, automated business intelligence, and augmented DSML. This is a Augmented Analytics Implementation IT Workflow Of Augmented Analytics Demonstration PDF template with various stages. Focus and dispense information on four stages using this creative set, that comes with editable features. It contains large content boxes to add your information on topics like Data Preparation And Management, Automated BI, Augmented Data Science And Machine Learning. You can also showcase facts, figures, and other relevant content using this PPT layout. Grab it now.
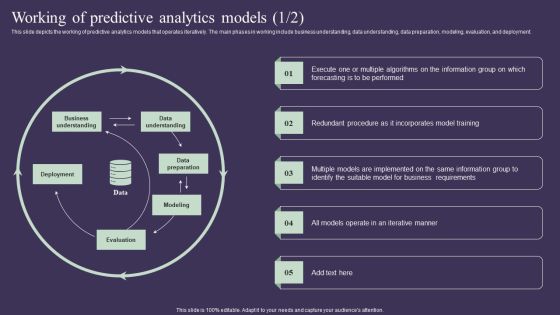
Projection Model Working Of Predictive Analytics Models Background PDF
This slide depicts the working of predictive analytics models that operates iteratively. The main phases in working include business understanding, data understanding, data preparation, modeling, evaluation, and deployment. Slidegeeks is one of the best resources for PowerPoint templates. You can download easily and regulate Projection Model Working Of Predictive Analytics Models Background PDF for your personal presentations from our wonderful collection. A few clicks is all it takes to discover and get the most relevant and appropriate templates. Use our Templates to add a unique zing and appeal to your presentation and meetings. All the slides are easy to edit and you can use them even for advertisement purposes.
Metrics For Measuring Strategic Customer Service Performance Analysis Icons PDF
This slide illustrate various type of customer service key performance indictors that is used to monitor business activities. It includes metrices such as average resolution time, customer service abandonment rate, customer retention rate, net promoter score and first contact resolution rate. Presenting Metrics For Measuring Strategic Customer Service Performance Analysis Icons PDF to dispense important information. This template comprises five stages. It also presents valuable insights into the topics including Average Resolution Time, Customer Retention Rate, Customer Service Abandonment Rate. This is a completely customizable PowerPoint theme that can be put to use immediately. So, download it and address the topic impactfully.

Cash Flow Statement Kpis Template 1 Ppt PowerPoint Presentation Outline Deck
This is a cash flow statement kpis template 1 ppt powerpoint presentation outline deck. This is a four stage process. The stages in this process are operations, financing activities, investing activities, net increase in cash.

P And L Kpis Template 1 Ppt PowerPoint Presentation Design Ideas
This is a p and l kpis template 1 ppt powerpoint presentation design ideas. This is a four stage process. The stages in this process are revenue, cogs, operating profit, net profit.
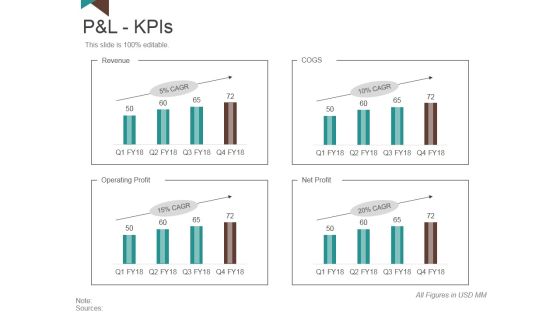
P And L Kpis Template 1 Ppt PowerPoint Presentation Slides Model
This is a p and l kpis template 1 ppt powerpoint presentation slides model. This is a four stage process. The stages in this process are revenue, operating profit, net profit, cogs.

Cash Flow Statement Kpis Template 2 Ppt PowerPoint Presentation Layouts Skills
This is a cash flow statement kpis template 2 ppt powerpoint presentation layouts skills. This is a four stage process. The stages in this process are operations, financing activities, net increase in cash, investing activities.
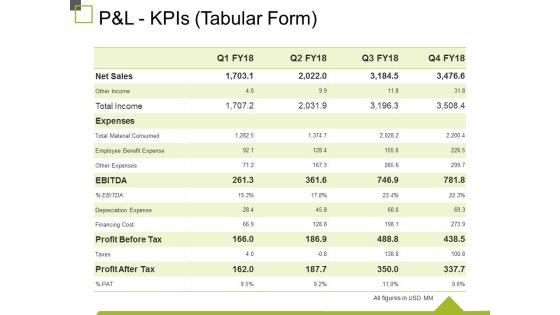
P And L Kpis Tabular Form Ppt PowerPoint Presentation Ideas Infographics
This is a p and l kpis tabular form ppt powerpoint presentation ideas infographics. This is a four stage process. The stages in this process are other income, expenses, other expenses, depreciation expense, financing cost.
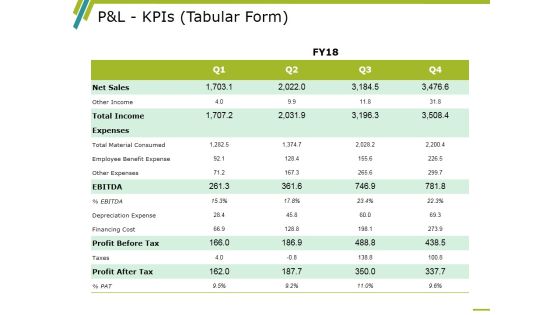
P And L Kpis Template 1 Ppt PowerPoint Presentation Infographics Professional
This is a p and l kpis template 1 ppt powerpoint presentation infographics professional. This is a four stage process. The stages in this process are Other Income, Total Income, Ebitda, Profit Before Tax, Profit After Tax.

Balance Sheet Kpis Tabular Form Template 2 Ppt PowerPoint Presentation Summary Structure
This is a balance sheet kpis tabular form template 2 ppt powerpoint presentation summary structure. This is a four stage process. The stages in this process are net sales, expenses, ebitda, profit after tax, finecing cost.

Balance Sheet Kpis Tabular Form Cont Ppt PowerPoint Presentation Model Graphics Tutorials
This is a balance sheet kpis tabular form cont ppt powerpoint presentation model graphics tutorials. This is a four stage process. The stages in this process are long term loans and advances, current investments, inventories, trade receivables.
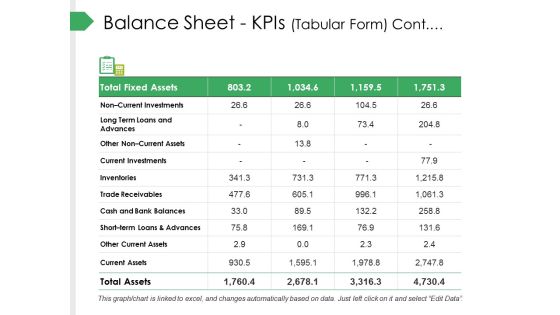
Balance Sheet Kpis Tabular Form Cont Ppt PowerPoint Presentation Summary Templates
This is a balance sheet kpis tabular form cont ppt powerpoint presentation summary templates. This is a four stage process. The stages in this process are current investments, inventories, trade receivables, cash and bank balances.
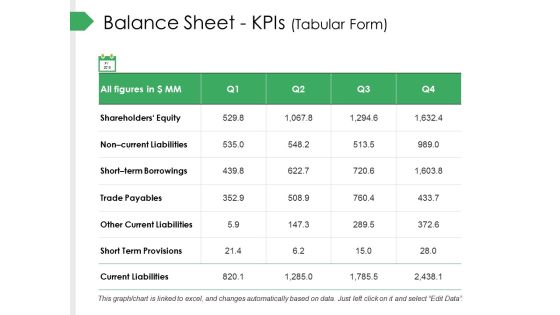
Balance Sheet Kpis Tabular Form Ppt PowerPoint Presentation Slides Designs Download
This is a balance sheet kpis tabular form ppt powerpoint presentation slides designs download. This is a four stage process. The stages in this process are trade payables, other current liabilities, short term provisions, current liabilities, short term borrowings.
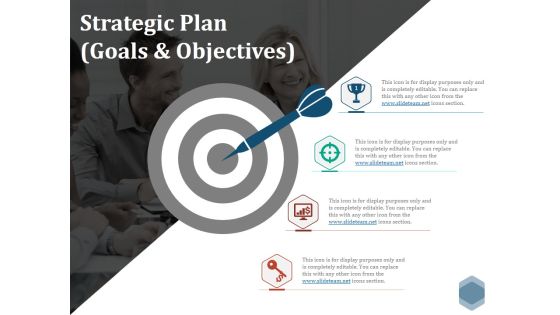
Strategic Plan Goals And Objectives Ppt PowerPoint Presentation File Graphics Pictures
This is a strategic plan goals and objectives ppt powerpoint presentation file graphics pictures. This is a four stage process. The stages in this process are business, marketing, strategy, planning, goal.
Our Product And Services Template Ppt PowerPoint Presentation Pictures Graphics Template
This is a our product and services template ppt powerpoint presentation pictures graphics template. This is a four stage process. The stages in this process are icons, business, marketing, strategy, planning.

Sales Target For Current Financial Year Ppt PowerPoint Presentation Pictures Graphics Download
This is a sales target for current financial year ppt powerpoint presentation pictures graphics download. This is a three stage process. The stages in this process are business, marketing, strategy, finance, planning.

Internal Sources Of New Product Ideas Ppt PowerPoint Presentation Pictures Professional
This is a internal sources of new product ideas ppt powerpoint presentation pictures professional. This is a four stage process. The stages in this process are business, management, planning, strategy, marketing.
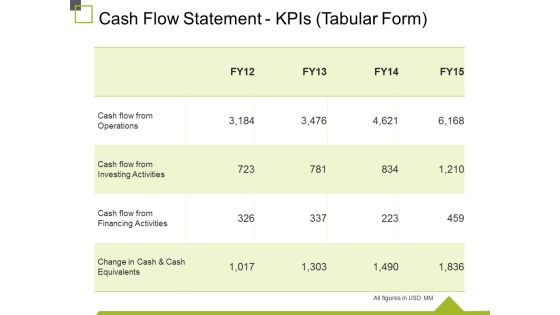
Cash Flow Statement Kpis Tabular Form Ppt PowerPoint Presentation Gallery Infographic Template
This is a cash flow statement kpis tabular form ppt powerpoint presentation gallery infographic template. This is a four stage process. The stages in this process are cash flow from operations, cash flow from investing activities, cash flow from financing activities, change in cash and cash equivalents change in cash and cash equivalents.

Key Tips To Improve E Commerce Website Management Ppt Icon Show PDF
This slide illustrates key tips which can be used by online business to increase website traffic and conversion rate. It includes tips such as website backup, loading time, perform keyword analysis and key performance indicators review. Persuade your audience using this Key Tips To Improve E Commerce Website Management Ppt Icon Show PDF. This PPT design covers four stages, thus making it a great tool to use. It also caters to a variety of topics including Website Backup, Loading Time, Perform Keyword Analysis, KPI Review . Download this PPT design now to present a convincing pitch that not only emphasizes the topic but also showcases your presentation skills.

Challenges Faced By Employee Information Analytics With Solutions To Overcome Download PDF
This slide showcases workforce data analytical pain points with strategies to overcome challenges and its positive impact on business operations. It provides information such as poor data quality, insufficient investment, outdated technology and data silos. Persuade your audience using this Challenges Faced By Employee Information Analytics With Solutions To Overcome Download PDF. This PPT design covers four stages, thus making it a great tool to use. It also caters to a variety of topics including Data Quality, Insufficient Investment, Outdated Technology. Download this PPT design now to present a convincing pitch that not only emphasizes the topic but also showcases your presentation skills.
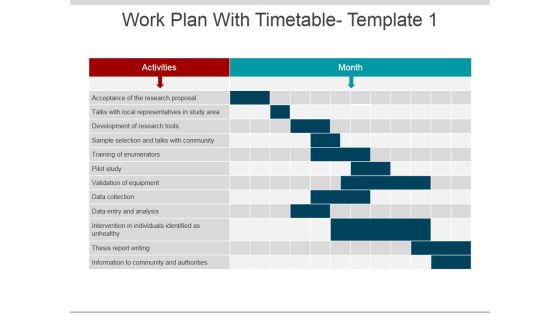
Work Plan With Timetable Template 1 Ppt PowerPoint Presentation Layouts Example File
This is a work plan with timetable template 1 ppt powerpoint presentation layouts example file. This is a two stage process. The stages in this process are activities, month, thesis report writing, data collection, pilot study.

L2RM System Analysis KPI Dashboard Ppt PowerPoint Presentation File Microsoft PDF
This slide represents the dashboard showing the key performance indicators of the lead to revenue management. It includes key metrics such as cost per lead, cost per customers, customer lifetime value and returns on marketing investment. Presenting L2RM System Analysis KPI Dashboard Ppt PowerPoint Presentation File Microsoft PDF to dispense important information. This template comprises one stages. It also presents valuable insights into the topics including Audience, Prospects, Lead Conversion Funnel. This is a completely customizable PowerPoint theme that can be put to use immediately. So, download it and address the topic impactfully.

Effectiveness Of Social Media Data Insights For Marketers Ideas PDF
The following slide depicts the effectiveness of social media insights for marketers. This data analysis helps them to formulate strategies, understand the target audience, evaluate campaign performance, assess ROI etc. Showcasing this set of slides titled Effectiveness Of Social Media Data Insights For Marketers Ideas PDF. The topics addressed in these templates are Effectiveness, Social Media, Marketers. All the content presented in this PPT design is completely editable. Download it and make adjustments in color, background, font etc. as per your unique business setting.
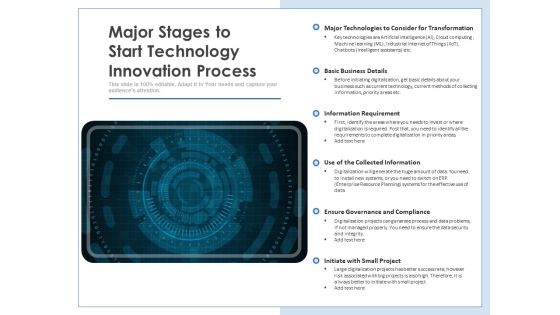
Major Stages To Start Technology Innovation Process Ppt PowerPoint Presentation Show Pictures PDF
Persuade your audience using this major stages to start technology innovation process ppt powerpoint presentation show pictures pdf. This PPT design covers one stages, thus making it a great tool to use. It also caters to a variety of topics including major technologies to consider for transformation, basic business details, information requirement, use of the collected information, ensure governance and compliance, initiate with small project. Download this PPT design now to present a convincing pitch that not only emphasizes the topic but also showcases your presentation skills.

Proposed Services Ppt PowerPoint Presentation Model Samples
This is a proposed services ppt powerpoint presentation model samples. This is a five stage process. The stages in this process are secondary research, financial analysis, big data analytics, market research, mergers and acquisition.

Kpis For Measuring And Building Effective Corporate Organizational Culture Structure PDF
The following slide presents various metrics to measure and create effective organizational culture for providing positive employee experience. It includes key kpis such as employee surveys, third party culture analysis tools, focus groups, exit survey, business needs scorecard, etc. Presenting Kpis For Measuring And Building Effective Corporate Organizational Culture Structure PDF to dispense important information. This template comprises six stages. It also presents valuable insights into the topics including Employee Surveys, Exit Survey, Focus Groups. This is a completely customizable PowerPoint theme that can be put to use immediately. So, download it and address the topic impactfully.

Data Evaluation And Processing Toolkit Key Considerations For Data Analytics Implementation Infographics PDF
This slide depicts a holistic data analytics implementation strategy that includes a roadmap with a mix of business and technology imperatives. Slidegeeks has constructed Data Evaluation And Processing Toolkit Key Considerations For Data Analytics Implementation Infographics PDF after conducting extensive research and examination. These presentation templates are constantly being generated and modified based on user preferences and critiques from editors. Here, you will find the most attractive templates for a range of purposes while taking into account ratings and remarks from users regarding the content. This is an excellent jumping-off point to explore our content and will give new users an insight into our top-notch PowerPoint Templates.

Content Ppt PowerPoint Presentation Pictures Background
This is a content ppt powerpoint presentation pictures background. This is a six stage process. The stages in this process are introduction, principles and certification, tools of quality management, data analysis, cost of quality, quality control.

Data Analytics Management Checklist For Effective Big Data Strategy Themes PDF
This slide explains the checklist for big data, and it includes guidelines such as alignment of big data with specific business goals, ease of skills shortage with standard and governance, and so on.This is a Data Analytics Management Checklist For Effective Big Data Strategy Themes PDF template with various stages. Focus and dispense information on seven stages using this creative set, that comes with editable features. It contains large content boxes to add your information on topics like Standards Governance, Aligning Unstructured, Discovery Performance. You can also showcase facts, figures, and other relevant content using this PPT layout. Grab it now.

Purpose Of Audit System Ppt PowerPoint Presentation Graphics
This is a purpose of audit system ppt powerpoint presentation graphics. This is a four stage process. The stages in this process are perform a random data sample for each audit procedure, collect data, assist in the creation of the final report, track activity.

Purpose Of Audit System Ppt PowerPoint Presentation Ideas Outfit
This is a purpose of audit system ppt powerpoint presentation ideas outfit. This is a four stage process. The stages in this process are collect data, perform a random data sample for each audit procedure, track activity, assist in the creation of the final report.

Energy Efficiency Dashboard To Track Campaign Effectiveness Pictures PDF
This slide consists of a dashboard which presents an energy saving dashboard which can be used to track effectiveness of energy saving program. The key performance indicators relate to energy sources, energy consumption by sectors, energy consumption by sectors etc. Pitch your topic with ease and precision using this Energy Efficiency Dashboard To Track Campaign Effectiveness Pictures PDF. This layout presents information on Energy Sources, Energy Usage, Trend Analysis. It is also available for immediate download and adjustment. So, changes can be made in the color, design, graphics or any other component to create a unique layout.

Design Section Work Ppt PowerPoint Presentation Show Background Image
This is a design section work ppt powerpoint presentation show background image. This is a six stage process. The stages in this process are concept, time and schedule, brainstorm, sketching, improve design, final output.
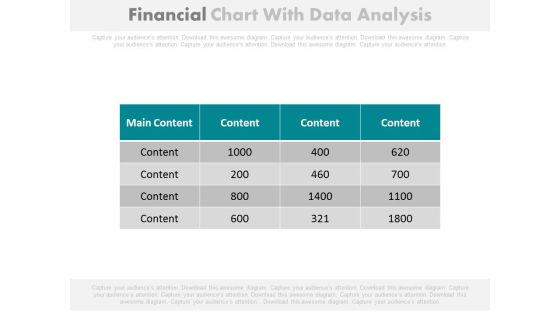
Financial Figures Data Analysis Report Powerpoint Slides
Our above PowerPoint template contains table chart with financial figures. This professional slide may be used to display data analysis report. Enlighten your audience with your breathtaking ideas.

Data Collection And Analysis Flow Chart Ppt PowerPoint Presentation Ideas Images
This is a data collection and analysis flow chart ppt powerpoint presentation ideas images. This is a five stage process. The stages in this process are flow, marketing, strategy, process, arrows.
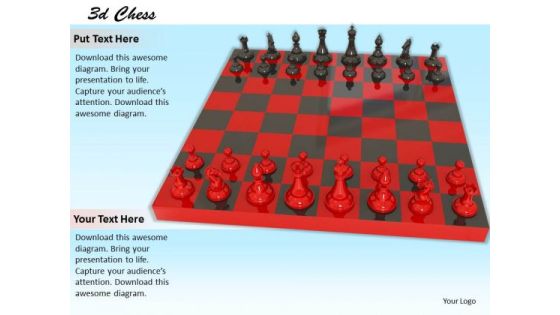
Stock Photo Red Chess Board Game In Red Color PowerPoint Slide
This image displays 3d chess game. This image slide has been designed with graphic of glossy red color chess board game .This image depicts strategy. You can change size, color and orientation of icons to your liking. Use this image in, your presentations to express views on leadership, teamwork, organization, community and management. This image may also be used in presentations to exhibit different business strategies. This image slide may also be used in chess game related presentations. This image will add charm to your presentations.

Big Data Challenges And Solutions Ppt PowerPoint Presentation Background Images
This is a big data challenges and solutions ppt powerpoint presentation background images. This is a one stage process. The stages in this process are lack of sufficiently skilled it staff and cost of technology, managing data quality, data integration.

Stock Photo Green Ball In Center Of Blue Maze PowerPoint Slide
This image slide displays green ball in center of blue maze . This image slide has been crafted with graphic of blue color maze with green color ball in center. This image slide depicts challenges. You may change size, color and orientation of any icon to your liking. Use this PowerPoint template, in your presentations to express views on strategies, policies and planning. This image may also be used to represent global business strategies. This image slide will enhance the quality of your presentations.

Big Data Workflow Management Ppt PowerPoint Presentation Introduction
This is a big data workflow management ppt powerpoint presentation introduction. This is a one stage process. The stages in this process are big data, actionable intelligence, database, location, social.

Crm Market Size Data Management Ppt PowerPoint Presentation File Microsoft
This is a crm market size data management ppt powerpoint presentation file microsoft. This is a four stage process. The stages in this process are crm, market, size, data, management.

Dashboard Ppt PowerPoint Presentation Styles Graphics Design
This is a dashboard ppt powerpoint presentation styles graphics design. This is a three stage process. The stages in this process are business, strategy, analysis, pretention, finance, dashboard.

Big Data Types Information Technology Ppt PowerPoint Presentation Show
This is a big data types information technology ppt powerpoint presentation show. This is a three stage process. The stages in this process are unstructured, structured, semi structured.

Big Data Database Types Ppt PowerPoint Presentation Outline
This is a big data database types ppt powerpoint presentation outline. This is a three stage process. The stages in this process are unstructured, structured, semi structured.
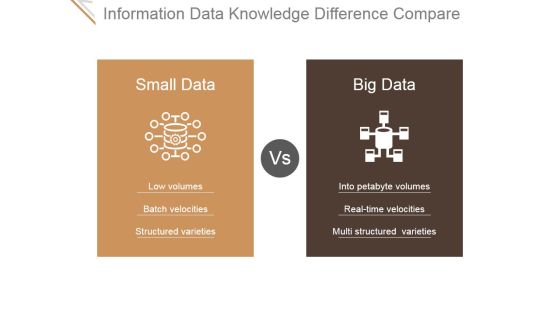
Information Data Knowledge Difference Compare Ppt PowerPoint Presentation Samples
This is a information data knowledge difference compare ppt powerpoint presentation samples. This is a two stage process. The stages in this process are low volumes, batch velocities, structured varieties, into petabyte volumes, real time velocities, multi structured varieties.

Our Key Metrics Ppt PowerPoint Presentation Gallery
This is a our key metrics ppt powerpoint presentation gallery. This is a three stage process. The stages in this process are low, medium, high.
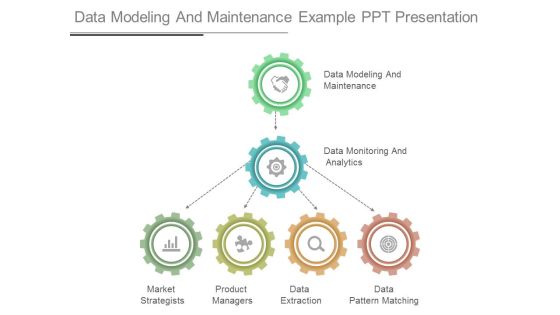
Data Modeling And Maintenance Example Ppt Presentation
This is a data modeling and maintenance example ppt presentation. This is a six stage process. The stages in this process are data modeling and maintenance, data monitoring and analytics, market strategists, product managers, data extraction, data pattern matching.

Key Performance Indicators Dashboard Powerpoint Themes
This is a key performance indicators dashboard powerpoint themes. This is a four stage process. The stages in this process are focus, objective, measures, targets, invites, vision and strategy, area of focus.

Location Ppt PowerPoint Presentation Pictures Picture
This is a location ppt powerpoint presentation pictures picture. This is a one stage process. The stages in this process are location, marketing, process, management, planning.


 Continue with Email

 Home
Home


