Business Snapshot
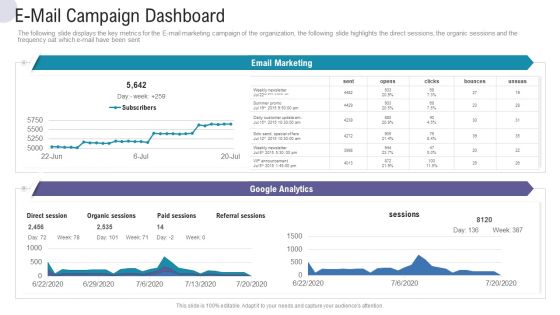
E-Mail Campaign Dashboard Commercial Activities Marketing Tools Mockup PDF
The following slide displays the key metrics for the E mail marketing campaign of the organization, the following slide highlights the direct sessions, the organic sessions and the frequency oat which e mail have been sent. Deliver and pitch your topic in the best possible manner with this e mail campaign dashboard commercial activities marketing tools mockup pdf. Use them to share invaluable insights on e mail campaign dashboard and impress your audience. This template can be altered and modified as per your expectations. So, grab it now.

Company Payout Dashboard For Transaction Data Collection Themes PDF
The slide covers a dashboard to highlight the status of current and previous transactions. Various elements included are card details, my cash, my savings, money sent, amount transfers, transaction history, etc. Pitch your topic with ease and precision using this Company Payout Dashboard For Transaction Data Collection Themes PDF. This layout presents information on Amount Transfers, Earning Month, Previous Transaction. It is also available for immediate download and adjustment. So, changes can be made in the color, design, graphics or any other component to create a unique layout.

Company Payout Dashboard Representing Accounts Payable Data Introduction PDF
The slide demonstrates a payment dashboard to measure and manage accounts payable. Various elements included are payable account, overdue, cash on hand, accounts payable funnel, invoice status, etc. Pitch your topic with ease and precision using this Company Payout Dashboard Representing Accounts Payable Data Introduction PDF. This layout presents information on Payable Accounts, Overdue, Invoices By Status, Account Payable Age. It is also available for immediate download and adjustment. So, changes can be made in the color, design, graphics or any other component to create a unique layout.

Stock Photo Goal Word On Construction Site PowerPoint Slide
This image slide displays construction site and goal word. This image slide depicts strategy for goal achievement. You can change size, color and orientation of icons to your liking. Use this image slide, in your presentations to express views on leadership, teamwork, management and constructions. This image slide may also be used in presentations to exhibit different business strategies. This image slide will enhance the quality of your presentations.

Stock Photo Golden Chess Piece On White Background PowerPoint Slide
This image slide displays golden chess piece. This conceptual image slide has been designed with graphic of gold color chess pawn on white background. This image slide depicts chess game. Use this PowerPoint template, in your presentations to express views on leadership and management. This image may also be used to exhibit different business strategies. This wonderful image is sure to help you achieve your goal of making professional presentations.
Stock Photo Icon Of Global Help Concept PowerPoint Slide
This conceptual image slide displays designer icon of globe. This image slide has been crafted with 3d graphic of globe and designer icons. This image slide depicts global help. Use this image slide to express views on globalization, protection, security, safety and travel in your presentations. This image slide may also be used to represent global business strategies. Create beautiful presentations using this image slide.
Stock Photo Illustration Of Fixing The Puzzles PowerPoint Slide
This image slide displays hand and puzzle . This image slide has been crafted with graphic of hand and puzzle pieces. This image depicts strategies. You may change size, color and orientation of any icon to your liking. Use this PowerPoint template, in your presentations to express views on challenges, solutions. And games related presentations. This image slide may also be used to represent different business strategies. This image slide will impart professional appearance to your presentations.

Stock Photo Red Arrow Leading White Arrows PowerPoint Slide
This image slide displays wall and arrows . This image slide has been crafted with graphic of arrows and individual red arrow. This image depicts leadership. You may change size, color and orientation of any icon to your liking. Use this PowerPoint template, in your presentations to express views on teamwork, leadership, growth, achievements and success. This image slide may also be used in presentations to represent different business strategies. This image slide will enhance the quality of your presentations.

Stock Photo Black Chess Board Pawns PowerPoint Slide
This PowerPoint slide displays chess pawns. This image slide has been crafted with graphic of black colored chess pawns on blue background. This image depicts different business strategies. Use this image slide to express views on teamwork, community, challenges, success and achievements in your presentations. This image slide may also be used to exhibit chess game. Enhance the quality of your presentations using this image.
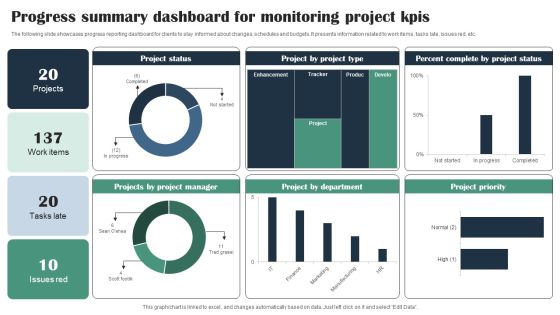
Progress Summary Dashboard For Monitoring Project Kpis Infographics PDF
The following slide showcases progress reporting dashboard for clients to stay informed about changes, schedules and budgets. It presents information related to work items, tasks late, issues red, etc. Pitch your topic with ease and precision using this Progress Summary Dashboard For Monitoring Project Kpis Infographics PDF. This layout presents information on Project Status, Project Manager, Project Type, Percent Complete. It is also available for immediate download and adjustment. So, changes can be made in the color, design, graphics or any other component to create a unique layout.

Dashboard To Analyze Flexible Working Strategies Impact On Employees Performance Professional PDF
The following slide delineates a key performance indicator KPI dashboard through which managers can evaluate the success of a flexible working policy on workforce performance. The major KPIs are absenteeism rate, overall labor effectiveness etc. If you are looking for a format to display your unique thoughts, then the professionally designed Dashboard To Analyze Flexible Working Strategies Impact On Employees Performance Professional PDF is the one for you. You can use it as a Google Slides template or a PowerPoint template. Incorporate impressive visuals, symbols, images, and other charts. Modify or reorganize the text boxes as you desire. Experiment with shade schemes and font pairings. Alter, share or cooperate with other people on your work. Download Dashboard To Analyze Flexible Working Strategies Impact On Employees Performance Professional PDF and find out how to give a successful presentation. Present a perfect display to your team and make your presentation unforgettable.

Manpower Analytics For Addressing Human Capital Challenges Diagrams PDF
This slide illustrates role of workforce data analytics for resolving human capital challenges. It includes developing training strategies, retain talent in organisation, work performance evaluation, strategies for redeployment, understanding collaboration and knowledge sharing. Showcasing this set of slides titled Manpower Analytics For Addressing Human Capital Challenges Diagrams PDF. The topics addressed in these templates are Gap Indicates, Training Strategies, Evaluation Performance. All the content presented in this PPT design is completely editable. Download it and make adjustments in color, background, font etc. as per your unique business setting.
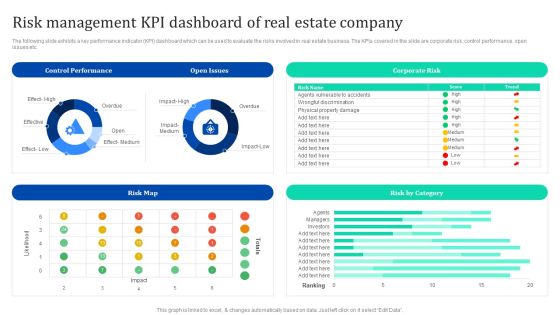
Risk Management Kpi Dashboard Of Real Estate Company Enhancing Process Improvement By Regularly Inspiration PDF
The following slide exhibits a key performance indicator KPI dashboard which can be used to evaluate the risks involved in real estate business. The KPIs covered in the slide are corporate risk, control performance, open issues etc. This Risk Management Kpi Dashboard Of Real Estate Company Enhancing Process Improvement By Regularly Inspiration PDF from Slidegeeks makes it easy to present information on your topic with precision. It provides customization options, so you can make changes to the colors, design, graphics, or any other component to create a unique layout. It is also available for immediate download, so you can begin using it right away. Slidegeeks has done good research to ensure that you have everything you need to make your presentation stand out. Make a name out there for a brilliant performance.
KPI Dashboard Showing Warehouse Data And Fleet Status Icons PDF
Pitch your topic with ease and precision using this KPI Dashboard Showing Warehouse Data And Fleet Status Icons PDF This layout presents information on Deliveries By Country, Delivery Status, Profit By Country It is also available for immediate download and adjustment. So, changes can be made in the color, design, graphics or any other component to create a unique layout.
Warehouse Data KPI With Order Performance Dashboard Icons PDF
Pitch your topic with ease and precision using this Warehouse Data KPI With Order Performance Dashboard Icons PDF This layout presents information on Inventory Accuracy, Order Accuracy Europe, Total Accuracy It is also available for immediate download and adjustment. So, changes can be made in the color, design, graphics or any other component to create a unique layout.

Scrum Operations Management Timeline Approach Clipart PDF
This slide showcase predictive data mining task bifurcation with data description with significant data mining. It include classification, prediction, time series analysis, clustering, summarization and feedback. Showcasing this set of slides titled Scrum Operations Management Timeline Approach Clipart PDF. The topics addressed in these templates are Classification, Prediction, Time Series Analysis. All the content presented in this PPT design is completely editable. Download it and make adjustments in color, background, font etc. as per your unique business setting.
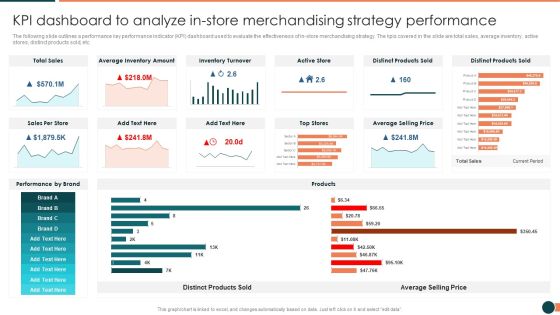
Developing Retail Marketing Strategies To Increase Revenue KPI Dashboard To Analyze Instore Information PDF
The following slide outlines a performance key performance indicator KPI dashboard used to evaluate the effectiveness of in store merchandising strategy. The kpis covered in the slide are total sales, average inventory, active stores, distinct products sold, etc.Deliver an awe inspiring pitch with this creative Developing Retail Marketing Strategies To Increase Revenue KPI Dashboard To Analyze Instore Information PDF bundle. Topics like Inventory Turnover, Distinct Products, Average Inventory can be discussed with this completely editable template. It is available for immediate download depending on the needs and requirements of the user.
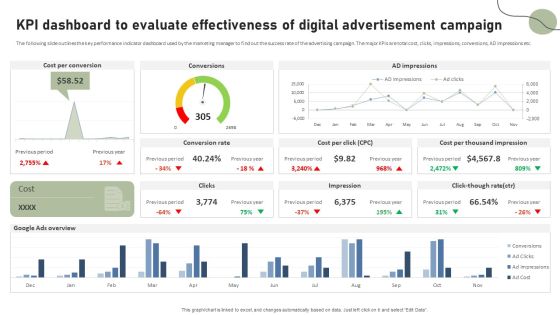
KPI Dashboard To Evaluate Effectiveness Of Digital Advertisement Campaign Pictures PDF
The following slide outlines the key performance indicator dashboard used by the marketing manager to find out the success rate of the advertising campaign. The major KPIs are total cost, clicks, impressions, conversions, AD impressions etc. Do you have to make sure that everyone on your team knows about any specific topic I yes, then you should give KPI Dashboard To Evaluate Effectiveness Of Digital Advertisement Campaign Pictures PDF a try. Our experts have put a lot of knowledge and effort into creating this impeccable KPI Dashboard To Evaluate Effectiveness Of Digital Advertisement Campaign Pictures PDF. You can use this template for your upcoming presentations, as the slides are perfect to represent even the tiniest detail. You can download these templates from the Slidegeeks website and these are easy to edit. So grab these today.
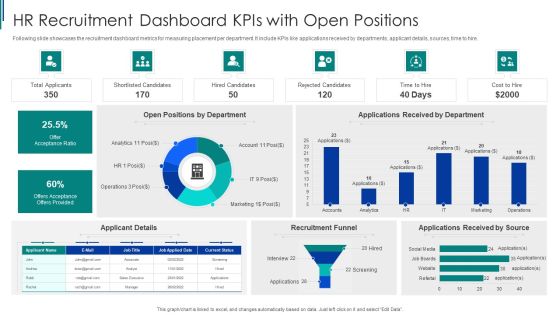
HR Recruitment Dashboard Kpis With Open Positions Ppt Model Good PDF
Following slide showcases the recruitment dashboard metrics for measuring placement per department. It include KPIs like applications received by departments, applicant details, sources, time to hire. Pitch your topic with ease and precision using this HR Recruitment Dashboard Kpis With Open Positions Ppt Model Good PDF. This layout presents information on Offer Acceptance Ratio, Recruitment Funnel, Applicant Details. It is also available for immediate download and adjustment. So, changes can be made in the color, design, graphics or any other component to create a unique layout.

Internal Organizational Communication Kpis And Dashboard With Channels Infographics PDF
This slide showcases dashboard that can help organization to assess the performance of internal communication and analyzing the user participation. Its key components are message success, channels and user engagement. Pitch your topic with ease and precision using this Internal Organizational Communication Kpis And Dashboard With Channels Infographics PDF. This layout presents information on User Participation, User Engagement, Message Success. It is also available for immediate download and adjustment. So, changes can be made in the color, design, graphics or any other component to create a unique layout.

Dashboard To Track Inventory Management Kpis Portrait PDF
This slide showcases KPIs that can help organization to evaluate the efficiency of inventory management process. Its key KPIs are out of stock rate, on time full deliveries, inventory turnover and average time to sell. Here you can discover an assortment of the finest PowerPoint and Google Slides templates. With these templates, you can create presentations for a variety of purposes while simultaneously providing your audience with an eye catching visual experience. Download Dashboard To Track Inventory Management Kpis Portrait PDF to deliver an impeccable presentation. These templates will make your job of preparing presentations much quicker, yet still, maintain a high level of quality. Slidegeeks has experienced researchers who prepare these templates and write high quality content for you. Later on, you can personalize the content by editing the Dashboard To Track Inventory Management Kpis Portrait PDF.

Application Project Portfolio Scorecard Scoring Metrics Information PDF
The slide showcases a project portfolio scorecard which help visualize and manage all of the projects in a portfolio, review portfolios progress and costs, make notes on the risks, and perform a cost-benefit analysis. includes a section for details about each project in the portfolio and categories include priority, status, planned versus actual costs, hours, and quality index rating. Showcasing this set of slides titled Application Project Portfolio Scorecard Scoring Metrics Information PDF. The topics addressed in these templates are Project Management Overview, Projects Key Performance Indicators, Additional Comments. All the content presented in this PPT design is completely editable. Download it and make adjustments in color, background, font etc. as per your unique business setting.

Dashboard Depicting Sales Kpis To Track Current Status Structure PDF
This slide shows the dashboard that depicts sales KPIs to track current status which involves won and lost opportunities, revenues and pipeline by territory, sales by different products, etc. Deliver and pitch your topic in the best possible manner with this Dashboard Depicting Sales Kpis To Track Current Status Structure PDF. Use them to share invaluable insights on Total Opportunities, Revenue By Territory, Sales By Product and impress your audience. This template can be altered and modified as per your expectations. So, grab it now.

Dashboard Tracking Essential Kpis For Ecommerce Performance Slides PDF
This slide provides information regarding essential KPIs for ecommerce performance dashboard tracking average bounce rate, new vs. old customers, channel revenue vs. channel acquisitions costs, channel revenue vs. sales, average conversion rate, etc. Deliver an awe inspiring pitch with this creative Dashboard Tracking Essential Kpis For Ecommerce Performance Slides PDF bundle. Topics like Average Bounce Rate, Channel Acquisition Costs, Channel Revenue can be discussed with this completely editable template. It is available for immediate download depending on the needs and requirements of the user.
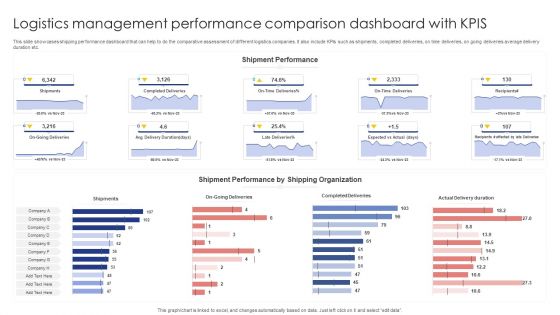
Logistics Management Performance Comparison Dashboard With Kpis Sample PDF
This slide showcases shipping performance dashboard that can help to do the comparative assessment of different logistics companies. It also include KPIs such as shipments, completed deliveries, on time deliveries, on going deliveries average delivery duration etc. Pitch your topic with ease and precision using this Logistics Management Performance Comparison Dashboard With Kpis Sample PDF. This layout presents information on Shipments, Completed Deliveries, Actual Delivery Duration. It is also available for immediate download and adjustment. So, changes can be made in the color, design, graphics or any other component to create a unique layout.

Customer Experience Improvement Model With Measurement Inspiration PDF
Here we provide outline of customer experience improvement plan covering design, delivery, measurement of key metrics for providing augmented customer experience. Showcasing this set of slides titled customer experience improvement model with measurement inspiration pdf. The topics addressed in these templates are design, measurement, customer experience. All the content presented in this PPT design is completely editable. Download it and make adjustments in color, background, font etc. as per your unique business setting.
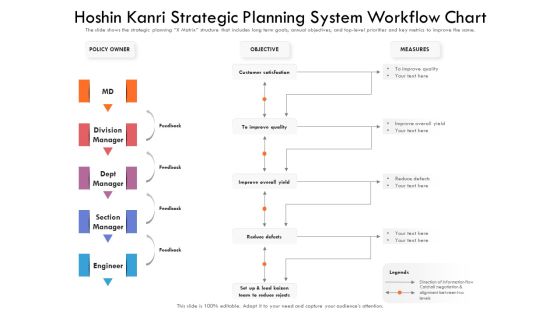
Hoshin Kanri Strategic Planning System Workflow Chart Ppt PowerPoint Presentation Gallery Show PDF
The slide shows the strategic planning X Matrix structure that includes long term goals, annual objectives, and top-level priorities and key metrics to improve the same. Showcasing this set of slides titled hoshin kanri strategic planning system workflow chart ppt powerpoint presentation gallery show pdf. The topics addressed in these templates are policy owner, objective, measures. All the content presented in this PPT design is completely editable. Download it and make adjustments in color, background, font etc. as per your unique business setting.

Grubhub Fund Raising Elevator Strong Conversion To Cash Flow Portrait PDF
This graph shows how key metrics have steadily improved over time which includes EBITDA, Cash taxes, etc. Deliver an awe inspiring pitch with this creative grubhub fund raising elevator strong conversion to cash flow portrait pdf bundle. Topics like business funds, working capital, requirements can be discussed with this completely editable template. It is available for immediate download depending on the needs and requirements of the user.
Market Validation And Traction Equity Capital Pitch Deck Ppt Icon Background Images PDF
Following slide provides informational statistics about market validation and business traction. Key metrics covered in the slide are active users, revenue and profit margins. Deliver an awe inspiring pitch with this creative market validation and traction equity capital pitch deck ppt icon background images pdf bundle. Topics like monthly active users, revenue, profit margin can be discussed with this completely editable template. It is available for immediate download depending on the needs and requirements of the user.

Market Validation And Traction Dating App Investor Fund Raising Pitch Deck Designs PDF
Following slide provides informational statistics about market validation and business traction. Key metrics covered in the slide are active users, revenue and profit margins. Deliver an awe inspiring pitch with this creative market validation and traction dating app investor fund raising pitch deck designs pdf bundle. Topics like market validation and traction dating app investor fund raising pitch deck can be discussed with this completely editable template. It is available for immediate download depending on the needs and requirements of the user.

Mobile Application Development Products Portfolio Management Timeline Sample PDF
This slide shows the product portfolio roadmap for mobile application development. It includes key metrics of milestone, self service, mobile, webstore, help desk and infrastructure. Showcasing this set of slides titled Mobile Application Development Products Portfolio Management Timeline Sample PDF. The topics addressed in these templates are Mobile Application Development, Products Portfolio Management Timeline. All the content presented in this PPT design is completely editable. Download it and make adjustments in color, background, font etc. as per your unique business setting.

Lean Operational Excellence Strategy Manufacturing Dashboard To Check Production System Efficiency Pictures PDF
This slide showcases manufacturing dashboard to track KPIs defined under lean and kaizen process improvement plans. Key performance metrics included here are TEEP, OEE, loading time, production quality, losses by hours, losses by categories etc. Pitch your topic with ease and precision using this Lean Operational Excellence Strategy Manufacturing Dashboard To Check Production System Efficiency Pictures PDF. This layout presents information on Loading, Availability, Performance. It is also available for immediate download and adjustment. So, changes can be made in the color, design, graphics or any other component to create a unique layout.

Scorecard For Corporate Financial Statement Performance Of Companies Professional PDF
This slide provides a scorecard which reports financial performance of certain companies by measuring financial key performing indicators and provides the management with valuable insight into potential areas of improvement. The elements are sales, net profit, working capital and equity. Showcasing this set of slides titled Scorecard For Corporate Financial Statement Performance Of Companies Professional PDF. The topics addressed in these templates are Terms Financial, Working Capital, Performance Compared. All the content presented in this PPT design is completely editable. Download it and make adjustments in color, background, font etc. as per your unique business setting.

Data Governance IT What Is A Data Steward In Stewardship Program Elements PDF
This slide outlines the overview of data stewards and their tasks that cater to centralizing details about data, verifying data quality, offering metadata, providing format suggestions for technical and business documentation, and protecting data. If your project calls for a presentation, then Slidegeeks is your go to partner because we have professionally designed, easy to edit templates that are perfect for any presentation. After downloading, you can easily edit Data Governance IT What Is A Data Steward In Stewardship Program Elements PDF and make the changes accordingly. You can rearrange slides or fill them with different images. Check out all the handy templates.

Organizations Yearly Marketing Operations Plan Icons PDF
The slide showcases an organizations yearly marketing operations plan. It covers activities, key initiatives, owners, KPIs and quarterly timeline. Showcasing this set of slides titled Organizations Yearly Marketing Operations Plan Icons PDF. The topics addressed in these templates are Sales And Operations Planning, Media Operations, Quarterly Advertising Campaign. All the content presented in this PPT design is completely editable. Download it and make adjustments in color, background, font etc. as per your unique business setting.

Social Media Artificial Intelligence Data Visualization Capabilities Dashboard Inspiration PDF
This slide illustrates graphical representation of visualization abilities of artificial intelligence on social media. It includes total impressions, total clicks, performance review etc. Pitch your topic with ease and precision using this Social Media Artificial Intelligence Data Visualization Capabilities Dashboard Inspiration PDF. This layout presents information on Artificial Intelligence, Data Visualization Capabilities. It is also available for immediate download and adjustment. So, changes can be made in the color, design, graphics or any other component to create a unique layout.
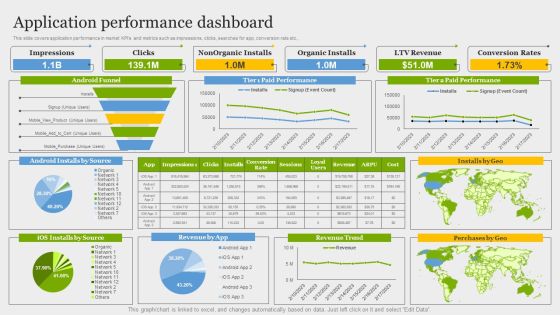
Online Application Development Application Performance Dashboard Information PDF
This slide covers application performance in market KPIs and metrics such as impressions, clicks, searches for app, conversion rate etc. Get a simple yet stunning designed Online Application Development Application Performance Dashboard Information PDF. It is the best one to establish the tone in your meetings. It is an excellent way to make your presentations highly effective. So, download this PPT today from Slidegeeks and see the positive impacts. Our easy to edit Online Application Development Application Performance Dashboard Information PDF can be your go to option for all upcoming conferences and meetings. So, what are you waiting for Grab this template today.

Dashboard Showing Emarketing Performance Digital Marketing Strategy Deployment Demonstration PDF
This slide focuses on the dashboard that shows the e-marketing performance such ad lead funnel, traffic sources, monthly leads and key metrics.Want to ace your presentation in front of a live audience Our Dashboard Showing Emarketing Performance Digital Marketing Strategy Deployment Demonstration PDF can help you do that by engaging all the users towards you.. Slidegeeks experts have put their efforts and expertise into creating these impeccable powerpoint presentations so that you can communicate your ideas clearly. Moreover, all the templates are customizable, and easy-to-edit and downloadable. Use these for both personal and commercial use.
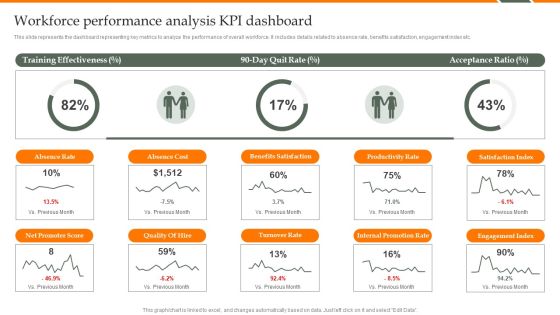
Human Resource Analytics Workforce Performance Analysis KPI Dashboard Structure PDF
This slide represents the dashboard representing key metrics to analyze the performance of overall workforce. It includes details related to absence rate, benefits satisfaction, engagement index etc. Find a pre-designed and impeccable Human Resource Analytics Workforce Performance Analysis KPI Dashboard Structure PDF. The templates can ace your presentation without additional effort. You can download these easy-to-edit presentation templates to make your presentation stand out from others. So, what are you waiting for Download the template from Slidegeeks today and give a unique touch to your presentation.
Website Leads Tracking Dashboard With Traffic Sources Infographics PDF
This slide showcases dashboard for lead generation that can help organziation to identify the traffic sources plus visitors and make changes in SEO of website. It also showcases key metrics that are bounce rate by week, visitors by user type, top channels by conversion, top campaign by conversion and top pages by conversion. Pitch your topic with ease and precision using this Website Leads Tracking Dashboard With Traffic Sources Infographics PDF. This layout presents information on Visitors User Type, Traffic Sources, Bounce Rate Week. It is also available for immediate download and adjustment. So, changes can be made in the color, design, graphics or any other component to create a unique layout.

Data Constraints Information Limitation And Risk Management Matrix For Analyzing Data Loss Brochure PDF
This slide covers the grid specifying data risk faced and its mitigation plan. The purpose of this template is to analyze the risk incurred and plans implemented to overcome the same. It also includes elements such as impact, likelihood, metric, threshold, etc.Showcasing this set of slides titled Data Constraints Information Limitation And Risk Management Matrix For Analyzing Data Loss Brochure PDF. The topics addressed in these templates are Data Distribution, Secure Computation, Verifiable Computation. All the content presented in this PPT design is completely editable. Download it and make adjustments in color, background, font etc. as per your unique business setting.

Analysis Of Comparative Analysis Of Cloud And Traditional Computing Data Storage Guidelines PDF
This slide enable the managers to analyse the difference among various categories of cloud and traditional data storage system. It compares categories such as data recovery, privacy, price, expandability, data usage etc. Showcasing this set of slides titled Analysis Of Comparative Analysis Of Cloud And Traditional Computing Data Storage Guidelines PDF. The topics addressed in these templates are Provides Less, Because Vulnerable, Expandability. All the content presented in this PPT design is completely editable. Download it and make adjustments in color, background, font etc. as per your unique business setting.

Different Categories Of Data Centers Types Of Data Centers Micro Data Centers Inspiration PDF
This slide represents the micro data center, its benefits, its size, and its architecture for enterprise IT using the hybrid cloud with micro data center MDC options and headquarter HQ micro data center MDC options. Are you searching for a Different Categories Of Data Centers Types Of Data Centers Micro Data Centers Inspiration PDF that is uncluttered, straightforward, and original Its easy to edit, and you can change the colors to suit your personal or business branding. For a presentation that expresses how much effort youve put in, this template is ideal With all of its features, including tables, diagrams, statistics, and lists, its perfect for a business plan presentation. Make your ideas more appealing with these professional slides. Download Different Categories Of Data Centers Types Of Data Centers Micro Data Centers Inspiration PDF from Slidegeeks today.
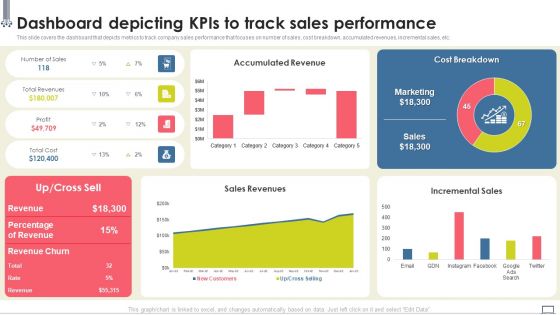
Change Management Strategy Dashboard Depicting Kpis To Track Sales Performance Ideas PDF
This slide covers the dashboard that depicts metrics to track company sales performance that focuses on number of sales, cost breakdown, accumulated revenues, incremental sales, etc. From laying roadmaps to briefing everything in detail, our templates are perfect for you. You can set the stage with your presentation slides. All you have to do is download these easy-to-edit and customizable templates. Change Management Strategy Dashboard Depicting Kpis To Track Sales Performance Ideas PDF will help you deliver an outstanding performance that everyone would remember and praise you for. Do download this presentation today.

Change Management Process Dashboard Depicting Kpis To Track Sales Performance Introduction PDF
This slide covers the dashboard that depicts metrics to track company sales performance that focuses on number of sales, cost breakdown, accumulated revenues, incremental sales, etc. From laying roadmaps to briefing everything in detail, our templates are perfect for you. You can set the stage with your presentation slides. All you have to do is download these easy-to-edit and customizable templates. Change Management Process Dashboard Depicting Kpis To Track Sales Performance Introduction PDF will help you deliver an outstanding performance that everyone would remember and praise you for. Do download this presentation today.

Predictive Data Model Predictive Analytics Clustering Model Overview Infographics PDF
This slide represents the overview of the clustering model of predictive analytics covering its two methods such as hard clustering and soft clustering. It also caters to algorithms used in this model, such as K-means, nearest neighbor, and biologically inspired clustering. Welcome to our selection of the Predictive Data Model Predictive Analytics Clustering Model Overview Infographics PDF. These are designed to help you showcase your creativity and bring your sphere to life. Planning and Innovation are essential for any business that is just starting out. This collection contains the designs that you need for your everyday presentations. All of our PowerPoints are 100 percent editable, so you can customize them to suit your needs. This multi-purpose template can be used in various situations. Grab these presentation templates today
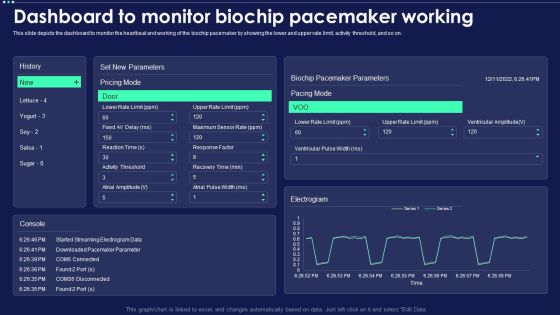
Micro Chip Dashboard To Monitor Biochip Pacemaker Working Themes PDF
This slide depicts the dashboard to monitor the heartbeat and working of the biochip pacemaker by showing the lower and upper rate limit, activity threshold, and so on. Deliver and pitch your topic in the best possible manner with this Micro Chip Dashboard To Monitor Biochip Pacemaker Working Themes PDF. Use them to share invaluable insights on Set New Parameters, Biochip Pacemaker Parameters, Pacing Mode and impress your audience. This template can be altered and modified as per your expectations. So, grab it now.

Biochips Use Cases Blood Glucose Monitoring Dashboard Introduction PDF
This slide demonstrates the dashboard for monitoring the glucose level in blood-based on insulin onboard, carb intake, physical activity. Slidegeeks has constructed Biochips Use Cases Blood Glucose Monitoring Dashboard Introduction PDF after conducting extensive research and examination. These presentation templates are constantly being generated and modified based on user preferences and critiques from editors. Here, you will find the most attractive templates for a range of purposes while taking into account ratings and remarks from users regarding the content. This is an excellent jumping-off point to explore our content and will give new users an insight into our top-notch PowerPoint Templates.

Employee Retention And Turnover Rates Monitoring Dashboard Mockup PDF
This slide showcases a dashboard to supervise and monitor employee retention and turnover score. It includes key components such as active employees, hires, exits, retention rate, turnover rate, etc. If your project calls for a presentation, then Slidegeeks is your go to partner because we have professionally designed, easy to edit templates that are perfect for any presentation. After downloading, you can easily edit Employee Retention And Turnover Rates Monitoring Dashboard Mockup PDF and make the changes accordingly. You can rearrange slides or fill them with different images. Check out all the handy templates

Energy Monitoring Dashboard With Emission Rate Mockup PDF
The slide showcases energy monitoring dashboard which showcases the monthly energy consumption and emission rate of a facility. It covers cost predicted, change in cost, usage estimate, energy intensity and carbon footprint or emission rate. Pitch your topic with ease and precision using this Energy Monitoring Dashboard With Emission Rate Mockup PDF. This layout presents information on Active Appliances, Cost Predicted, Energy Intensity. It is also available for immediate download and adjustment. So, changes can be made in the color, design, graphics or any other component to create a unique layout.

Dashboard For Personalized Digital Marketing Kpis Rules PDF
This slide showcases dashboard that can help organization to measure the KPIs after implementing personalized marketing campaigns. Its key elements are lead breakdown, web user to lead, lead to trial, leads by region and google analtics web traffic. This Dashboard For Personalized Digital Marketing Kpis Rules PDF from Slidegeeks makes it easy to present information on your topic with precision. It provides customization options, so you can make changes to the colors, design, graphics, or any other component to create a unique layout. It is also available for immediate download, so you can begin using it right away. Slidegeeks has done good research to ensure that you have everything you need to make your presentation stand out. Make a name out there for a brilliant performance.

Data Lake Architecture Future Of Data Analysis Ppt PowerPoint Presentation Complete Deck With Slides
This complete presentation has PPT slides on wide range of topics highlighting the core areas of your business needs. It has professionally designed templates with relevant visuals and subject driven content. This presentation deck has total of seventy five slides. Get access to the customizable templates. Our designers have created editable templates for your convenience. You can edit the colour, text and font size as per your need. You can add or delete the content if required. You are just a click to away to have this ready made presentation. Click the download button now.

Brand Promotion Initiatives Communication Strategy Sample PDF
The slide illustrates a communication plan to effectively manage and implement initiatives for brand promotion. Various initiatives included are regular posts, photo contests, hashtag promotions, sharing incentives, etc. Showcasing this set of slides titled Brand Promotion Initiatives Communication Strategy Sample PDF. The topics addressed in these templates are Regular Posts, Photo Contests, Hashtag Promotions. All the content presented in this PPT design is completely editable. Download it and make adjustments in color, background, font etc. as per your unique business setting.

Website Performance And Conversion Rate Analysis Ppt Slides Inspiration PDF
This slide covers dashboard showing webpage performance based on multiple KPIs. It includes elements such as users count, active sessions, conversation rate and cost, cost per click, top campaign performance, top countries by sessions, most engaged digital channels, etc. Showcasing this set of slides titled Website Performance And Conversion Rate Analysis Ppt Slides Inspiration PDF. The topics addressed in these templates are Digital Channels, Driving Maximum, Engagement. All the content presented in this PPT design is completely editable. Download it and make adjustments in color, background, font etc. as per your unique business setting.

Assessing Impact Of Sales Risk Management With KPI Dashboard Ppt Professional Graphics Pictures PDF
The following slide highlights some key performance indicators KPIs to measure the influence of executing sales risk management strategies on revenue performance. It includes elements such as target attainment rate, gross profit, annual growth rate etc. Are you in need of a template that can accommodate all of your creative concepts This one is crafted professionally and can be altered to fit any style. Use it with Google Slides or PowerPoint. Include striking photographs, symbols, depictions, and other visuals. Fill, move around, or remove text boxes as desired. Test out color palettes and font mixtures. Edit and save your work, or work with colleagues. Download Assessing Impact Of Sales Risk Management With KPI Dashboard Ppt Professional Graphics Pictures PDF and observe how to make your presentation outstanding. Give an impeccable presentation to your group and make your presentation unforgettable.

Data Requirements For Analytics Ppt PowerPoint Presentation Complete With Slides
If designing a presentation takes a lot of your time and resources and you are looking for a better alternative, then this data requirements for analytics ppt powerpoint presentation complete with slides is the right fit for you. This is a prefabricated set that can help you deliver a great presentation on the topic. All the thirty slides included in this sample template can be used to present a birds-eye view of the topic. These slides are also fully editable, giving you enough freedom to add specific details to make this layout more suited to your business setting. Apart from the content, all other elements like color, design, theme are also replaceable and editable. This helps in designing a variety of presentations with a single layout. Not only this, you can use this PPT design in formats like PDF, PNG, and JPG once downloaded. Therefore, without any further ado, download and utilize this sample presentation as per your liking.
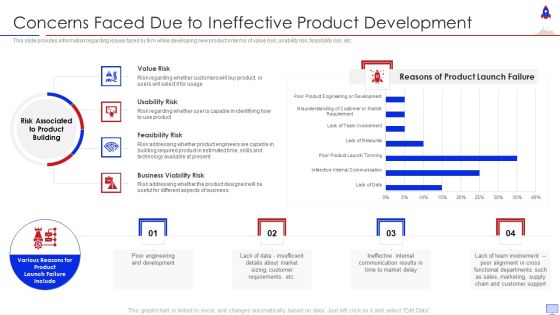
New Product Introduction In Market Concerns Faced Due To Ineffective Pictures PDF
This slide provides information regarding issues faced by firm while developing new product in terms of value risk, usability risk, feasibility risk, etc. Deliver an awe inspiring pitch with this creative new product introduction in market concerns faced due to ineffective pictures pdf bundle. Topics like value risk, usability risk, feasibility risk, business viability risk can be discussed with this completely editable template. It is available for immediate download depending on the needs and requirements of the user.

Controlling And Innovating Product Leader Responsibilities Concerns Faced Before Implementing Product Discovery Pictures Pdf
This slide provides information regarding issues faced by firm while implementing product discovery in terms of value risk, usability risk, feasibility risk, etc. Deliver an awe inspiring pitch with this creative controlling and innovating product leader responsibilities concerns faced before implementing product discovery pictures pdf bundle. Topics like usability risk, feasibility risk, business viability risk can be discussed with this completely editable template. It is available for immediate download depending on the needs and requirements of the user.

Feature Development Workflow Model For Machine Learning Pictures PDF
Following slide represents predictive workflow model of feature engineering. Purpose of this slide is to understand working mechanism and structure of feature engineering process that helps in simplifying complex data. It includes elements such as sources, raw data, features etc. Showcasing this set of slides titled Feature Development Workflow Model For Machine Learning Pictures PDF. The topics addressed in these templates are Raw Data, Features, Modeling. All the content presented in this PPT design is completely editable. Download it and make adjustments in color, background, font etc. as per your unique business setting.

Marketing Tactics For Medical Sector To Increase Patient Base Ppt Pictures Visuals PDF
This Slide highlights the basic steps of healthcare marketing. It includes create a strong online presence, posting on social media, search optimization and manage reputation. Showcasing this set of slides titled marketing tactics for medical sector to increase patient base ppt pictures visuals pdf. The topics addressed in these templates are optimization, informative, reputation. All the content presented in this PPT design is completely editable. Download it and make adjustments in color, background, font etc. as per your unique business setting.


 Continue with Email
 Sign up for an account
 Home
Home