Business Snapshot

PowerPoint Themes Process Transaction Finance Ppt Design
PowerPoint Themes Process Transaction Finance PPT Design-The template offers an excellent background to build up the various stages of your business process. Bullet-point your thoughts and ideas to profitably accomplish every step of every stage along the way. Give them an overview of your capability and insight into the minute details of the overall picture highlighting the the interdependence at every operational level-PowerPoint Themes Process Transaction Finance PPT Design-This ppt can be used for presentations relating to-Arrow, Art, Blue, Business, Button, Chart, Circular, Clip, Crystal, Design, Diagram, Element, Glass, Glowing, Graph, Graphic, Icon, Illustration, Isolated, Lift

PowerPoint Themes Process Transaction Graphic Ppt Presentation
PowerPoint Themes Process Transaction Graphic PPT Presentation-The template offers an excellent background to build up the various stages of your business process. Bullet-point your thoughts and ideas to profitably accomplish every step of every stage along the way. Give them an overview of your capability and insight into the minute details of the overall picture highlighting the the interdependence at every operational level-PowerPoint Themes Process Transaction Graphic PPT Presentation-This ppt can be used for presentations relating to-Arrow, Art, Blue, Business, Button, Chart, Circular, Clip, Crystal, Design, Diagram, Element, Glass, Glowing, Graph, Graphic, Icon, Illustration, Isolated, Lift

B2B And B2C Startups Marketing Mix Strategies Dashboard For Inbound Marketing Efforts Pictures PDF
The following slide displays key metrics that can help the organization to measure effectiveness of inbound marketing strategy, these can be cost per conversion, clicks, impressions, etc. Create an editable B2B And B2C Startups Marketing Mix Strategies Dashboard For Inbound Marketing Efforts Pictures PDF that communicates your idea and engages your audience. Whether you are presenting a business or an educational presentation, pre designed presentation templates help save time. B2B And B2C Startups Marketing Mix Strategies Dashboard For Inbound Marketing Efforts Pictures PDF is highly customizable and very easy to edit, covering many different styles from creative to business presentations. Slidegeeks has creative team members who have crafted amazing templates. So, go and get them without any delay.
Domains Where Data Analytics Is Creating Its Impression Ppt Icon Gallery PDF
This slide represents the data science impression in various domains such as marketing, upselling, social media, automation, travel, sales, credit and insurance, and healthcare. Deliver an awe inspiring pitch with this creative domains where data analytics is creating its impression ppt icon gallery pdf bundle. Topics like value, customer, analysis, digital marketing can be discussed with this completely editable template. It is available for immediate download depending on the needs and requirements of the user.

Employee Value Proposition Recruitment Dashboard To Track Performance Brochure PDF
This slide covers the recruitment KPIs metrics such as hiring per month, hiring by department, candidate feedback, offer acceptance ratio etc. Deliver and pitch your topic in the best possible manner with this Employee Value Proposition Recruitment Dashboard To Track Performance Brochure PDF. Use them to share invaluable insights on Business Development, Engineering, Facilities and impress your audience. This template can be altered and modified as per your expectations. So, grab it now.
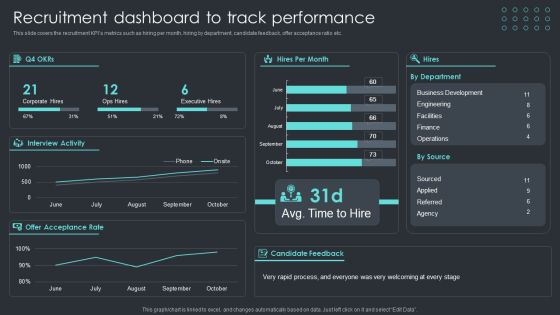
Inbound Recruiting Methodology Recruitment Dashboard To Track Performance Brochure PDF
This slide covers the recruitment KPIs metrics such as hiring per month, hiring by department, candidate feedback, offer acceptance ratio etc. Deliver and pitch your topic in the best possible manner with this Inbound Recruiting Methodology Recruitment Dashboard To Track Performance Brochure PDF. Use them to share invaluable insights on Business Development, Sourced, Offer Acceptance Rate and impress your audience. This template can be altered and modified as per your expectations. So, grab it now.
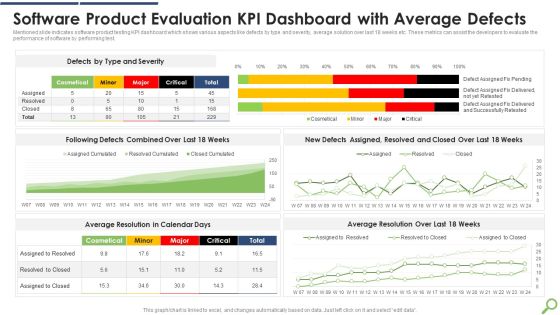
Software Product Evaluation KPI Dashboard With Average Defects Infographics PDF
Mentioned slide indicates software product testing KPI dashboard which shows various aspects like defects by type and severity, average solution over last 18 weeks etc. These metrics can assist the developers to evaluate the performance of software by performing test.Showcasing this set of slides titled Software Product Evaluation KPI Dashboard With Average Defects Infographics PDF The topics addressed in these templates are Software Product, Evaluation Dashboard, Average Defects All the content presented in this PPT design is completely editable. Download it and make adjustments in color, background, font etc. as per your unique business setting.
Job Application Status Report Ppt PowerPoint Presentation Icon Model PDF
Presenting this set of slides with name job application status report ppt powerpoint presentation icon model pdf. The topics discussed in these slides are agenda, planned data, action items. This is a completely editable PowerPoint presentation and is available for immediate download. Download now and impress your audience.

Healthcare Marketing Dashboard To Measure Patient Satisfaction Professional PDF
The following slide outlines comprehensive dashboard through which medical care companies can evaluate patient experience and make more informed decisions. The metrics outlined in slide are lab test, patient falls, average waiting time, etc. Create an editable Healthcare Marketing Dashboard To Measure Patient Satisfaction Professional PDF that communicates your idea and engages your audience. Whether you are presenting a business or an educational presentation, pre-designed presentation templates help save time. Healthcare Marketing Dashboard To Measure Patient Satisfaction Professional PDF is highly customizable and very easy to edit, covering many different styles from creative to business presentations. Slidegeeks has creative team members who have crafted amazing templates. So, go and get them without any delay.

Manufacturing Plant Corporate Sustainability Dashboard Indicating Sourcing And Consumption Infographics PDF
The following slide showcases business sustainability dashboard highlighting multiple sources of technology. It provides information about renewable energy, plant age, solar, wind, biomass, regionality, etc.Pitch your topic with ease and precision using this Manufacturing Plant Corporate Sustainability Dashboard Indicating Sourcing And Consumption Infographics PDF. This layout presents information on Energy Consumption, Freshwater Consumption, Chemical Recovery. It is also available for immediate download and adjustment. So, changes can be made in the color, design, graphics or any other component to create a unique layout.
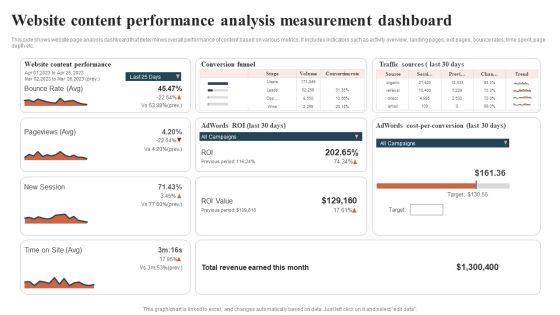
Website Content Performance Analysis Measurement Dashboard Guidelines PDF
This side shows website page analysis dashboard that determines overall performance of content based on various metrics. It includes indicators such as activity overview, landing pages, exit pages, bounce rates, time spent, page depth etc. Showcasing this set of slides titled Website Content Performance Analysis Measurement Dashboard Guidelines PDF. The topics addressed in these templates are Conversion Funnel, Traffic Sources, Total Revenue. All the content presented in this PPT design is completely editable. Download it and make adjustments in color, background, font etc. as per your unique business setting.

Be With Technology For Carrier Growth PowerPoint Templates Ppt Backgrounds For Slides 0513
Give them a dose of your ability. It will go down well with our Be With Technology For Carrier Growth PowerPoint Templates PPT Backgrounds For Slides. Connect the dots with our gear wheels PowerPoint Templates. Watch the whole picture clearly emerge. Dot your thoughts with our business PowerPoint Templates. Give your demeanour that Propah look.

Server With Cloud Concept PowerPoint Templates Ppt Backgrounds For Slides 0813
Doll up your thoughts with our Server With Cloud Concept PowerPoint Templates PPT Backgrounds For Slides. They will make a pretty picture. They say a dog is man's best friend. Our Business PowerPoint Templates come a close second. Establish the dominance of your ideas. Our Technology PowerPoint Templates will put them on top.
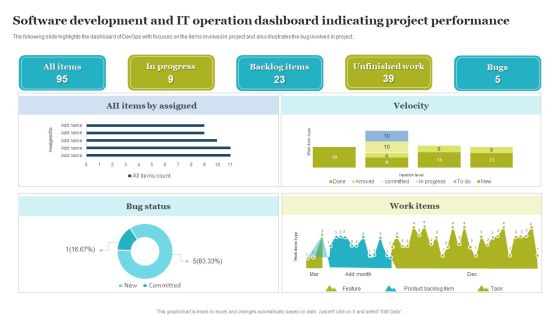
Software Development And IT Operation Dashboard Indicating Project Performance Demonstration PDF
The following slide highlights the dashboard of DevOps with focuses on the items involved in project and also illustrates the bug involved in project. Showcasing this set of slides titled Software Development And IT Operation Dashboard Indicating Project Performance Demonstration PDF. The topics addressed in these templates are Software Development, IT Operation Dashboard, Indicating Project Performance. All the content presented in this PPT design is completely editable. Download it and make adjustments in color, background, font etc. as per your unique business setting.
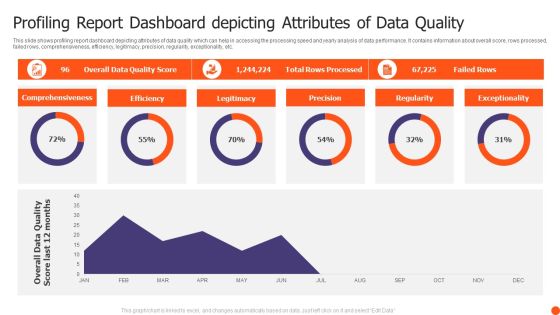
Profiling Report Dashboard Depicting Attributes Of Data Quality Themes PDF
This slide shows profiling report dashboard depicting attributes of data quality which can help in accessing the processing speed and yearly analysis of data performance. It contains information about overall score, rows processed, failed rows, comprehensiveness, efficiency, legitimacy, precision, regularity, exceptionality, etc. Pitch your topic with ease and precision using this Profiling Report Dashboard Depicting Attributes Of Data Quality Themes PDF. This layout presents information on Comprehensiveness, Efficiency, Legitimacy, Precision. It is also available for immediate download and adjustment. So, changes can be made in the color, design, graphics or any other component to create a unique layout.

Firm Marketing Dashboard Report With Closed Sales Ppt Slides Graphics Example PDF
This graph or chart is linked to excel, and changes automatically based on data. Just left click on it and select Edit Data. Showcasing this set of slides titled Firm Marketing Dashboard Report With Closed Sales Ppt Slides Graphics Example PDF. The topics addressed in these templates are Days On Market, Homes For Sale, Median Sales Price, Closed Sales. All the content presented in this PPT design is completely editable. Download it and make adjustments in color, background, font etc. as per your unique business setting.

Project Manager Skills Report With Change And Value Management Ppt PowerPoint Presentation Infographic Template Format Ideas PDF
Pitch your topic with ease and precision using this project manager skills report with change and value management ppt powerpoint presentation infographic template format ideas pdf. This layout presents information on achievement, awareness, knowledge, background, it architecture technology, it architecture data, it architecture application, it architecture business. It is also available for immediate download and adjustment. So, changes can be made in the color, design, graphics or any other component to create a unique layout.
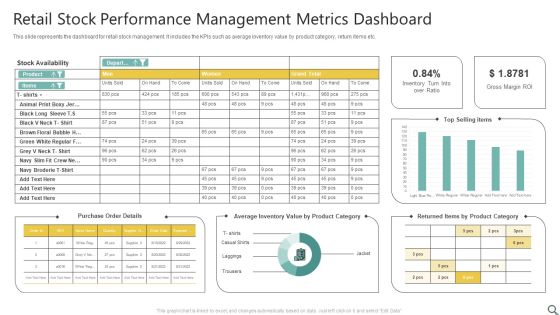
Retail Stock Performance Management Metrics Dashboard Ppt Professional Design Inspiration PDF
This slide represents the dashboard for retail stock management. It includes the KPIs such as average inventory value by product category, return items etc. Showcasing this set of slides titled Retail Stock Performance Management Metrics Dashboard Ppt Professional Design Inspiration PDF. The topics addressed in these templates are Stock Availability, Purchase Order Details, Top Selling Items. All the content presented in this PPT design is completely editable. Download it and make adjustments in color, background, font etc. as per your unique business setting.

Customer IT Service Desk Administration Summary Dashboard Information PDF
This slide represents dashboard representing the performance report of the customer service desk management team of the organization. It shows details related to tickets by status, tech group, alert level, request type, alert condition and ticket activity. Showcasing this set of slides titled Customer IT Service Desk Administration Summary Dashboard Information PDF. The topics addressed in these templates are Customer It Service Desk Administration Summary Dashboard. All the content presented in this PPT design is completely editable. Download it and make adjustments in color, background, font etc. as per your unique business setting.

Data And Analytics Roadmap Developing Algorithm Digital Data Analytics Ppt PowerPoint Presentation Complete Deck
Presenting this set of slides with name data and analytics roadmap developing algorithm digital data analytics ppt powerpoint presentation complete deck. The topics discussed in these slides are developing, algorithm, digital data analytics, data governance, optimizations. This is a completely editable PowerPoint presentation and is available for immediate download. Download now and impress your audience.

BPA Tools For Process Enhancement And Cost Minimization KPI Dashboard To Track Automation Performance In Employee Onboarding Graphics PDF
The following slide outlines performance key performance indicator KPI which can be used to evaluate business process automation performance in employee onboarding. The metrics highlighted in the slide are onboarding completion status, hires per office, etc. There are so many reasons you need a BPA Tools For Process Enhancement And Cost Minimization KPI Dashboard To Track Automation Performance In Employee Onboarding Graphics PDF. The first reason is you can not spend time making everything from scratch, Thus, Slidegeeks has made presentation templates for you too. You can easily download these templates from our website easily.

Overview Of Organizational Performance Kpi Dashboard To Measure Financial Position Sample PDF
The following slide outlines a comprehensive key performance indicator KPI dashboard highlighting different financial metrics. The KPIs are quick and current ratio, cash balance, days sales outstanding etc. Welcome to our selection of the Overview Of Organizational Performance Kpi Dashboard To Measure Financial Position Sample PDF. These are designed to help you showcase your creativity and bring your sphere to life. Planning and Innovation are essential for any business that is just starting out. This collection contains the designs that you need for your everyday presentations. All of our PowerPoints are 100 percent editable, so you can customize them to suit your needs. This multi-purpose template can be used in various situations. Grab these presentation templates today.
HR Manager KPI Dashboard With Employee Attrition Tracking Report Brochure PDF
This slide covers performance key indicators for HR manager. It also indicates employee turnover count, new recruitment, retention, training and development of new employees. Showcasing this set of slides titled HR Manager KPI Dashboard With Employee Attrition Tracking Report Brochure PDF. The topics addressed in these templates are Recruitment, Employee Turnover, Development. All the content presented in this PPT design is completely editable. Download it and make adjustments in color, background, font etc. as per your unique business setting.

Dashboard Indicating Funding Request Capital Raising Stages Ppt Show Infographics PDF
This slide showcases dashboard indicating status of multiple stages in funding ask. It provides information about valuation, discount, investors, seed round, angel, previous funding, etc. Showcasing this set of slides titled dashboard indicating funding request capital raising stages ppt show infographics pdf. The topics addressed in these templates are previous funding, building expenses, resource requirement. All the content presented in this PPT design is completely editable. Download it and make adjustments in color, background, font etc. as per your unique business setting.

Service Offered Comparison Report With Pricing Ppt PowerPoint Presentation Ideas Design Inspiration PDF
Pitch your topic with ease and precision using this service offered comparison report with pricing ppt powerpoint presentation ideas design inspiration pdf. This layout presents information on cloud database storage capacity, multiple file format support, multiple device login, data statistical analysis. It is also available for immediate download and adjustment. So, changes can be made in the color, design, graphics or any other component to create a unique layout.

Service Level Agreement KPI Dashboard Indicating Violation Count And Overdue Requests Diagrams PDF
This graph or chart is linked to excel, and changes automatically based on data. Just left click on it and select Edit Data. Showcasing this set of slides titled Service Level Agreement KPI Dashboard Indicating Violation Count And Overdue Requests Diagrams PDF. The topics addressed in these templates are Total Requests Category, Total Requests Status, Urgent Requests. All the content presented in this PPT design is completely editable. Download it and make adjustments in color, background, font etc. as per your unique business setting.

Texting Platforms Dashboard Indicating SMS Marketing Metrics Designs PDF
This slide showcase messaging platforms dashboard indicating sms marketing metrics which can be referred by businesses to check the activity of their current texting campaign. It contains information about consumers, plan, send, campaigns, growth, reports, outgoing and incoming.Pitch your topic with ease and precision using this texting platforms dashboard indicating sms marketing metrics designs pdf This layout presents information on texting platforms dashboard indicating sms marketing metrics It is also available for immediate download and adjustment. So, changes can be made in the color, design, graphics or any other component to create a unique layout.

Data Analytics Icons Slide Checklist Management Ppt PowerPoint Presentation Slides Design Templates
Presenting this set of slides with name data analytics icons slide checklist management ppt powerpoint presentation slides design templates. The topics discussed in these slides are business, management, planning, strategy, marketing. This is a completely editable PowerPoint presentation and is available for immediate download. Download now and impress your audience.
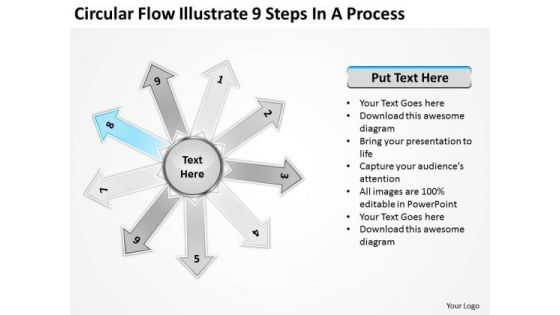
Circular Flow Illustrate 9 Steps In Process Ppt Motion PowerPoint Slides
We present our circular flow illustrate 9 steps in process ppt Motion PowerPoint Slides.Present our Process and flows PowerPoint Templates because You can Connect the dots. Fan expectations as the whole picture emerges. Use our Business PowerPoint Templates because this template can project the path to sucess that you have charted. Download and present our Marketing PowerPoint Templates because customer satisfaction is a mantra of the marketplace. Building a loyal client base is an essential element of your business. Use our Flow charts PowerPoint Templates because they will help you to organise the logic of your views. Use our Arrows PowerPoint Templates because clear thnking is your strength, transmit your thoughts to your eager team.Use these PowerPoint slides for presentations relating to Arrow, gray, business, circle, circular, concept, cycle, flow, four, graphic, icon, illustration, part, presentation, process, recycle, recycled, rendered, repeat, repetitive, reuse, round, symbol. The prominent colors used in the PowerPoint template are Blue, Black, White. People tell us our circular flow illustrate 9 steps in process ppt Motion PowerPoint Slides are Fashionable. We assure you our circle PowerPoint templates and PPT Slides are Cheerful. PowerPoint presentation experts tell us our circular flow illustrate 9 steps in process ppt Motion PowerPoint Slides are Fun. You can be sure our circle PowerPoint templates and PPT Slides are Attractive. Professionals tell us our circular flow illustrate 9 steps in process ppt Motion PowerPoint Slides are No-nonsense. Use our business PowerPoint templates and PPT Slides are Multicolored.

Tactical Personnel Planning Model Dashboard Pictures PDF
This slide displays the overall report of the organization workforce. It includes demand and supply , skill analysis , gap analysis and headcount plan. Showcasing this set of slides titled Tactical Personnel Planning Model Dashboard Pictures PDF. The topics addressed in these templates are Tactical Personnel Planning, Model Dashboard. All the content presented in this PPT design is completely editable. Download it and make adjustments in color, background, font etc. as per your unique business setting.
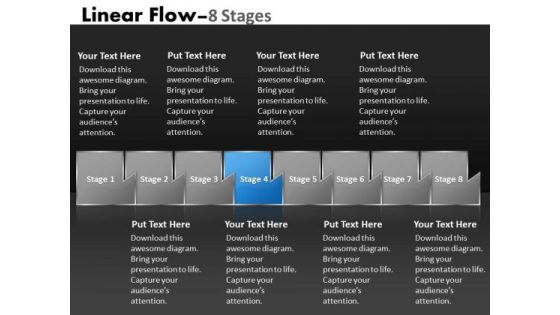
PowerPoint Template Multicolored Sequential Flow Spider Diagram Design
We present our PowerPoint template multicolored Sequential flow spider diagram design. Use our Business PowerPoint Templates because, Marketing Strategy Business Template: - Maximizing sales of your product is the intended destination. Use our Shapes PowerPoint Templates because; Give them an overview of your capability and insight into the minute details of the overall picture highlighting the interdependence at every operational level. Use our Design PowerPoint Templates because, explain the relevance of the different layers and stages in getting down to your core competence, ability and desired result. Use our Signs PowerPoint Templates because, your ideas are fundamentally stable with a broad base of workable possibilities. Use our Process and Flows PowerPoint Templates because, you know your business and have a vision for it. Use these PowerPoint slides for presentations relating to Abstract, Algorithm, Arrow, Business, Chart, Connection, Design, Development, Diagram, Direction, Element, Flow, Graph, Linear, Linear Diagram, Management, Organization, Plan, Process, Section, Segment, Set, Sign, Solution, Strategy, Symbol, Vector. The prominent colors used in the PowerPoint template are Blue, Gray, and Black

Consumer Data Augmentation With Salesforce Dashboard Ppt Pictures Portrait PDF
The following slide displays a dashboard of customer data enrichment with the sales force. It contains information about promoter score, customer loyalty, top performer agents, customer satisfaction, and agent performance. Showcasing this set of slides titled Consumer Data Augmentation With Salesforce Dashboard Ppt Pictures Portrait PDF. The topics addressed in these templates are Promoter Score, Customer Loyalty, Top Performing Agents. All the content presented in this PPT design is completely editable. Download it and make adjustments in color, background, font etc. as per your unique business setting.

Agriculture Budgeting And Management Based On Dashboard Report Topics PDF
Following slide presents a dashboard that will assist farmers in planning and budgeting based on the key performance indicators. The key performance indicators are crop name, area, last production, current temperature, etc. Showcasing this set of slides titled Agriculture Budgeting And Management Based On Dashboard Report Topics PDF. The topics addressed in these templates are Production Details. All the content presented in this PPT design is completely editable. Download it and make adjustments in color, background, font etc. as per your unique business setting.

Templates Diverging Process Arrow Chart Cycle PowerPoint
We present our templates diverging process arrow chart Cycle PowerPoint.Download and present our Circle Charts PowerPoint Templates because you have a good grasp of the essentials of such a venture. Alternate energy presents an array of opportunities. Use our Arrows PowerPoint Templates because you watch them slowly start to savour the flavour you have served them. Download and present our Business PowerPoint Templates because you have analysed many global markets and come up with possibilities. Highlight the pros and cons of other likely business oppurtunities. Present our Shapes PowerPoint Templates because there is a crucial aspect that requires extra attention. Present our Flow Charts PowerPoint Templates because you can Step by step develop the entire picture and project it onto their minds.Use these PowerPoint slides for presentations relating to 3d, adapt, adaptation, advancing, background, business, challenge, change, communication, compass, concept, different, direct, direction, diverge, evolving, find, future, futuristic, graphic, idea, innovative, lead, needle, new, opportunity, point, progress, progressive, render, rethinking, technology, traditional, unique, word. The prominent colors used in the PowerPoint template are Red, Purple, Pink. Customers tell us our templates diverging process arrow chart Cycle PowerPoint are Tranquil. PowerPoint presentation experts tell us our business PowerPoint templates and PPT Slides are Fashionable. People tell us our templates diverging process arrow chart Cycle PowerPoint are Second to none. People tell us our advancing PowerPoint templates and PPT Slides are Striking. Customers tell us our templates diverging process arrow chart Cycle PowerPoint are Spiffy. People tell us our challenge PowerPoint templates and PPT Slides are Upbeat.
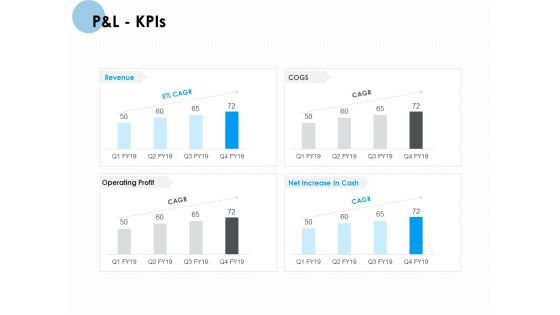
P And L Kpis Ppt PowerPoint Presentation Pictures Visual Aids
Presenting this set of slides with name p and l kpis ppt powerpoint presentation pictures visual aids. The topics discussed in these slides are net sales, total income, expenses, financing cost, profit before tax, profit after tax. This is a completely editable PowerPoint presentation and is available for immediate download. Download now and impress your audience.
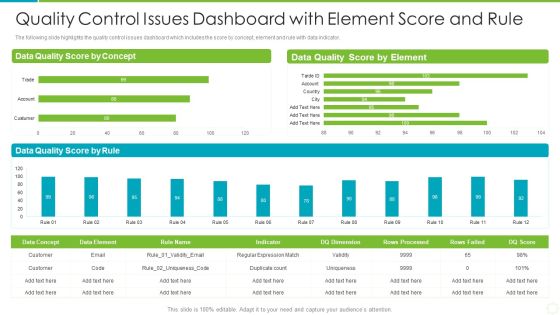
Quality Control Issues Dashboard With Element Score And Rule Summary PDF
The following slide highlights the quality control issues dashboard which includes the score by concept, element and rule with data indicator. Showcasing this set of slides titled quality control issues dashboard with element score and rule summary pdf. The topics addressed in these templates are quality control issues dashboard with element score and rule. All the content presented in this PPT design is completely editable. Download it and make adjustments in color, background, font etc. as per your unique business setting.

KPI Dashboard Of Real Estate Customer Relationship Management Pictures PDF
This slide represents the dashboard generated through CRM software used in a real estate company. It shows details related to key performance metrics such as leads by source, closed and pending transactions, projected monthly sales volume etc. Showcasing this set of slides titled KPI Dashboard Of Real Estate Customer Relationship Management Pictures PDF. The topics addressed in these templates are Projected Monthly Sales Volume, Leads By Source, Annual Commissions. All the content presented in this PPT design is completely editable. Download it and make adjustments in color, background, font etc. as per your unique business setting.
Digital Marketing Dashboard For Tracking Lead Generation Guidelines PDF
This slide showcases dashboard for digital marketing that can help organization track the monthly leads generated and performance of online marketing campaigns. Its key components are lead breakdown, total lead by program, web traffic targets, key conversion metrics, trial leads by region, total social media channels and key conversion metrics. Showcasing this set of slides titled Digital Marketing Dashboard For Tracking Lead Generation Guidelines PDF. The topics addressed in these templates are Lead By Program, Lead Breakdown, Key Conversion Metrics. All the content presented in this PPT design is completely editable. Download it and make adjustments in color, background, font etc. as per your unique business setting.

Working Of Big Data Services Google Cloud Computing System Inspiration PDF
This slide represents the working of big data service, and it also shows the stages in which extensive information is processed, such as ingest, process, store, analyze.Deliver and pitch your topic in the best possible manner with this Working Of Big Data Services Google Cloud Computing System Inspiration PDF. Use them to share invaluable insights on Query Analytics, Cloud Dataflow, Cloud Storage and impress your audience. This template can be altered and modified as per your expectations. So, grab it now.
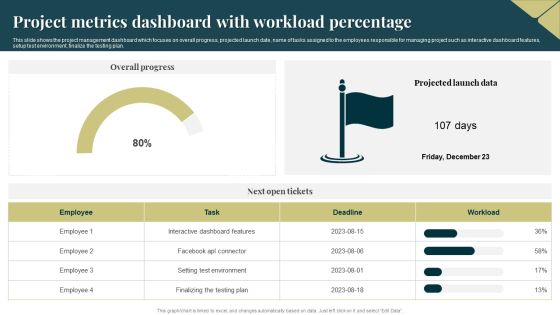
Project Metrics Dashboard With Workload Percentage Ideas PDF
This slide shows the project management dashboard which focuses on overall progress, projected launch date, name of tasks assigned to the employees responsible for managing project such as interactive dashboard features, setup test environment, finalize the testing plan. Showcasing this set of slides titled Project Metrics Dashboard With Workload Percentage Ideas PDF. The topics addressed in these templates are Environment, Plan, Dashboard. All the content presented in this PPT design is completely editable. Download it and make adjustments in color, background, font etc. as per your unique business setting.

Quality Monitoring Kpi Dashboard For Building And Construction Sector Portrait PDF
This slide covers quality monitoring KPI dashboard for construction industry. It involves data such as non conformance report, standard operating procedures, site inspection and quality training. Showcasing this set of slides titled Quality Monitoring Kpi Dashboard For Building And Construction Sector Portrait PDF. The topics addressed in these templates are Non Conformance Report, Standard Operating, Procedures. All the content presented in this PPT design is completely editable. Download it and make adjustments in color, background, font etc. as per your unique business setting.
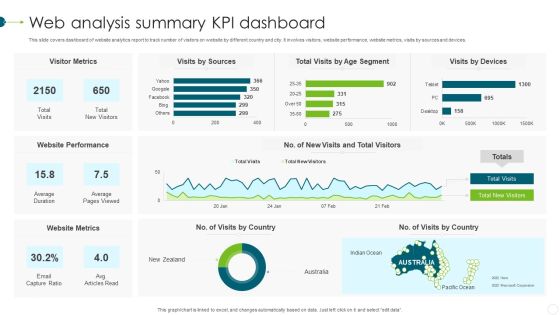
Web Analysis Summary KPI Dashboard Template PDF
This slide covers dashboard of website analytics report to track number of visitors on website by different country and city. It involves visitors, website performance, website metrics, visits by sources and devices. Showcasing this set of slides titled Web Analysis Summary KPI Dashboard Template PDF. The topics addressed in these templates are Website Metrics, Website Performance, Visitor Metrics. All the content presented in this PPT design is completely editable. Download it and make adjustments in color, background, font etc. as per your unique business setting.
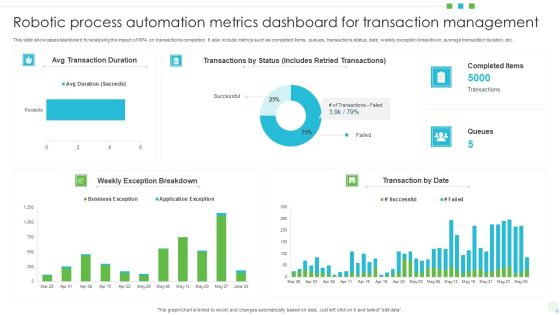
Robotic Process Automation Metrics Dashboard For Transaction Management Ideas PDF
This slide showcases dashboard for analysing the impact of RPA on transactions completion. It also include metrics such as completed items, queues, transactions status, date, weekly exception breakdown, average transaction duration, etc. Showcasing this set of slides titled Robotic Process Automation Metrics Dashboard For Transaction Management Ideas PDF. The topics addressed in these templates are Dashboard For Transaction Management, Robotic Process Automation Metrics. All the content presented in this PPT design is completely editable. Download it and make adjustments in color, background, font etc. as per your unique business setting.
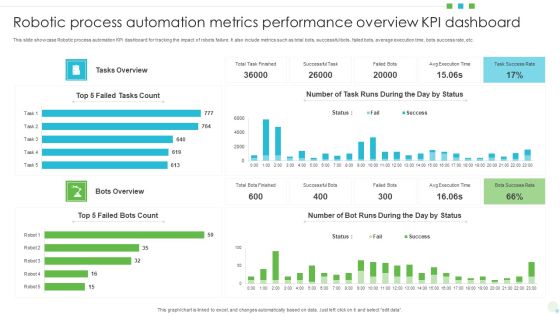
Robotic Process Automation Metrics Performance Overview KPI Dashboard Download PDF
This slide showcase Robotic process automation KPI dashboard for tracking the impact of robots failure. It also include metrics such as total bots, successful bots, failed bots, average execution time, bots success rate, etc. Showcasing this set of slides titled Robotic Process Automation Metrics Performance Overview KPI Dashboard Download PDF. The topics addressed in these templates are Robotic Process Automation, Metrics Performance Overview, Kpi Dashboard. All the content presented in this PPT design is completely editable. Download it and make adjustments in color, background, font etc. as per your unique business setting.

KPI Metrics Dashboard To Measure Winning Sales Strategy Ideas PDF
The following slide highlights a comprehensive dashboard showcasing the winning sales strategy performance. The dashboard covers information about metrics such as sales by different products, region, channels, etc.Showcasing this set of slides titled KPI Metrics Dashboard To Measure Winning Sales Strategy Ideas PDF The topics addressed in these templates are Sales By Channel, Various Products, Inventory Outstanding All the content presented in this PPT design is completely editable. Download it and make adjustments in color, background, font etc. as per your unique business setting.

Event Project Metrics Dashboard With Task Lengths Template PDF
This slide shows the event project management dashboard which focuses on task status such as complete, in progress, not started and overdue, workload on employees, lengths of tasks that covers creation of guest list, finalizing hires, planning event details, etc. Showcasing this set of slides titled Event Project Metrics Dashboard With Task Lengths Template PDF. The topics addressed in these templates are Event Project Metrics Dashboard, Cost. All the content presented in this PPT design is completely editable. Download it and make adjustments in color, background, font etc. as per your unique business setting.

Project Metrics Dashboard Depicting Issue Description Rules PDF
This slide focuses on the project management dashboard which covers the name of the company, department, project manager, statuses with tally, priorities using pie graph describing not started, in progress and closed projects and describes the issues such as timing, milestones, etc. Showcasing this set of slides titled Project Metrics Dashboard Depicting Issue Description Rules PDF. The topics addressed in these templates are Project Metrics, Dashboard Depicting. All the content presented in this PPT design is completely editable. Download it and make adjustments in color, background, font etc. as per your unique business setting.
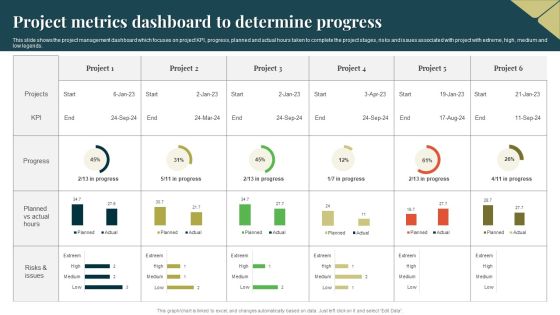
Project Metrics Dashboard To Determine Progress Guidelines PDF
This slide shows the project management dashboard which focuses on project KPI, progress, planned and actual hours taken to complete the project stages, risks and issues associated with project with extreme, high, medium and low legends. Showcasing this set of slides titled Project Metrics Dashboard To Determine Progress Guidelines PDF. The topics addressed in these templates are Project Metrics Dashboard, Determine Progress. All the content presented in this PPT design is completely editable. Download it and make adjustments in color, background, font etc. as per your unique business setting.
Project Metrics Dashboard With Task Summary Icons PDF
This slide shows the project management dashboard which covers the summary of different projects with time, cost, workload, tasks and progress with workload, created verses completed tasks, time spent on managing projects, etc. Showcasing this set of slides titled Project Metrics Dashboard With Task Summary Icons PDF. The topics addressed in these templates are Project Metrics Dashboard, Task Summary. All the content presented in this PPT design is completely editable. Download it and make adjustments in color, background, font etc. as per your unique business setting.

Data Processing Framework With Predictive Analytics Ppt PowerPoint Presentation Pictures Portfolio
Presenting this set of slides with name data processing framework with predictive analytics ppt powerpoint presentation pictures portfolio. The topics discussed in these slides are predictive analytics, machine learning, object store, long term archive. This is a completely editable PowerPoint presentation and is available for immediate download. Download now and impress your audience.
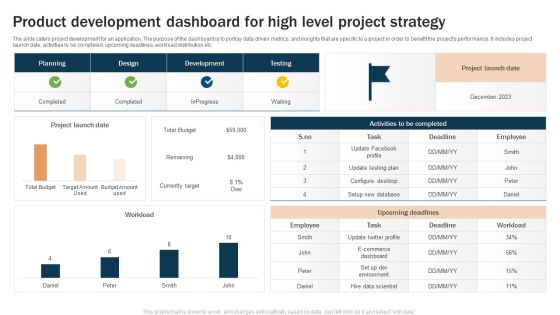
Product Development Dashboard For High Level Project Strategy Microsoft PDF
The slide caters project development for an application. The purpose of the dashboard is to portray data driven metrics, and insights that are specific to a project in order to benefit the projects performance. It includes project launch date, activities to be completed, upcoming deadlines, workload distribution etc. Showcasing this set of slides titled Product Development Dashboard For High Level Project Strategy Microsoft PDF. The topics addressed in these templates are Upcoming Deadlines, Project Launch, Upcoming Deadlines. All the content presented in this PPT design is completely editable. Download it and make adjustments in color, background, font etc. as per your unique business setting.
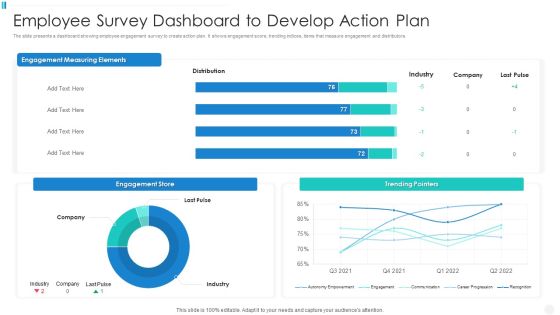
Employee Survey Dashboard To Develop Action Plan Infographics PDF
The slide presents a dashboard showing employee engagement survey to create action plan. It shows engagement score, trending indices, items that measure engagement and distributors. Showcasing this set of slides titled employee survey dashboard to develop action plan infographics pdf The topics addressed in these templates are employee survey dashboard to develop action plan All the content presented in this PPT design is completely editable. Download it and make adjustments in color, background, font etc. as per your unique business setting.
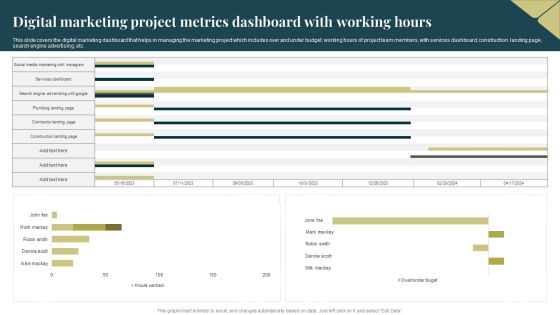
Digital Marketing Project Metrics Dashboard With Working Hours Download PDF
This slide covers the digital marketing dashboard that helps in managing the marketing project which includes over and under budget, working hours of project team members, with services dashboard, construction landing page, search engine advertising, etc. Showcasing this set of slides titled Digital Marketing Project Metrics Dashboard With Working Hours Download PDF. The topics addressed in these templates are Advertising, Social Media Marketing. All the content presented in this PPT design is completely editable. Download it and make adjustments in color, background, font etc. as per your unique business setting.

Cycle Time Chart With Number Of Work Operations Ppt PowerPoint Presentation Pictures Information PDF
Pitch your topic with ease and precision using this cycle time chart with number of work operations ppt powerpoint presentation pictures information pdf. This layout presents information on analysis, operation, product, inefficient procedures, drilling and tapping. It is also available for immediate download and adjustment. So, changes can be made in the color, design, graphics or any other component to create a unique layout.
Sales Key Performance Indicators Dashboard Ppt PowerPoint Presentation Icon PDF
Presenting this set of slides with name sales key performance indicators dashboard ppt powerpoint presentation icon pdf. The topics discussed in these slides are current ticket volume, sales key performance, indicators dashboard. This is a completely editable PowerPoint presentation and is available for immediate download. Download now and impress your audience.

Dashboard For Key Performance Indicator Of Financial KPI Background PDF
Pitch your topic with ease and precision using this Dashboard For Key Performance Indicator Of Financial KPI Background PDF. This layout presents information on Dashboard For Key, Performance Indicator, Financial KPI. It is also available for immediate download and adjustment. So, changes can be made in the color, design, graphics or any other component to create a unique layout.

Project Quality Management Key Performance Assurance Indicator Dashboard Guidelines PDF
Pitch your topic with ease and precision using this Project Quality Management Key Performance Assurance Indicator Dashboard Guidelines PDF. This layout presents information on Management Key, Performance Assurance, Indicator Dashboard. It is also available for immediate download and adjustment. So, changes can be made in the color, design, graphics or any other component to create a unique layout.

HR Recruitment Dashboard Kpis With Decline Reasons Ppt Pictures Example Introduction PDF
Following slide showcases the recruitment dashboard metrics for hiring of technical position. It include KPIs like status, applications, days in hiring, closed applications, phone screen, decline reason. Showcasing this set of slides titled HR Recruitment Dashboard Kpis With Decline Reasons Ppt Pictures Example Introduction PDF. The topics addressed in these templates are Recruitment Funnel, HR Recruitment, Dashboard Kpis. All the content presented in this PPT design is completely editable. Download it and make adjustments in color, background, font etc. as per your unique business setting.
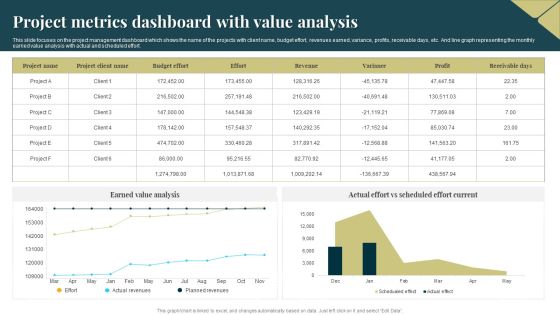
Project Metrics Dashboard With Value Analysis Introduction PDF
This slide focuses on the project management dashboard which shows the name of the projects with client name, budget effort, revenues earned, variance, profits, receivable days, etc. And line graph representing the monthly earned value analysis with actual and scheduled effort. Showcasing this set of slides titled Project Metrics Dashboard With Value Analysis Introduction PDF. The topics addressed in these templates are Budget Effort, Revenues, Earned Value Analysis. All the content presented in this PPT design is completely editable. Download it and make adjustments in color, background, font etc. as per your unique business setting.

Quality Key Performance Assurance Indicator Dashboard For Procurement Elements PDF
Pitch your topic with ease and precision using this Quality Key Performance Assurance Indicator Dashboard For Procurement Elements PDF. This layout presents information on Indicator Dashboard, Procurement. It is also available for immediate download and adjustment. So, changes can be made in the color, design, graphics or any other component to create a unique layout.
 Home
Home