AI PPT Maker
Templates
PPT Bundles
Design Services
Business PPTs
Business Plan
Management
Strategy
Introduction PPT
Roadmap
Self Introduction
Timelines
Process
Marketing
Agenda
Technology
Medical
Startup Business Plan
Cyber Security
Dashboards
SWOT
Proposals
Education
Pitch Deck
Digital Marketing
KPIs
Project Management
Product Management
Artificial Intelligence
Target Market
Communication
Supply Chain
Google Slides
Research Services
 One Pagers
All Categories
-
Home
- Customer Favorites
- Business Snapshot
Business Snapshot

Various Features Describing Online Marketing Technique Selection Report Ppt PowerPoint Presentation File Pictures PDF
Showcasing this set of slides titled various features describing online marketing technique selection report ppt powerpoint presentation file pictures pdf. The topics addressed in these templates are dashboard and analytics, devops integration. All the content presented in this PPT design is completely editable. Download it and make adjustments in color, background, font etc. as per your unique business setting.

How We Creates Delivers And Captures Value Virtual Currency Financing Pitch Deck Pictures PDF
The slide provides the business model of the company. It covers the key stakeholders partners, users, operators etc. uses of cryptocurrency, revenue generation etc. Deliver an awe inspiring pitch with this creative how we creates delivers and captures value virtual currency financing pitch deck pictures pdf bundle. Topics like shopkeepers, telecom companies, businesses, companies can be discussed with this completely editable template. It is available for immediate download depending on the needs and requirements of the user.
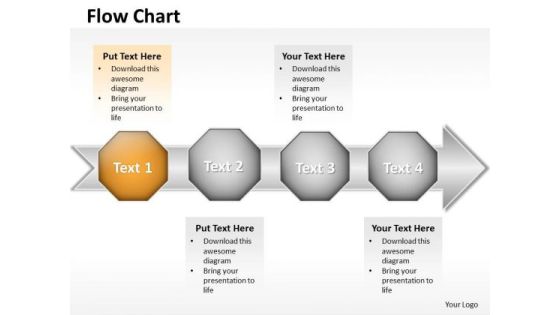
Ppt Arrow Organization Flow Ishikawa Diagram PowerPoint Template Templates
PPT arrow organization flow ishikawa diagram powerpoint template Templates-Develop competitive advantage with our above Diagram which contains a picture of Four hexagonal boxes on the arrow pointing towards the east direction. This image has been professionally designed to emphasize the concept of continuous process. Adjust the above image in your PPT presentations to visually support your content in your Business PPT slideshows.-PPT arrow organization flow ishikawa diagram powerpoint template Templates-arrow, art, assess, blue, business, ceo, chart, clip, clipart, compliance, corporate, corporation, design, development, diagram, executive, flow, glossy, graph, graphic, hierarchy, icon, illustration, implement, infographic, levels, marketing, modern, organize, process

Livestock Monitoring System To Optimize Animal Health Ppt Summary Background PDF
This slide represents the working of livestock monitoring system which includes smart collar, gateway, central data and analysis centre and personal device Create an editable Livestock Monitoring System To Optimize Animal Health Ppt Summary Background PDF that communicates your idea and engages your audience. Whether you are presenting a business or an educational presentation, pre-designed presentation templates help save time. Livestock Monitoring System To Optimize Animal Health Ppt Summary Background PDF is highly customizable and very easy to edit, covering many different styles from creative to business presentations. Slidegeeks has creative team members who have crafted amazing templates. So, go and get them without any delay.

Data Architecture And Software Algorithm Icon Pictures PDF
Showcasing this set of slides titled Data Architecture And Software Algorithm Icon Pictures PDF. The topics addressed in these templates are Data Architecture, Software Algorithm Icon . All the content presented in this PPT design is completely editable. Download it and make adjustments in color, background, font etc. as per your unique business setting.
Secondary Data Acquisition For Research Icon Pictures PDF
Showcasing this set of slides titled Secondary Data Acquisition For Research Icon Pictures PDF. The topics addressed in these templates are Secondary Data, Acquisition Research Icon. All the content presented in this PPT design is completely editable. Download it and make adjustments in color, background, font etc. as per your unique business setting.

Data Analytics Vector Icon Ppt PowerPoint Presentation Professional
Presenting this set of slides with name data analytics vector icon ppt powerpoint presentation professional. This is a four stage process. The stages in this process are data visualization icon, research analysis, business focus. This is a completely editable PowerPoint presentation and is available for immediate download. Download now and impress your audience.

Data Requirements For Analytics Dashboard For Email Marketing Mockup PDF
This slide shows dashboard for data requirement analysis of email marketing. It includes components such as subscribers growth, web and email performance. Showcasing this set of slides titled data requirements for analytics dashboard for email marketing mockup pdf. The topics addressed in these templates are growth, performance. All the content presented in this PPT design is completely editable. Download it and make adjustments in color, background, font etc. as per your unique business setting.

Education Dashboard With Fees Collection And Expense Metrics Demonstration PDF
This slide covers education key performance indicators tracking dashboard. It also include metrics such as total students, teachers, parents, total earrings, social media followers, event calendar, fees collection, and expenses. Showcasing this set of slides titled Education Dashboard With Fees Collection And Expense Metrics Demonstration PDF. The topics addressed in these templates are Event Calender, Annual Holidays, Fees Collection, Expenses. All the content presented in this PPT design is completely editable. Download it and make adjustments in color, background, font etc. as per your unique business setting.
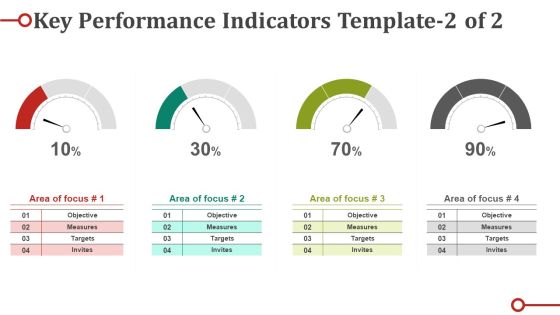
Key Performance Indicators Template 1 Ppt PowerPoint Presentation Styles Mockup
This is a key performance indicators template 1 ppt powerpoint presentation styles mockup. This is a four stage process. The stages in this process are dashboard, meter, business, marketing, speed.
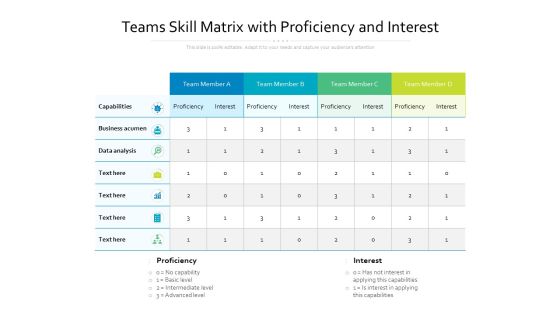
Teams Skill Matrix With Proficiency And Interest Ppt PowerPoint Presentation Show Model PDF
Presenting this set of slides with name teams skill matrix with proficiency and interest ppt powerpoint presentation show model pdf. The topics discussed in these slides are capabilities, business acumen, data analysis, team, interest, proficiency. This is a completely editable PowerPoint presentation and is available for immediate download. Download now and impress your audience.
IOT Ecosystem Vendor Landscape With Global Infrastructure Ppt PowerPoint Presentation Model Icons PDF
Pitch your topic with ease and precision using this iot ecosystem vendor landscape with global infrastructure ppt powerpoint presentation model icons pdf. This layout presents information on data analysis, global infrastructure, connectivity, business value, process. It is also available for immediate download and adjustment. So, changes can be made in the color, design, graphics or any other component to create a unique layout.

Call Center Metrics Dashboard With First Response Time Background PDF
Mentioned slide outlines a KPI dashboard which can be used by call centers for the ticket system. Tickets created, unassigned, open, solved, escalated, tickets solved by agents, first response and full resolution time are the key metrics highlighted in the slide. Pitch your topic with ease and precision using this Call Center Metrics Dashboard With First Response Time Background PDF. This layout presents information on First Response Time, First Resolution Time, Response Time. It is also available for immediate download and adjustment. So, changes can be made in the color, design, graphics or any other component to create a unique layout.

Comprehensive Guide For Enhancing Performance Of Customer Service Center Call Center Action Plan Dashboard Infographics PDF
This slide showcases call center action plan dashboard which highlights first call resolution, unresolved calls, customers call report, response time by weekday and average answer time. Are you in need of a template that can accommodate all of your creative concepts This one is crafted professionally and can be altered to fit any style. Use it with Google Slides or PowerPoint. Include striking photographs, symbols, depictions, and other visuals. Fill, move around, or remove text boxes as desired. Test out color palettes and font mixtures. Edit and save your work, or work with colleagues. Download Comprehensive Guide For Enhancing Performance Of Customer Service Center Call Center Action Plan Dashboard Infographics PDF and observe how to make your presentation outstanding. Give an impeccable presentation to your group and make your presentation unforgettable.

Social Platforms Data Analysis Sites Data Mining Icon Guidelines PDF
Showcasing this set of slides titled Social Platforms Data Analysis Sites Data Mining Icon Guidelines PDF. The topics addressed in these templates are Social Platforms Data Analysis, Sites Data Mining Icon. All the content presented in this PPT design is completely editable. Download it and make adjustments in color, background, font etc. as per your unique business setting.
Employee Talent Management Procedure Tracking Dashboard With Kpis Download PDF
This slide represents dashboard of the human resource department for tracking the performance and management of organizations workforce. It includes details related to monthly new hires, total active employees, suite people metrics along with key performance indicators. Showcasing this set of slides titled Employee Talent Management Procedure Tracking Dashboard With Kpis Download PDF. The topics addressed in these templates are Total Active Employees, Employees, Suite People Metrics. All the content presented in this PPT design is completely editable. Download it and make adjustments in color, background, font etc. as per your unique business setting.

Data Center Kpis For Physical And Virtual Computing Systems Ppt Infographic Template Pictures PDF
Showcasing this set of slides titled Data Center Kpis For Physical And Virtual Computing Systems Ppt Infographic Template Pictures PDF. The topics addressed in these templates are Operating Systems, Computing Systems, Data Center. All the content presented in this PPT design is completely editable. Download it and make adjustments in color, background, font etc. as per your unique business setting.

Ppt Pie Family Tree Chart PowerPoint 2003 Person Standing Green Piece Templates
PPT pie family tree chart PowerPoint 2003 person standing green piece Templates-The above Diagram displays a picture of eight circular text boxes placed in sequential manner. This image has been professionally designed to emphasize the concept of Operations performed in Circular process. Adjust the above image in your PPT presentations to visually support your content in your Business PPT slideshows.-PPT pie family tree chart PowerPoint 2003 person standing green piece Templates-arrow, bar, business, businessman, candidate, cartoon, character, chart, circle, circular, client, communication, company, concept, diagram, finance, financial, flow, growth, human, illustration, increase, information, iteration, man, market, marketing, process, processing, profit, sales, statistics, stats, success, target

Dashboard For Monitoring Social Media Platforms Marketing Document Slides PDF
This slide provides marketing report for various social media platforms aimed at displaying data insights in one place using relevant key performance indicators. It covers four platforms with key insights on marketing performance measured by metrics. Showcasing this set of slides titled Dashboard For Monitoring Social Media Platforms Marketing Document Slides PDF. The topics addressed in these templates are Impressions, Engagement, Target. All the content presented in this PPT design is completely editable. Download it and make adjustments in color, background, font etc. as per your unique business setting.

Client Management Kpis For Measuring Sales Performance Elements PDF
Showcasing this set of slides titled Client Management Kpis For Measuring Sales Performance Elements PDF. The topics addressed in these templates are Client Management Kpis For Measuring Sales Performance. All the content presented in this PPT design is completely editable. Download it and make adjustments in color, background, font etc. as per your unique business setting.

Data Analytics Tools With Access And Store Ppt PowerPoint Presentation Inspiration Aids PDF
Showcasing this set of slides titled data analytics tools with access and store ppt powerpoint presentation inspiration aids pdf. The topics addressed in these templates are cost of software, data security, collaboration, skills or training, tool performance. All the content presented in this PPT design is completely editable. Download it and make adjustments in color, background, font etc. as per your unique business setting.

Financial KPI Dashboard With Liquidity Ratio Analysis And Current Assets Breakdown Ideas PDF
This showcases KPI dashboard the can help organization to evaluate the financial performance and analyze the liquidity ratios. Its key components are vendor payment error rate, budget variance and cash conversion cycle. Showcasing this set of slides titled. The topics addressed in these templates are Quick Status, Workning Capital, Budget Variance. All the content presented in this PPT design is completely editable. Download it and make adjustments in color, background, font etc. as per your unique business setting.

Ppt Circular Operation Of 5 Steps Involved Procedure PowerPoint Templates
PPT circular operation of 5 steps involved procedure PowerPoint Templates-The above Diagram displays a picture of five circular text boxes placed in sequential manner. This image has been professionally designed to emphasize the concept of Operations performed in Circular process. Adjust the above image in your PPT presentations to visually support your content in your Business PPT slideshows.-PPT circular operation of 5 steps involved procedure PowerPoint Templates-Abstract, Art, Artistic, Backdrop, Background, Bend, Black, Business, Circle, Copy-Space, Create, Design, Dot, Dotted, Draw, Element, Flower, Gradient, Grid, Icon, Illustration, Leaf, Leaves, Logo, Mold, Motif, Nature, Pattern, Petal, Radiate, Retro, Round
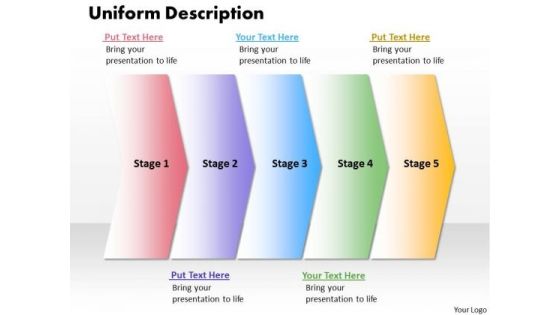
Ppt Uniform Description Of 5 Steps Working With Slide Numbers PowerPoint Templates
PPT uniform description of 5 steps working with slide numbers PowerPoint Templates-The above Diagram displays a picture of five Arrows placed in sequential manner. This image has been professionally designed to emphasize the concept of Operations performed in Circular process. Adjust the above image in your PPT presentations to visually support your content in your Business PPT slideshows.-PPT uniform description of 5 steps working with slide numbers PowerPoint Templates-Linear, Flow, Arrow, Background, Process, Business, Chart, Diagram, Financial, Graphic, Gray, Icon, Illustration, Management, Orange, Perspective, Process, Reflection, Stage, Spheres, Text,

Ppt Multiple Tasks Diagram 5 Stages PowerPoint Templates 2003 0812
PPT multiple tasks diagram 5 stages powerpoint templates 2003 0812-The above Diagram displays a picture of five circular text boxes placed in 3D manner. This image has been professionally designed to emphasize the concept of Operations performed in Circular process. Adjust the above image in your PPT presentations to visually support your content in your Business PPT slideshows. This Diagram illustrates the concept of purple circular box.-PPT multiple tasks diagram 5 stages powerpoint templates 2003 0812-3d, Abstract, Backgrounds, Ball, Business, Choice, Comparison, Concept, Descriptive, Equilibrium, Grow, Illustrations, Instrument, Measurement, Metallic, Part, Partnership, Pattern, Progress, Reflections, Scales, Several, Sphere, Strategy, Success

Risk Metrics Dashboard Showing Priorities Infographics PDF
This slide illustrates graphical representation of corporate risk data. It includes monthly risks with their priorities, and risk summary quarter wise. Showcasing this set of slides titled Risk Metrics Dashboard Showing Priorities Infographics PDF. The topics addressed in these templates are Risk Metrics Dashboard Showing Priorities. All the content presented in this PPT design is completely editable. Download it and make adjustments in color, background, font etc. as per your unique business setting.

Executing Advance Data Analytics At Workspace Ppt PowerPoint Presentation Complete Deck With Slides
This complete deck acts as a great communication tool. It helps you in conveying your business message with personalized sets of graphics, icons etc. Comprising a set of seventy three slides, this complete deck can help you persuade your audience. It also induces strategic thinking as it has been thoroughly researched and put together by our experts. Not only is it easily downloadable but also editable. The color, graphics, theme any component can be altered to fit your individual needs. So grab it now.

Data Warehouse Analytics App Ppt PowerPoint Presentation Complete Deck With Slides
This complete presentation has PPT slides on wide range of topics highlighting the core areas of your business needs. It has professionally designed templates with relevant visuals and subject driven content. This presentation deck has total of eighty nine slides. Get access to the customizable templates. Our designers have created editable templates for your convenience. You can edit the colour, text and font size as per your need. You can add or delete the content if required. You are just a click to away to have this ready made presentation. Click the download button now.

Force Field Analysis Template 1 Ppt PowerPoint Presentation Professional
This is a force field analysis template 1 ppt powerpoint presentation professional. This is a eight stage process. The stages in this process are increase revenue, increase market share, market segment by customers, generate economies of scale, upset business partners, damage corporate image, cost risks, driving sales from current.

Information Storage Model For Information Automation And Availability Ideas PDF
This slide represents automated data storage model illustrating automated backup scheduler, agent, cloud backup, database, backup reports and repository server. Showcasing this set of slides titled information storage model for information automation and availability ideas pdf. The topics addressed in these templates are determining, database, server. All the content presented in this PPT design is completely editable. Download it and make adjustments in color, background, font etc. as per your unique business setting.

Digital Network Security Assessment Flowchart Structure PDF
This slide showcases digital network security assessment flowchart which helps ensure reduction in information leaks. It provides information regarding network enumeration, service assessment and data collection and reporting. Showcasing this set of slides titled Digital Network Security Assessment Flowchart Structure PDF. The topics addressed in these templates are Account Holder, Information Leak, Network Service Assessment. All the content presented in this PPT design is completely editable. Download it and make adjustments in color, background, font etc. as per your unique business setting.
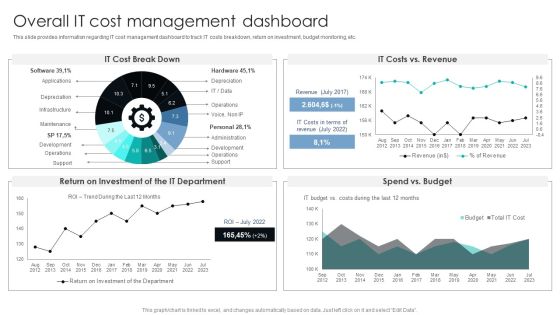
IT Infrastructure Library Procedure Management Playbook Overall IT Cost Management Dashboard Elements PDF
This slide provides information regarding IT cost management dashboard to track IT costs breakdown, return on investment, budget monitoring, etc. The IT Infrastructure Library Procedure Management Playbook Overall IT Cost Management Dashboard Elements PDF is a compilation of the most recent design trends as a series of slides. It is suitable for any subject or industry presentation, containing attractive visuals and photo spots for businesses to clearly express their messages. This template contains a variety of slides for the user to input data, such as structures to contrast two elements, bullet points, and slides for written information. Slidegeeks is prepared to create an impression.

Sales Force Efficacy Report With Key Metrics Ppt PowerPoint Presentation File Summary PDF
Showcasing this set of slides titled sales force efficacy report with key metrics ppt powerpoint presentation file summary pdf. The topics addressed in these templates are sales force efficacy report with key metrics All the content presented in this PPT design is completely editable. Download it and make adjustments in color, background, font etc. as per your unique business setting.

Product Manufacturing Data Analytics Kpis Dashboard Guidelines PDF
This slide represents the data analytics dashboard for production manufacturing and management. It includes details related to KPIs such as rework quantity, labor cost, performance, overall equipment effectiveness etc. Showcasing this set of slides titled Product Manufacturing Data Analytics Kpis Dashboard Guidelines PDF. The topics addressed in these templates are Quantity, Rework Quantity, Manufacturing Cost, Labor Cot. All the content presented in this PPT design is completely editable. Download it and make adjustments in color, background, font etc. as per your unique business setting.

Three Dashboard For Corporate Level Strategy Powerpoint Slides
This PowerPoint template has been designed with three dashboards. You may use this slide to display corporate level strategy. This diagram provides an effective way of displaying information you can edit text, color, shade and style as per you need.

Stock Photo Online Global Networking PowerPoint Slide
This image slide displays graphic of globe surrounded with laptops. Use this image slide, in your presentations to express views on global communication and networking. This image may also be used to depict global business strategies. This image slide will enhance the quality of your presentations.

Customer Data Analysis Dashboard With Spread Of Opportunity Professional PDF
This slide indicates the win loss analysis dashboard providing information regarding opportunity spread across multiple regions of target sales territory. Showcasing this set of slides titled customer data analysis dashboard with spread of opportunity professional pdf. The topics addressed in these templates are customer data analysis dashboard with spread of opportunity. All the content presented in this PPT design is completely editable. Download it and make adjustments in color, background, font etc. as per your unique business setting.

Key Statistics Of Marketing Management KPI Metrics Ppt PowerPoint Presentation Professional Graphics PDF
Deliver an awe-inspiring pitch with this creative key statistics of marketing management kpi metrics ppt powerpoint presentation professional graphics pdf bundle. Topics like business objectives, awareness, engagement, lead generation, customer support, product innovation can be discussed with this completely editable template. It is available for immediate download depending on the needs and requirements of the user.

Reward Chart For Kids With Key Performance Metrics Ppt Model Brochure PDF
Showcasing this set of slides titled Reward Chart For Kids With Key Performance Metrics Ppt Model Brochure PDF. The topics addressed in these templates are Good At Sports, Read Book. All the content presented in this PPT design is completely editable. Download it and make adjustments in color, background, font etc. as per your unique business setting.
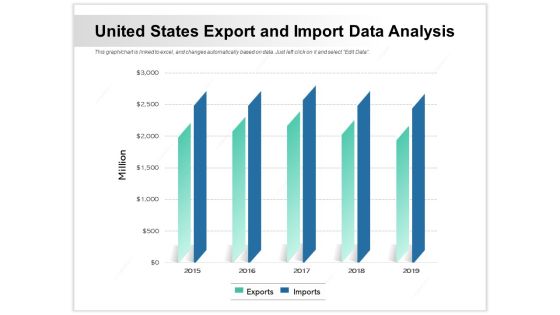
United States Export And Import Data Analysis Ppt PowerPoint Presentation Pictures Clipart Images PDF
Showcasing this set of slides titled united states export and import data analysis ppt powerpoint presentation pictures clipart images pdf. The topics addressed in these templates are united states export and import data analysis. All the content presented in this PPT design is completely editable. Download it and make adjustments in color, background, font etc. as per your unique business setting.

E Mail Marketing Campaign Outcomes Kpis Result Analysis Mockup PDF
Showcasing this set of slides titled E Mail Marketing Campaign Outcomes Kpis Result Analysis Mockup PDF. The topics addressed in these templates are Marketing Campaign, Outcomes Kpis, Result Analysis. All the content presented in this PPT design is completely editable. Download it and make adjustments in color, background, font etc. as per your unique business setting.
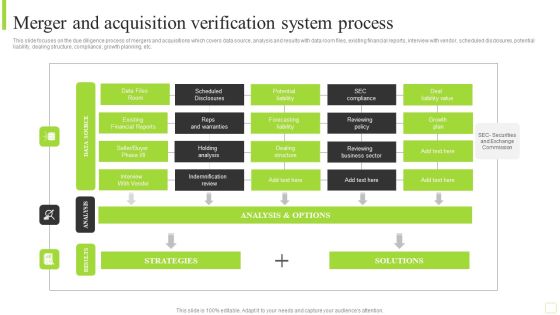
Merger And Acquisition Verification System Process Designs PDF
This slide focuses on the due diligence process of mergers and acquisitions which covers data source, analysis and results with data room files, existing financial reports, interview with vendor, scheduled disclosures, potential liability, dealing structure, compliance, growth planning, etc. Pitch your topic with ease and precision using this Merger And Acquisition Verification System Process Designs PDF. This layout presents information on Existing Financial Reports, Potential Liability, Reviewing Business Sector. It is also available for immediate download and adjustment. So, changes can be made in the color, design, graphics or any other component to create a unique layout.

Big Data Analytics Icons Slide Ppt Infographic Template Example Topics PDF
Help your business to create an attention grabbing presentation using our big data analytics icons slide ppt infographic template example topics pdf set of slides. The slide contains innovative icons that can be flexibly edited. Choose this big data analytics icons slide ppt infographic template example topics pdf template to create a satisfactory experience for your customers. Go ahead and click the download button.
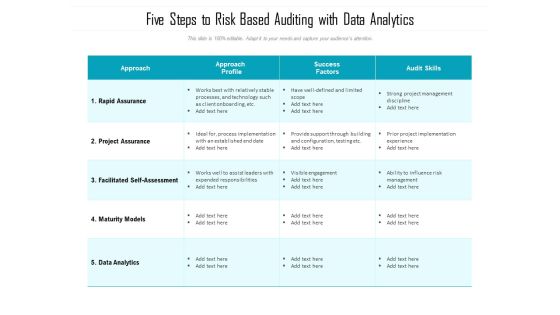
Five Steps To Risk Based Auditing With Data Analytics Ppt PowerPoint Presentation File Grid PDF
Showcasing this set of slides titled five steps to risk based auditing with data analytics ppt powerpoint presentation file grid pdf. The topics addressed in these templates are data analytics, implementation, management. All the content presented in this PPT design is completely editable. Download it and make adjustments in color, background, font etc. as per your unique business setting.
Magnifier Glass Ppt PowerPoint Presentation Example
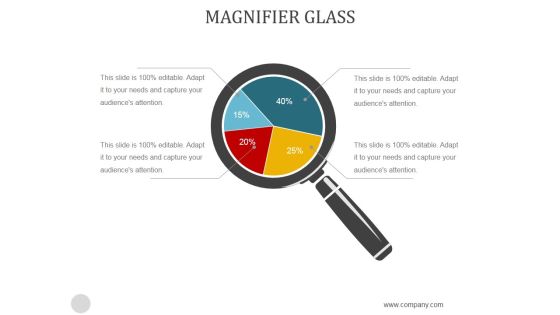
This is a magnifier glass ppt powerpoint presentation example. This is a four stage process. The stages in this process are magnifier, searching, strategy, analysis, business.

Personnel Performance Kpis Scorecard For Assessing Individual Results Slides PDF
Showcasing this set of slides titled Personnel Performance Kpis Scorecard For Assessing Individual Results Slides PDF. The topics addressed in these templates are Employee, Target, Invoice Number, Outcome. All the content presented in this PPT design is completely editable. Download it and make adjustments in color, background, font etc. as per your unique business setting.

Retail Outlet OGSM Model Strategy With Major Kpis Diagrams PDF
Showcasing this set of slides titled Retail Outlet OGSM Model Strategy With Major Kpis Diagrams PDF. The topics addressed in these templates are Develop Production, Lines As Industry, Leaders. All the content presented in this PPT design is completely editable. Download it and make adjustments in color, background, font etc. as per your unique business setting.

Projects Data Quality Kpis Metrics Comparative Assessment Guidelines PDF
Pitch your topic with ease and precision using this Projects Data Quality Kpis Metrics Comparative Assessment Guidelines PDF. This layout presents information on Business Relevance, Value Related, Methods Related. It is also available for immediate download and adjustment. So, changes can be made in the color, design, graphics or any other component to create a unique layout.

Metrics Icon Showcasing Change Management Kpis Designs PDF
Showcasing this set of slides titled Metrics Icon Showcasing Change Management Kpis Designs PDF The topics addressed in these templates are Metrics, Showcasing Change, Management. All the content presented in this PPT design is completely editable. Download it and make adjustments in color, background, font etc. as per your unique business setting.

Third Party Vendors Risk Metrics Performance Indicators Dashboard Topics PDF
This slide illustrates graphical representation of risk key performance indicators. It includes third party vendors trust score, impact score and risk score. Pitch your topic with ease and precision using this Third Party Vendors Risk Metrics Performance Indicators Dashboard Topics PDF. This layout presents information on Third Party Vendors Risk Metrics Performance Indicators Dashboard. It is also available for immediate download and adjustment. So, changes can be made in the color, design, graphics or any other component to create a unique layout.

Dashboard For Email Communication Kpis Metrics Topics PDF
This slide showcases email communication KPIs and dashboard that can help to keep track of performance of email marketing campaign. Its key elements are number of campaign, total recipients, average open percent and average click percent. Showcasing this set of slides titled Dashboard For Email Communication Kpis Metrics Topics PDF. The topics addressed in these templates are Number Campaigns, Total Recipients, Engagement Distribution. All the content presented in this PPT design is completely editable. Download it and make adjustments in color, background, font etc. as per your unique business setting.

Customer Success And Satisfaction KPIS Dashboard Ppt PowerPoint Presentation Outline Visuals PDF
This slide covers dashboard for estimation of customer satisfaction with success metrics. It includes KPIs such as average CSAT, average response time , service level agreement compliance, top companys accounts, etc. Pitch your topic with ease and precision using this Customer Success And Satisfaction KPIS Dashboard Ppt PowerPoint Presentation Outline Visuals PDF. This layout presents information on Customer Success, Satisfaction KPIs Dashboard. It is also available for immediate download and adjustment. So, changes can be made in the color, design, graphics or any other component to create a unique layout.

Big Data Analytics Industrial Process Technology For Industrial Development Graphics PDF
Showcasing this set of slides titled Big Data Analytics Industrial Process Technology For Industrial Development Graphics PDF. The topics addressed in these templates are Industrial Process Technology, Industrial Development . All the content presented in this PPT design is completely editable. Download it and make adjustments in color, background, font etc. as per your unique business setting.
Firm Data Collection Flowchart For Analysis Template PDF
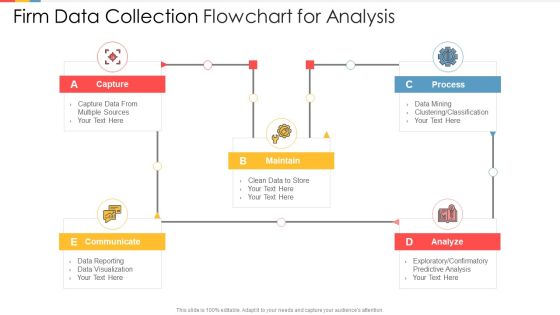
Showcasing this set of slides titled firm data collection flowchart for analysis template pdf. The topics addressed in these templates are capture, maintain, communicate, analyze, process. All the content presented in this PPT design is completely editable. Download it and make adjustments in color, background, font etc. as per your unique business setting.

Data Protection Regulations Risk Assessment And Solution Model Ppt PowerPoint Presentation Infographic Template Skills PDF
Showcasing this set of slides titled data protection regulations risk assessment and solution model ppt powerpoint presentation infographic template skills pdf. The topics addressed in these templates are process, technolog, project management, weaknesses network, systems, train workshops, analysis, inventory. All the content presented in this PPT design is completely editable. Download it and make adjustments in color, background, font etc. as per your unique business setting.

Customer Relationship Management Dashboard Data Mining In CRM Graphics PDF
Deliver an awe inspiring pitch with this creative customer relationship management dashboard data mining in crm graphics pdf bundle. Topics like customer identification, differentiation and interaction, retain and attract profitable customers, offer customized solutions and motivation action can be discussed with this completely editable template. It is available for immediate download depending on the needs and requirements of the user.

Customer Lifetime Value Based Success KPIS Dashboard Ppt PowerPoint Presentation Layouts Gridlines PDF
This slide covers dashboard for estimation of customer lifetime value as success metrics. It includes KPIs such as customer lifetime value, customer lifetime period, customer risk, customer contact rate, customer retention costs, average lifetime value, customer churn rate, average revenue per account, etc. Pitch your topic with ease and precision using this Customer Lifetime Value Based Success KPIS Dashboard Ppt PowerPoint Presentation Layouts Gridlines PDF. This layout presents information on Average Revenue, Customer Lifetime, Customer Risk. It is also available for immediate download and adjustment. So, changes can be made in the color, design, graphics or any other component to create a unique layout.

Dashboard To Track Kpis In Project Launch Strategy Pictures PDF
The following slide brings forth a dashboard to track important key performance indicators in a project rollout strategy with the purpose of tracking projects in real time with live data. The KPIs are tasks, progress, time, cost and workload. Showcasing this set of slides titled Dashboard To Track Kpis In Project Launch Strategy Pictures PDF. The topics addressed in these templates are Expenses, Project Launch Strategy, Dashboard To Track Kpis. All the content presented in this PPT design is completely editable. Download it and make adjustments in color, background, font etc. as per your unique business setting.
Keywords Performance Data Mining And Analysis Dashboard Microsoft PDF
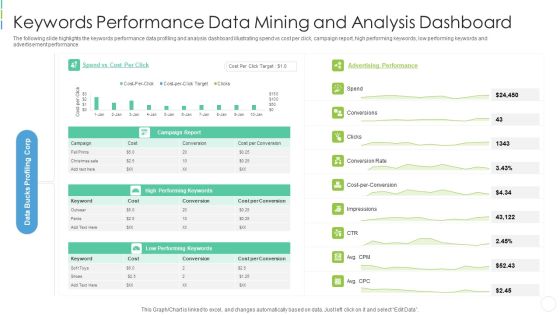
The following slide highlights the keywords performance data profiling and analysis dashboard illustrating spend vs cost per click, campaign report, high performing keywords, low performing keywords and advertisement performance Showcasing this set of slides titled keywords performance data mining and analysis dashboard microsoft pdf . The topics addressed in these templates are keywords performance data mining and analysis dashboard . All the content presented in this PPT design is completely editable. Download it and make adjustments in color, background, font etc. as per your unique business setting.

Stock Photo Yellow Colored Maze PowerPoint Slide
This image slide displays graphic of maze with arrow leading to euro symbol. Use this image slide, in your presentations to express views on challenges, goals, targets, solution and success. This image may also be used to depict strategic business management. This image slide will enhance the quality of your presentations.
