Business Model Wealth Management
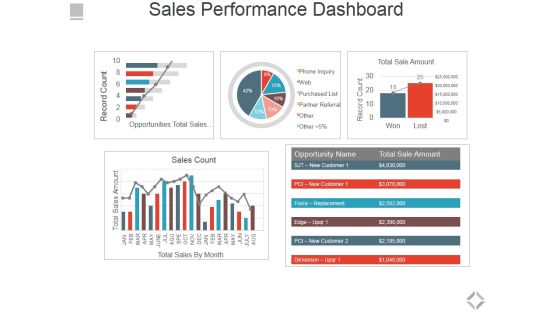
Sales Performance Dashboard Ppt PowerPoint Presentation File Graphics Pictures
This is a sales performance dashboard ppt powerpoint presentation file graphics pictures. This is a five stage process. The stages in this process are total sales by month, sales count, opportunities total sales by probability, total sale amount.

Balance Sheet Kpis Tabular Form Ppt PowerPoint Presentation Outline Background Image
This is a balance sheet kpis tabular form ppt powerpoint presentation outline background image. This is a four stage process. The stages in this process are current assets, current liabilities, total assets, total liabilities.

Conversion Rate Template 1 Ppt PowerPoint Presentation Visual Aids Files
This is a conversion rate template 1 ppt powerpoint presentation visual aids files. This is a two stage process. The stages in this process are net revenue gross revenue from last year.

Volume High Low Close Chart Ppt PowerPoint Presentation Ideas Background Images
This is a volume high low close chart ppt powerpoint presentation ideas background images. This is a five stage process. The stages in this process are volume, high, low, close.

Market Dynamics Ppt PowerPoint Presentation Slides
This is a market dynamics ppt powerpoint presentation slides. This is a five stage process. The stages in this process are market dynamics, economic outlook, contingency , plan, market opportunity description, competitive landscape.
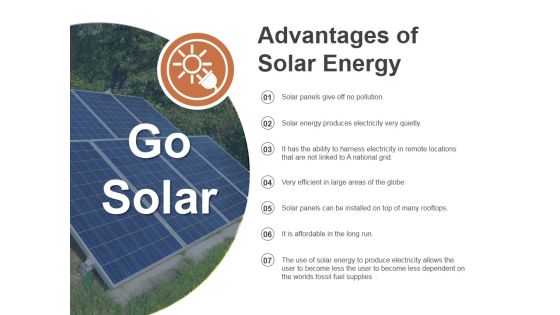
Go Solar Ppt PowerPoint Presentation Pictures Designs Download
This is a go solar ppt powerpoint presentation pictures designs download. This is a seven stage process. The stages in this process are solar panels give off no pollution, solar energy produces electricity very quietly, very efficient in large areas of the globe, solar panels can be installed on top of many rooftops.
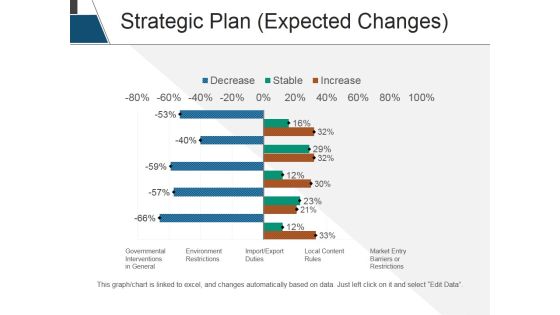
Strategic Plan Expected Changes Ppt PowerPoint Presentation Pictures Vector
This is a strategic plan expected changes ppt powerpoint presentation pictures vector. This is a two stage process. The stages in this process are government interventions in general, environment restrictions, import export duties, local content rules, market entry barriers or restrictions.
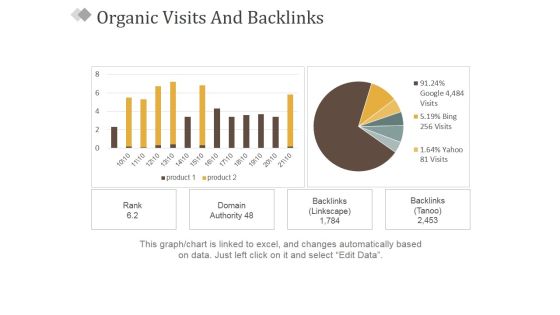
Organic Visits And Backlinks Ppt PowerPoint Presentation Styles Smartart
This is a organic visits and backlinks ppt powerpoint presentation styles smartart. This is a two stage process. The stages in this process are rank, domain, backlinks, backlinks.
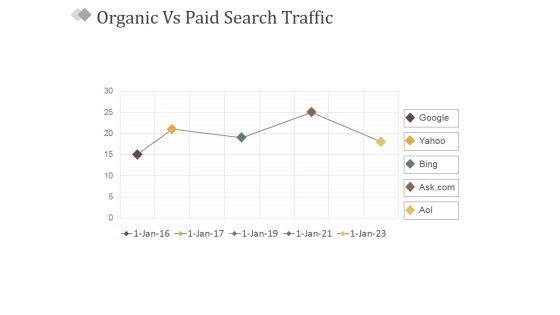
Organic Vs Paid Search Traffic Ppt PowerPoint Presentation Ideas Inspiration
This is a organic vs paid search traffic ppt powerpoint presentation ideas inspiration. This is a one stage process. The stages in this process are google, yahoo, bing, aol.
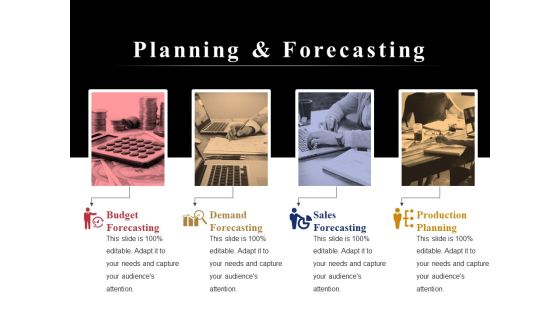
Planning And Forecasting Ppt PowerPoint Presentation Infographic Template Graphics Tutorials
This is a planning and forecasting ppt powerpoint presentation infographic template graphics tutorials. This is a four stage process. The stages in this process are budget forecasting, demand forecasting, sales forecasting, production planning.
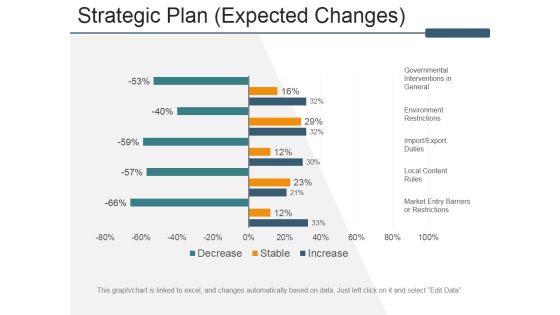
Strategic Plan Expected Changes Ppt PowerPoint Presentation Outline Graphics Tutorials
This is a strategic plan expected changes ppt powerpoint presentation outline graphics tutorials. This is a two stage process. The stages in this process are governmental interventions in general, environment restrictions, import export duties, local content rules, market entry barriers or restrictions.
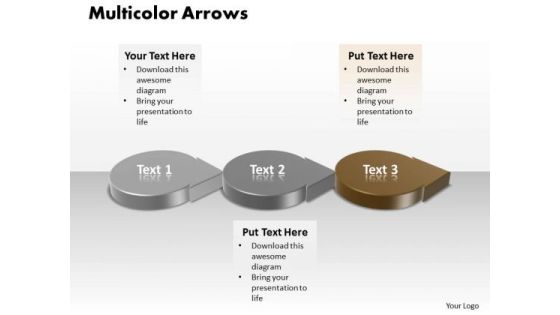
Ppt 3d Circular Arrows PowerPoint 2010 Showing Brown Stage Templates
PPT 3d circular arrows powerpoint 2010 showing brown stage Templates-Diagrams for PowerPoint Circle arrow offer an elegant alternative to the boring bullet points used in Presentations. You can portray specific models like Analyze, Plan, Implement and Review model, Waterfall model or any other customized processes.-PPT 3d circular arrows powerpoint 2010 showing brown stage Templates-arrow, black, blue, bright, brown, button, cartography, circle, direction, fuchsia, glossy, green, icon, indicator, internet, light, map, modern, multicolor, nautical, navigation, orientation, pink, pointer, round, set, shadow, shiny, simple, star, vector

Budgeting Planned Actual Comparison Ppt PowerPoint Presentation Shapes
This is a budgeting planned actual comparison ppt powerpoint presentation shapes. This is a three stage process. The stages in this process are planned cost, actual cost, value difference, finance, timeline.

Shareholders Fund And Market Cap Ppt PowerPoint Presentation Layouts Aids
This is a shareholders fund and market cap ppt powerpoint presentation layouts aids. This is a five stage process. The stages in this process are shareholders funds, market capitalization, market capitalization as a percentage of cse market capitalization.
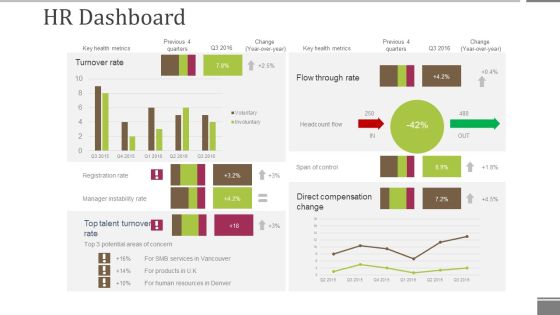
Hr Dashboard Template 2 Ppt PowerPoint Presentation File Grid
This is a hr dashboard template 2 ppt powerpoint presentation file grid. This is a four stage process. The stages in this process are turnover rate, direct compensation change, span of control, headcount flow, flow through rate.

Product Strategy And Road Mapping Diagram Powerpoint Images
This is a product strategy and road mapping diagram powerpoint images. This is a five stage process. The stages in this process are general market knowledge, development technologies, process, sales and support, marketing incl product launch, vision and leadership, strategy and market research, ux and product backlog, business model and financials, product roadmap, release management, product lifecycle management.

Bar Chart Ppt PowerPoint Presentation Professional Files
This is a bar chart ppt powerpoint presentation professional files. This is a seven stage process. The stages in this process are bar chart, product, sales in percentage, financial years.
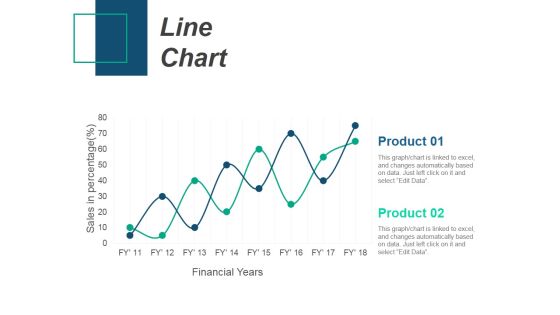
Line Chart Ppt PowerPoint Presentation Infographic Template Introduction
This is a line chart ppt powerpoint presentation infographic template introduction. This is a two stage process. The stages in this process are product, sales in percentage, financial years, line chart.
Line Chart Ppt PowerPoint Presentation Infographic Template Icons
This is a line chart ppt powerpoint presentation infographic template icons. This is a two stage process. The stages in this process are sales in percentage, financial years, product, line chart.
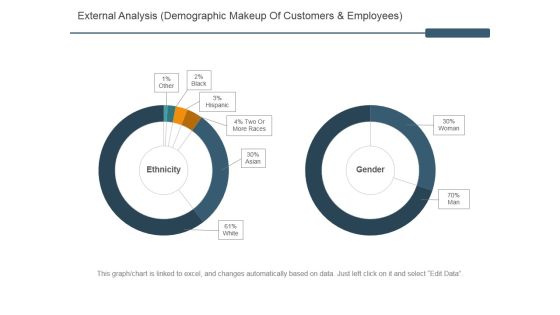
External Analysis Ppt PowerPoint Presentation Infographics Information
This is a external analysis ppt powerpoint presentation infographics information. This is a seven stage process. The stages in this process are education, police, hm forces, local government, civil service.
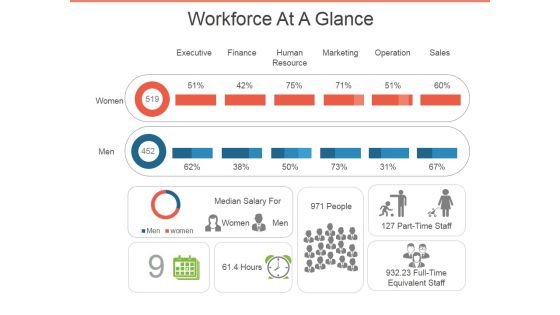
Workforce At A Glance Ppt PowerPoint Presentation Infographic Template Topics
This is a workforce at a glance ppt powerpoint presentation infographic template topics. This is a eight stage process. The stages in this process are executive, finance, human resource, marketing, operation, sales.
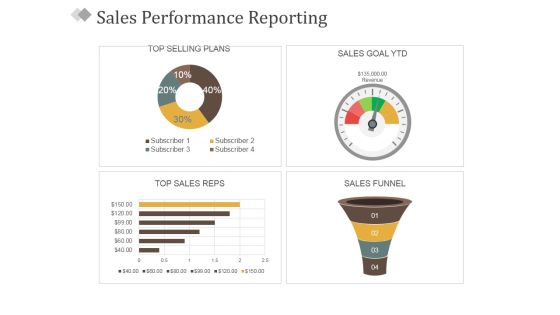
Sales Performance Reporting Ppt PowerPoint Presentation Ideas Aids
This is a sales performance reporting ppt powerpoint presentation ideas aids. This is a four stage process. The stages in this process are top selling plans, sales goal ytd, top sales reps, sales funnel.

Stock Chart Ppt PowerPoint Presentation Guidelines
This is a stock chart ppt powerpoint presentation guidelines. This is a five stage process. The stages in this process are high, volume, low, close.

Stock Chart Ppt PowerPoint Presentation Backgrounds
This is a stock chart ppt powerpoint presentation backgrounds. This is a five stage process. The stages in this process are high, volume, low, close.
Stacked Bar Ppt PowerPoint Presentation Icon Styles
This is a stacked bar ppt powerpoint presentation icon styles. This is a seven stage process. The stages in this process are unit count, months, product, shared values.
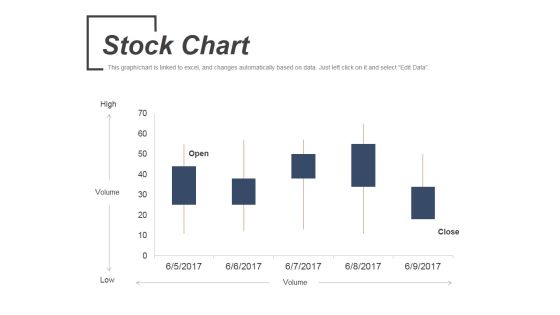
Stock Chart Ppt PowerPoint Presentation Ideas Topics
This is a stock chart ppt powerpoint presentation ideas topics. This is a five stage process. The stages in this process are volume, low, high, open, close.
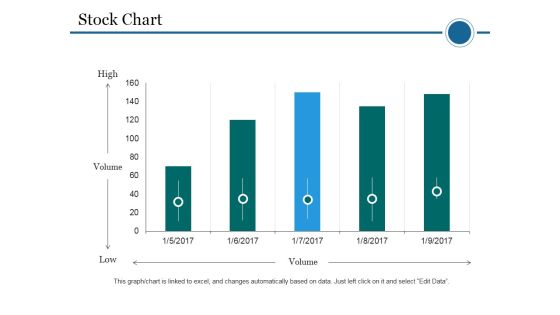
Stock Chart Ppt PowerPoint Presentation Professional Vector
This is a stock chart ppt powerpoint presentation professional vector. This is a five stage process. The stages in this process are stock chart, volume, high, low.

Area Chart Ppt PowerPoint Presentation Inspiration Images
This is a area chart ppt powerpoint presentation inspiration images. This is a two stage process. The stages in this process are area chart, product, sales in percentage.
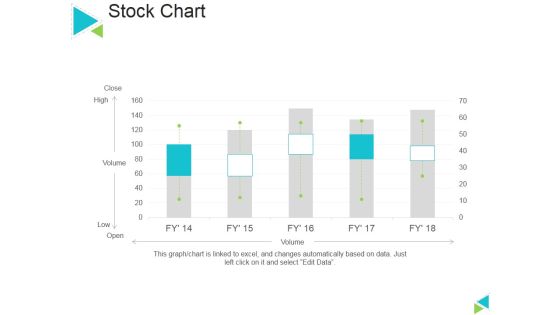
Stock Chart Ppt PowerPoint Presentation Ideas Slideshow
This is a stock chart ppt powerpoint presentation ideas slideshow. This is a five stage process. The stages in this process are stock chart, close, volume, open.

Attribute Listing Technique Ppt PowerPoint Presentation Microsoft
This is a attribute listing technique ppt powerpoint presentation microsoft. This is a three stage process. The stages in this process are features, attributes, alternatives, material used, lead material, shape, special features.
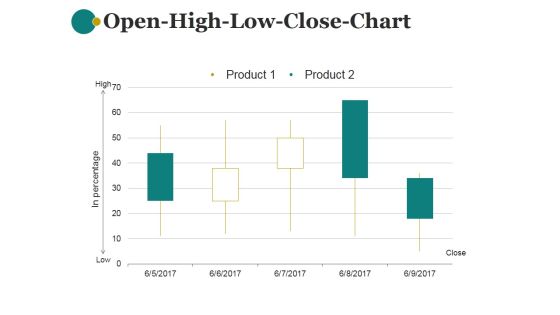
Open High Low Close Chart Ppt PowerPoint Presentation Information
This is a open high low close chart ppt powerpoint presentation information. This is a five stage process. The stages in this process are product, in percentage, close, low, high.

Sales Dashboard Template 2 Ppt PowerPoint Presentation Introduction
This is a sales dashboard template 2 ppt powerpoint presentation introduction. This is a four stage process. The stages in this process are total sales by month, lead sources revenue share, win loss ratio, opportunities total sales by probability.
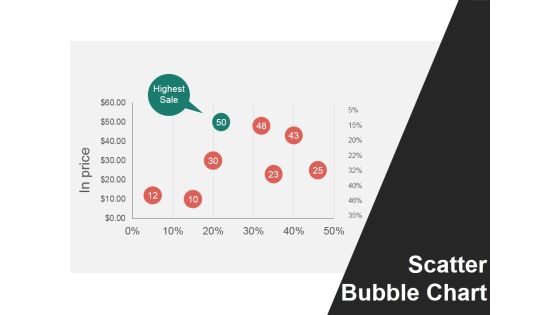
Scatter Bubble Chart Ppt PowerPoint Presentation Show Infographic Template
This is a scatter bubble chart ppt powerpoint presentation show infographic template. This is a six stage process. The stages in this process are in price, scatter bubble chart, highest sale.

Customer Service Bench Marketing Ppt PowerPoint Presentation Professional Summary
This is a customer service bench marketing ppt powerpoint presentation professional summary. This is a five stage process. The stages in this process are very poor, poor, good, excellent.

Advertising Spent On Different Mediums Ppt PowerPoint Presentation Background Images
This is a advertising spent on different mediums ppt powerpoint presentation background images. This is a five stage process. The stages in this process are print, radio, tv, internet, media.
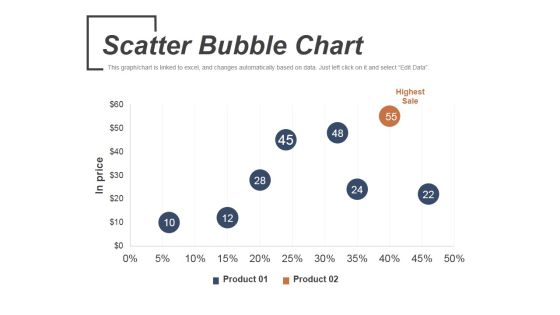
Scatter Bubble Chart Ppt PowerPoint Presentation Infographic Template Graphics
This is a scatter bubble chart ppt powerpoint presentation infographic template graphics. This is a two stage process. The stages in this process are highest sale, product, in price.
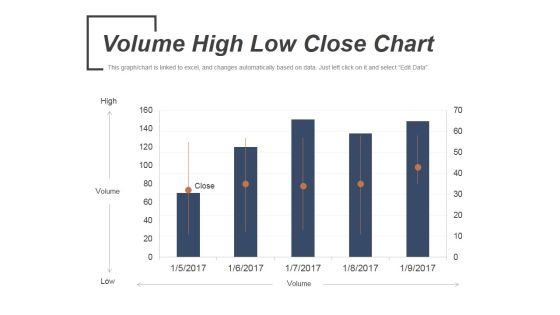
Volume High Low Close Chart Ppt PowerPoint Presentation Slides Portrait
This is a volume high low close chart ppt powerpoint presentation slides portrait. This is a five stage process. The stages in this process are volume, low, high, open, close.

Area Chart Ppt PowerPoint Presentation Infographics Graphics Tutorials
This is a area chart ppt powerpoint presentation infographics graphics tutorials. This is a two stage process. The stages in this process are product, area chart, sales in percentage.

Current Staff Profile Years Of Experience Needs Ppt PowerPoint Presentation Layouts Influencers
This is a current staff profile years of experience needs ppt powerpoint presentation layouts influencers. This is a four stage process. The stages in this process are years of experience of hospital staff, percentage of staff, staff types, least experience.

Pipeline Quality Template 2 Ppt PowerPoint Presentation Inspiration Show
This is a pipeline quality template 2 ppt powerpoint presentation inspiration show. This is a one stage process. The stages in this process are sales stage, opportunity age, pipeline, quality, line chart.

Sales Team Target And Achievement Ppt PowerPoint Presentation Pictures Deck
This is a sales team target and achievement ppt powerpoint presentation pictures deck. This is a four stage process. The stages in this process are john allen, anita smith, peter smith, mary smith.
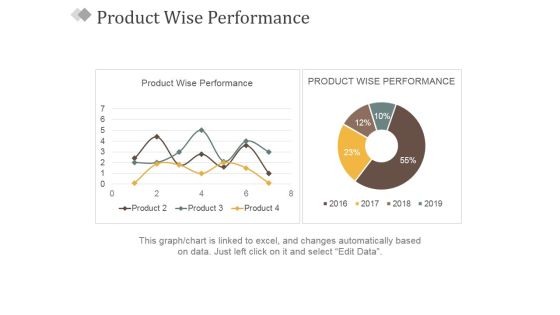
Product Wise Performance Ppt PowerPoint Presentation Slides Professional
This is a product wise performance ppt powerpoint presentation slides professional. This is a two stage process. The stages in this process are product wise performance, product wise performance.

Web Traffic Insights Ppt PowerPoint Presentation Pictures Slides
This is a web traffic insights ppt powerpoint presentation pictures slides. This is a five stage process. The stages in this process are engagement in july, avg page views, global rank, country rank, category rank, bounce rate.

Book Value Per Share Pat Ppt PowerPoint Presentation Ideas Influencers
This is a book value per share pat ppt powerpoint presentation ideas influencers. This is a one stage process. The stages in this process are book value per share, total equity, total outstanding shares.
Employee Turnover Ppt PowerPoint Presentation Gallery Icons
This is a employee turnover ppt powerpoint presentation gallery icons. This is a one stage process. The stages in this process are turnover, rate, number of employee separations during the year, total number of employees during the year.

Cost For Quality Graph Ppt PowerPoint Presentation Ideas Files
This is a cost for quality graph ppt powerpoint presentation ideas files. This is a four stage process. The stages in this process are external failure, internal failure, prevention, appraisal, quality improvement.

Cost Of Employee Turnover Ppt PowerPoint Presentation Infographic Template Example Introduction
This is a cost of employee turnover ppt powerpoint presentation infographic template example introduction. This is a two stage process. The stages in this process are cost of hiring a new employee, lost productivity and engagement, expense to onboard and train new employee, customer service issue and errors, impact on workplace culture.
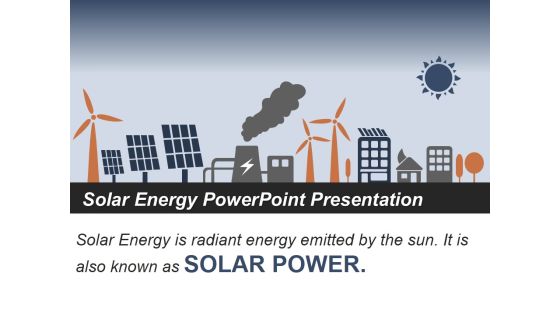
Solar Energy PowerPoint Presentation Ppt PowerPoint Presentation Ideas Slideshow
This is a solar energy powerpoint presentation ppt powerpoint presentation ideas slideshow. This is a one stage process. The stages in this process are solar, energy, solar power.
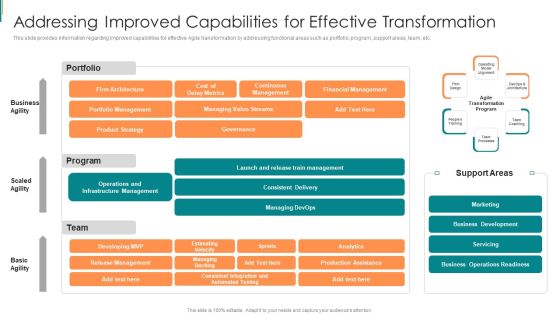
Product Development Using Agile Addressing Improved Capabilities For Effective Transformation Formats PDF
This slide provides information regarding improved capabilities for effective Agile transformation by addressing functional areas such as portfolio, program, support areas, team, etc. Deliver an awe inspiring pitch with this creative Product Development Using Agile Addressing Improved Capabilities For Effective Transformation Formats PDF bundle. Topics like Infrastructure Management, Financial Management, Continuous Management can be discussed with this completely editable template. It is available for immediate download depending on the needs and requirements of the user.
Exit Strategy Ppt PowerPoint Presentation Icon Clipart Images
This is a exit strategy ppt powerpoint presentation icon clipart images. This is a three stage process. The stages in this process are acquisition, financial buyer, ipo.

Development In Past 10 Year Template 2 Ppt PowerPoint Presentation Infographic Template Example
This is a development in past 10 year template 2 ppt powerpoint presentation infographic template example. This is a ten stage process. The stages in this process are other income, net sales, ebita margins, taxes, financial result.

Three Lines Of Defense Border For Large Financial Institutions Guidelines PDF
This slide represents the lines of defense model for the large financial institutions brokerage line of business. It includes details related to board risk committee, management risk committee and the roles performed by the first, second and third line of defense. Presenting Three Lines Of Defense Border For Large Financial Institutions Guidelines PDF to dispense important information. This template comprises three stages. It also presents valuable insights into the topics including Risk Committee, Institutions, Defense. This is a completely customizable PowerPoint theme that can be put to use immediately. So, download it and address the topic impactfully.

Four Circles Chart Financial Growth Steps Powerpoint Slides
Our professionally designed business diagram is as an effective tool for communicating cyclic processes. It contains circular graphics with icons. Above slide is suitable to display process management steps.
Six Steps Circular Chart With Icons Powerpoint Slides
This PowerPoint template has been designed with six steps circular chart with icons. This PPT slide may be used to display business and management functions. Download this slide to build unique presentation.
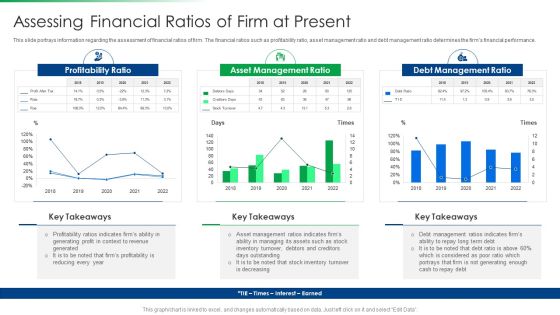
Strawman Project Action Plan Assessing Financial Ratios Of Firm At Present Information PDF
This slide portrays information regarding the assessment of financial ratios of firm. The financial ratios such as profitability ratio, asset management ratio and debt management ratio determines the firms financial performance. Deliver and pitch your topic in the best possible manner with this strawman project action plan assessing financial ratios of firm at present information pdf. Use them to share invaluable insights on profitability ratio, asset management ratio, debt management ratio and impress your audience. This template can be altered and modified as per your expectations. So, grab it now.

Role Of Product Owner Example Of Ppt
This is a role of product owner example of ppt. This is a seven stage process. The stages in this process are vision and leadership, strategy and market research, business model and financials, product roadmap, release management, ux and product backlog, product lifecycle management.
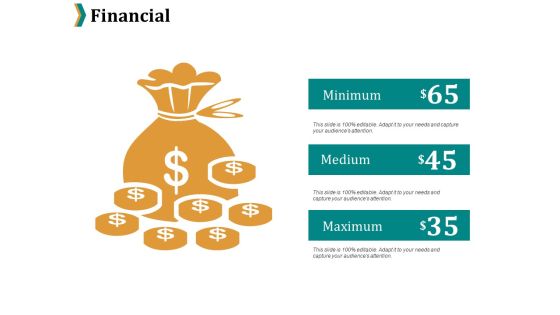
Financial Ppt PowerPoint Presentation Portfolio Picture
This is a financial ppt powerpoint presentation portfolio picture. This is a three stage process. The stages in this process are financial, business, marketing, investment.

Ppt Successive Illustration Of 9 Concepts PowerPoint Templates
PPT successive illustration of 9 concepts PowerPoint Templates-This Diagram helps you to portray specific models like Analyze, Plan, Implement and Review model or any other customized processes. This PPT slide is an effective way of displaying information. You can edit text, color, shade and style as per you need.-PPT successive illustration of 9 concepts PowerPoint Templates-Linear, Flow, Arrow, Background, Process, Business, Chart, Diagram, Financial, Graphic, Gray, Icon, Illustration, Management, Orange, Perspective, Process, Reflection, Stage, Spheres, Text,
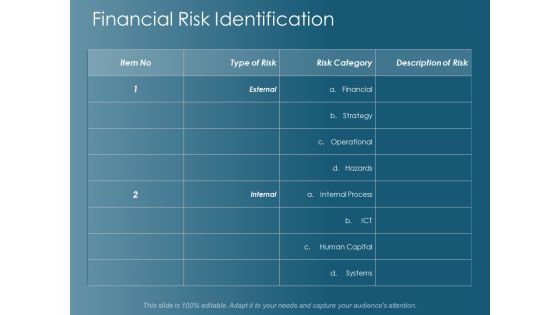
Financial Risk Identification Ppt Powerpoint Presentation Infographics Templates
This is a financial risk identification ppt powerpoint presentation infographics templates. This is a two stage process. The stages in this process are business, management, planning, strategy, marketing.

Annual Planning Calendar Diagram Powerpoint Guide
This is a annual planning calendar diagram powerpoint guide. This is a six stage process. The stages in this process are strategic management model, managing profit and performance, product service, values mission vision, external environment, financial objectives.

 Home
Home