Business Model Wealth Management

Area Chart Percentage Ppt PowerPoint Presentation Portfolio Pictures
This is a area chart percentage ppt powerpoint presentation portfolio pictures. This is a three stage process. The stages in this process are area chart, finance, marketing, management, investment.
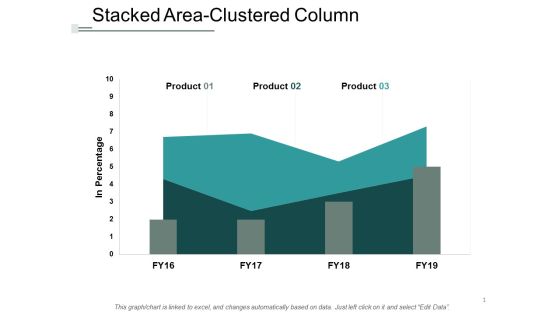
Stacked Area Clustered Column Ppt Powerpoint Presentation Portfolio Graphics Template
This is a stacked area clustered column ppt powerpoint presentation portfolio graphics template. This is a three stage process. The stages in this process are finance, marketing, management, investment, analysis.
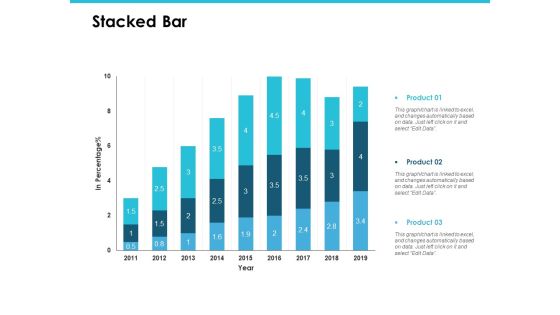
Stacked Bar Finance Marketing Ppt PowerPoint Presentation Portfolio Graphics Pictures
This is a stacked bar finance marketing ppt powerpoint presentation portfolio graphics pictures. This is a three stage process. The stages in this process are finance, marketing, management, investment, analysis.

Financial Performance Key Trends Ppt PowerPoint Presentation Portfolio Rules
Presenting this set of slides with name financial performance key trends ppt powerpoint presentation portfolio rules. This is a seven stage process. The stages in this process are process, business, management, planning, strategy. This is a completely editable PowerPoint presentation and is available for immediate download. Download now and impress your audience.

Column Chart Analysis Ppt PowerPoint Presentation Icon Structure
This is a column chart analysis ppt powerpoint presentation icon structure. This is a three stage process. The stages in this process are column chart, finance, marketing, management, investment.

Financial Transformation Program RACI Matrix For Resource Digital Transformation Toolkit Accounting Finance Background PDF
In this slide, we have demonstrated how the roles and responsibilities to be assigned to different employee for effectively executing the task by applying responsible, accountable, consulted, informed RACI matrix This is a financial transformation program raci matrix for resource digital transformation toolkit accounting finance background pdf template with various stages. Focus and dispense information on four stages using this creative set, that comes with editable features. It contains large content boxes to add your information on topics like financial transformation program raci matrix for resource management. You can also showcase facts, figures, and other relevant content using this PPT layout. Grab it now.

Project Work Plan Ppt PowerPoint Presentation Infographic Template Slides
This is a project work plan ppt powerpoint presentation infographic template slides. This is a six stage process. The stages in this process are finance, marketing, management, investment, analysis.

Sales Performance Of Competitors Ppt PowerPoint Presentation Portfolio Summary
This is a sales performance of competitors ppt powerpoint presentation portfolio summary. This is a three stage process. The stages in this process are business, management, sales, finance, analysis.
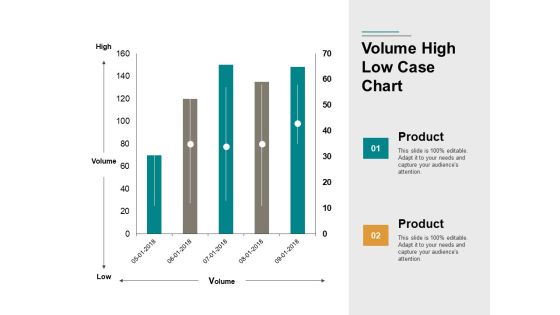
Volume High Low Case Chart Ppt PowerPoint Presentation Portfolio Images
This is a volume high low case chart ppt powerpoint presentation portfolio images. This is a two stage process. The stages in this process are finance, business, marketing, management.
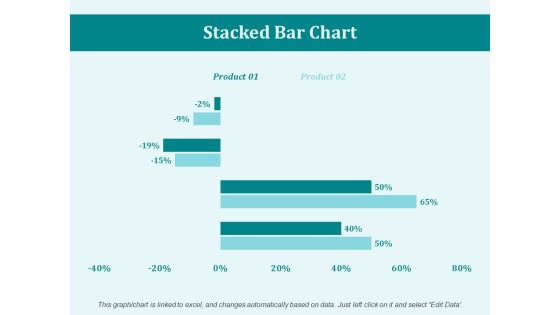
Stacked Bar Chart Percentage Ppt PowerPoint Presentation Portfolio Mockup
This is a stacked bar chart percentage ppt powerpoint presentation portfolio mockup. This is a two stage process. The stages in this process are business, marketing, management, percentage, product.

8 Colorful Diverging Sections Forming A Circle Gear Chart PowerPoint Slides
We present our 8 colorful diverging sections forming a circle Gear Chart PowerPoint Slides.Download and present our Leadership PowerPoint Templates because our templates illustrates your ability. Present our Arrows PowerPoint Templates because you can outline your targets to your team. Download and present our Process and Flows PowerPoint Templates because it helps to anticipate the doubts and questions in the minds of your colleagues and enlighten them with your inspired strategy to garner desired success. Download and present our Business PowerPoint Templates because you have had your share of being a goldfish in a small bowl.you are ready to launch out and spread your wings. Use our Circle Charts PowerPoint Templates because generation of sales is the core of any business.Use these PowerPoint slides for presentations relating to Agreeable, Agreeableness, Art, Blue, Business, Chart, Circle, Clip, Clipart, Conscientiousness, Diagram, Extraversion, Factor, Five, Flow, Graph, Graphic, Green, Illustration, Model, Neuroticism, Openness, Personality, Pointed, Process, Psychological, Psychology, Red, Segment, Segmented, Shape. The prominent colors used in the PowerPoint template are Blue, Gray, Black. PowerPoint presentation experts tell us our 8 colorful diverging sections forming a circle Gear Chart PowerPoint Slides are Zippy. People tell us our Art PowerPoint templates and PPT Slides are No-nonsense. People tell us our 8 colorful diverging sections forming a circle Gear Chart PowerPoint Slides help you meet deadlines which are an element of today's workplace. Just browse and pick the slides that appeal to your intuitive senses. Presenters tell us our Chart PowerPoint templates and PPT Slides are Tasteful. Customers tell us our 8 colorful diverging sections forming a circle Gear Chart PowerPoint Slides are Dazzling. The feedback we get is that our Chart PowerPoint templates and PPT Slides are Energetic.

Clustered Bar Chart Percentage Product Ppt PowerPoint Presentation Portfolio Example Introduction
This is a clustered bar chart percentage product ppt powerpoint presentation portfolio example introduction. This is a three stage process. The stages in this process are area chart, finance, marketing, management, investment.
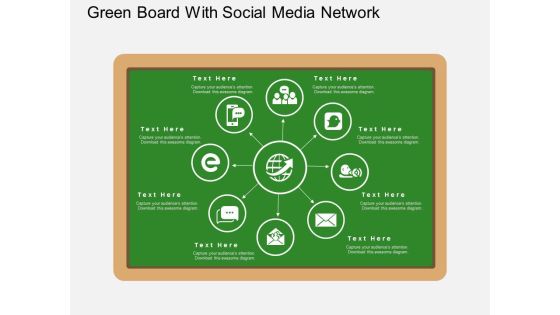
Green Board With Social Media Network PowerPoint Template
The feeling of a being a student makes everyone feel young and energetic. You too can make your audience feel so by including this creatively designed PowerPoint template in your presentation. The slide has been created by the designers keeping in mind the attentive and conscientious atmosphere that a classroom has to offer. The board can be edited to carry a chart or details about the subject of your presentation. The slide has a well-defined chart which can explain departments of an organization or products of a process. The included icons were made keeping in mind the unavoidable social media which is now an important factor even for big businesses and corporate houses. The slide can be a perfect fit in presentations meant for student seminars or e-learning educational presentations. It can also be well used to define the role of technology and communication in today?s time. The slide is customizable and you can include relevant information and icons on the board as per your requirement.

Budgeting Planned Actual Comparison Ppt Powerpoint Presentation Slides Outline
This is a budgeting planned actual comparison ppt powerpoint presentation slides outline. This is a three stage process. The stages in this process are finance, marketing, management, investment, analysis.

Product Launch Budget Plan Marketing Ppt Powerpoint Presentation Professional Examples
This is a product launch budget plan marketing ppt powerpoint presentation professional examples. This is a three stage process. The stages in this process are finance, marketing, management, investment, analysis.
Product Launch Budget Plan Ppt Powerpoint Presentation Icon Skills
This is a product launch budget plan ppt powerpoint presentation icon skills. This is a five stage process. The stages in this process are finance, marketing, management, investment, analysis..

Inventory Planning Kpi Dashboard Ppt PowerPoint Presentation Summary Layout Ideas
This is a inventory planning kpi dashboard ppt powerpoint presentation summary layout ideas. This is a two stage process. The stages in this process are finance, marketing, management, investment, analysis.
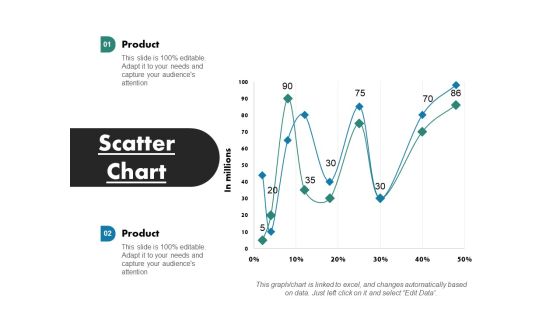
Scatter Chart Ppt PowerPoint Presentation Infographics Designs
This is a scatter chart ppt powerpoint presentation infographics designs. This is a two stage process. The stages in this process are scatter chart, finance, marketing, management, investment, analysis.

Key Techniques To Enhance Cost Efficiency Explore Renewable Alternatives To Enhance Brand USP Ideas PDF
The slide carries various strategies to improve the brands USP for reducing various types of costs such as acquisition cost, marketing expenses, etc. various strategies included are produce green products, use renewable energy sources, recycled packaging materials, etc. This Key Techniques To Enhance Cost Efficiency Explore Renewable Alternatives To Enhance Brand USP Ideas PDF is perfect for any presentation, be it in front of clients or colleagues. It is a versatile and stylish solution for organizing your meetings. The Key Techniques To Enhance Cost Efficiency Explore Renewable Alternatives To Enhance Brand USP Ideas PDF features a modern design for your presentation meetings. The adjustable and customizable slides provide unlimited possibilities for acing up your presentation. Slidegeeks has done all the homework before launching the product for you. So, do not wait, grab the presentation templates today

PowerPoint Template Mechanism Of Four Stages Marketing Linear Flow Process Charts Design
We present our PowerPoint template mechanism of four stages marketing linear flow process charts design. Use our Business PowerPoint Templates because; Refine them all as you take them through the numerous filtering stages of the funnel of your quality control process. Use our Shapes PowerPoint Templates because, to take your team soaring to the pinnacle they crave. Use our Design PowerPoint Templates because, you have the product you are very confident of and are very sure it will prove immensely popular with clients all over your target areas. Use our Signs PowerPoint Templates because, explore the minutest detail of each concept and follow the trail to its conclusion. Use our Process and Flows PowerPoint Templates because, The Venn graphic comprising interlinking circles geometrically demonstrate how various functions operating independently, to a large extent, are essentially interdependent. Use these PowerPoint slides for presentations relating to Abstract, Algorithm, Arrow, Business, Chart, Connection, Design, Development, Diagram, Direction, Element, Flow, Graph, Linear, Linear Diagram, Management, Organization, Plan, Process, Section, Segment, Set, Sign, Solution, Strategy, Symbol, Vector. The prominent colors used in the PowerPoint template are Red, Blue, and Green
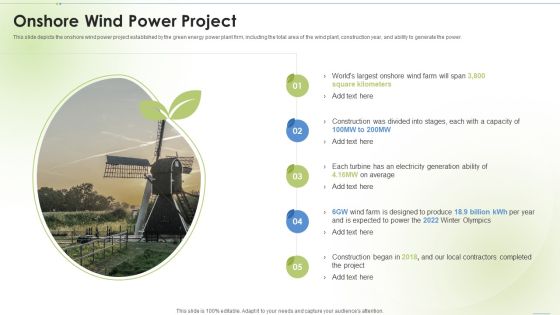
Sustainable Energy Onshore Wind Power Project Ppt PowerPoint Presentation Inspiration Topics PDF
This slide depicts the onshore wind power project established by the green energy power plant firm, including the total area of the wind plant, construction year, and ability to generate the power.Deliver and pitch your topic in the best possible manner with this Sustainable Energy Onshore Wind Power Project Ppt PowerPoint Presentation Inspiration Topics PDF. Use them to share invaluable insights on Square Kilometers, Construction Divided, Designed Produce and impress your audience. This template can be altered and modified as per your expectations. So, grab it now.

Product Launch Budget Plan Ppt PowerPoint Presentation Professional Templates
This is a product launch budget plan ppt powerpoint presentation professional templates. This is a seven stage process. The stages in this process are percentage, finance, marketing, management, business.

Budgeting Planned Actual Comparison Ppt PowerPoint Presentation Visual Aids Gallery
This is a budgeting planned actual comparison ppt powerpoint presentation visual aids gallery. This is a three stage process. The stages in this process are business, management, marketing, percentage, product.

Budgeting Planned Actual Comparison Ppt PowerPoint Presentation Styles File Formats
This is a budgeting planned actual comparison ppt powerpoint presentation styles file formats. This is a three stage process. The stages in this process are product, percentage, business, management, marketing.
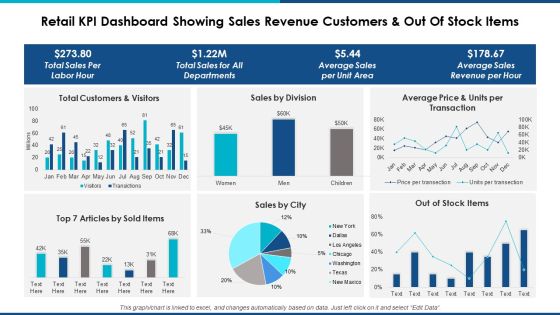
Retail Kpi Dashboard Showing Sales Revenue Customers And Out Of Stock Items Ppt Powerpoint Presentation Professional Background Designs
This is a retail kpi dashboard showing sales revenue customers and out of stock items ppt powerpoint presentation professional background designs. This is a six stage process. The stages in this process are finance, marketing, management, investment, analysis.

Area Chart Finance Ppt PowerPoint Presentation Gallery Background Designs
This is a area chart finance ppt powerpoint presentation gallery background designs. This is a two stage process. The stages in this process are area chart, finance, marketing, management, investment.

Clustered Column Line Ppt PowerPoint Presentation Inspiration Designs Download
This is a clustered column line ppt powerpoint presentation inspiration designs download. This is a two stage process. The stages in this process are finance, marketing, management, investment, analysis.

Bar Graph Finance Ppt PowerPoint Presentation Infographics Designs Download
This is a bar graph finance ppt powerpoint presentation infographics designs download. This is a three stage process. The stages in this process are finance, marketing, management, investment, analysis.

Area Chart Finance Ppt PowerPoint Presentation Summary Design Templates
This is a area chart finance ppt powerpoint presentation summary design templates. This is a two stage process. The stages in this process are finance, marketing, management, investment, analysis.

Stocks Finance Marketing Ppt Powerpoint Presentation Inspiration Graphics Design
This is a stocks finance marketing ppt powerpoint presentation inspiration graphics design. This is a four stage process. The stages in this process are finance, marketing, management, investment, analysis.

Profitability Ratios Finance Marketing Ppt Powerpoint Presentation Inspiration Design Ideas
This is a profitability ratios finance marketing ppt powerpoint presentation inspiration design ideas. This is a two stage process. The stages in this process are finance, marketing, management, investment, analysis.

Stacked Column Chart Analysis Ppt PowerPoint Presentation Slides Graphics Design
This is a stacked column chart analysis ppt powerpoint presentation slides graphics design. This is a three stage process. The stages in this process are finance, marketing, management, investment, analysis.

Comparison Male Female Ppt Powerpoint Presentation Professional Background Designs
This is a comparison male female ppt powerpoint presentation professional background designs. This is a two stage process. The stages in this process are finance, marketing, management, investment, analysis.

Pie Chart Finance Ppt Powerpoint Presentation Layouts Design Ideas
This is a pie chart finance ppt powerpoint presentation layouts design ideas. This is a four stage process. The stages in this process are finance, marketing, management, investment, analysis.

Template 1 Finance Marketing Ppt Powerpoint Presentation File Design Templates
This is a template 1 finance marketing ppt powerpoint presentation file design templates. This is a six stage process. The stages in this process are finance, marketing, management, investment, analysis.

Top Layer Of 3d Pyramid PowerPoint Templates Ppt Slides
Top Layer of 3D Pyramid PowerPoint Templates PPT Slides-These high quality powerpoint pre-designed slides and powerpoint templates have been carefully created by our professional team to help you impress your audience. All slides have been created and are 100% editable in powerpoint. Each and every property of any graphic - color, size, orientation, shading, outline etc. can be modified to help you build an effective powerpoint presentation. Any text can be entered at any point in the powerpoint template or slide. Simply DOWNLOAD, TYPE and PRESENT!-These PowerPoint slides can be used for themes relating to--3d, abstract, background, blocks, business, chart, color, concept, construction, diagram, financial, graph, green, group, growth, hierarchy, icon, illustration, increase, innovation, isolated, level, management, object, orange, part, performance, progress, pyramid, red, reflection, results, shape, sliced, stage, status, step, strategy, structure, success, support, symbol, system, team, teamwork, top, triangle, union, white, yellow

Employee Performance Measurement Kpi Ppt PowerPoint Presentation Inspiration Design Inspiration
This is a employee performance measurement kpi ppt powerpoint presentation inspiration design inspiration. This is a four stage process. The stages in this process are financial, business, management, marketing.
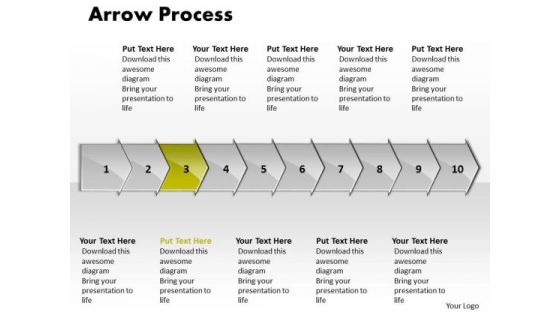
Process PowerPoint Template Arrow 10 Stages Communication Skills Design
We present our process PowerPoint template arrow 10 stages communication skills design. Use our Symbol PowerPoint Templates because, Like your thoughts arrows are inherently precise and true. Use our Metaphor PowerPoint Templates because, At times, however, there is a crucial aspect that requires extra attention. Use our Business PowerPoint Templates because, this slide is an excellent backdrop for you to enlighten your audience on the process you have gone through and the vision you have for the future. Use our Arrows PowerPoint Templates because, you have the ideas to develop the teams vision of where they need to be in the future. Use our Process and Flows PowerPoint Templates because; unravel each one for your audience while setting key timelines as you go along. Use these PowerPoint slides for presentations relating to Arrow, Background, Business, Chart, Diagram, Financial, Graphic, Gray, Icon, Illustration, Management, Orange, Perspective, Planning, Process, Process, Stages, Steps, Text, Transparency. The prominent colors used in the PowerPoint template are Green, Gray, and Black

Sustainable Energy How Does Green Energy Works Ppt PowerPoint Presentation Ideas Tips PDF
This slide depicts how green energy works, derived from sun, wind, and water through different technologies such as solar systems, wind turbines, etc.Deliver and pitch your topic in the best possible manner with this Sustainable Energy How Does Green Energy Works Ppt PowerPoint Presentation Ideas Tips PDF. Use them to share invaluable insights on Frequently Derived, Energy Technologies, Detrimental Influence and impress your audience. This template can be altered and modified as per your expectations. So, grab it now.

Linear Flow Connecting Diverging 9 Arrows Gear Process PowerPoint Templates
We present our linear flow connecting diverging 9 arrows Gear Process PowerPoint templates.Use our Arrows PowerPoint Templates because this diagram depicts the essence of this chain reaction like sequence of events. Present our Success PowerPoint Templates because iT outlines the entire thought process for the benefit of others. Tell it to the world with your characteristic aplomb. Download and present our Signs PowerPoint Templates because you can gain the success to desired levels in one go. Download our Shapes PowerPoint Templates because you should take your team soaring to the pinnacle they crave. Download our Process and Flows PowerPoint Templates because you can come forth with the plans you have so carefully laid out.Use these PowerPoint slides for presentations relating to Abstract, arrow, brochure, business,button, chart, circle, company, cyclic,data, demonstration, diagram,economic, financial, glossy, goal, graph,illustration, info, information, investment,manage, marketing, model, navigation,option, part, pie, presentation, process,result, section, segmented, sharing,sphere. The prominent colors used in the PowerPoint template are Gray, Black, White. People tell us our linear flow connecting diverging 9 arrows Gear Process PowerPoint templates are Enchanting. Customers tell us our business PowerPoint templates and PPT Slides are Stunning. Professionals tell us our linear flow connecting diverging 9 arrows Gear Process PowerPoint templates are Glamorous. Presenters tell us our business PowerPoint templates and PPT Slides are Wistful. Use our linear flow connecting diverging 9 arrows Gear Process PowerPoint templates are Tranquil. Presenters tell us our button PowerPoint templates and PPT Slides will help you be quick off the draw. Just enter your specific text and see your points hit home.

Pie Of Pie Chart Finance Ppt Powerpoint Presentation File Design Templates
This is a pie of pie chart finance ppt powerpoint presentation file design templates. This is a four stage process. The stages in this process are finance, marketing, management, investment, analysis.
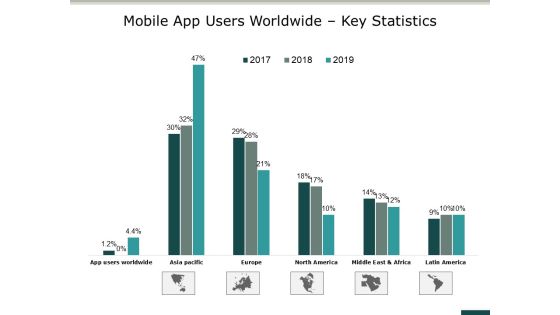
Mobile App Users Worldwide Key Statistics Ppt PowerPoint Presentation File Design Templates
This is a mobile app users worldwide key statistics ppt powerpoint presentation file design templates. This is a three stage process. The stages in this process are finance, marketing, management, investment, analysis.

Search Engine Rankings Ppt PowerPoint Presentation Pictures Designs Download
This is a search engine rankings ppt powerpoint presentation pictures designs download. This is a three stage process. The stages in this process are search engine rankings, finance, marketing, management, business.

Clustered Column Line Ppt PowerPoint Presentation Infographics Graphics Design
This is a clustered column line ppt powerpoint presentation infographics graphics design. This is a three stage process. The stages in this process are finance, marketing, business, analysis, management.

Stacked Area Clustered Column Ppt PowerPoint Presentation Slides Background Designs
This is a stacked area clustered column ppt powerpoint presentation slides background designs. This is a three stage process. The stages in this process are percentage, product, business, management.

Bubble Chart Product Ppt PowerPoint Presentation Inspiration Design Ideas
This is a bubble chart product ppt powerpoint presentation inspiration design ideas. This is a one stage process. The stages in this process are business, management, marketing, product, percentage.
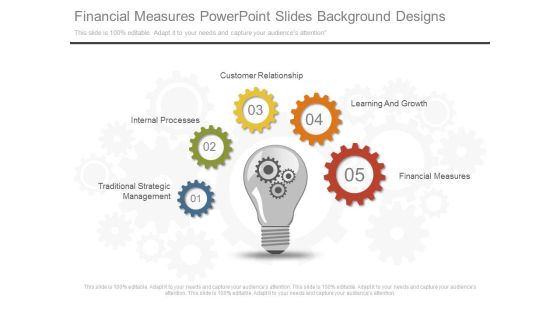
Financial Measures Powerpoint Slides Background Designs
This is a financial measures powerpoint slides background designs. This is a five stage process. The stages in this process are traditional strategic management, internal processes, customer relationship, learning and growth, financial measures.
Financial Income Statement For Sale Proceeds Of Company Ppt PowerPoint Presentation Icon Example PDF
This slide covers companys profit and lost statement derived from sales. It further includes operating expenses, cost of sales, total cost of revenue, net income, etc. Persuade your audience using this Financial Income Statement For Sale Proceeds Of Company Ppt PowerPoint Presentation Icon Example PDF. This PPT design covers two stages, thus making it a great tool to use. It also caters to a variety of topics including Cost Sales, Revenue, Operating Expenses, Amount. Download this PPT design now to present a convincing pitch that not only emphasizes the topic but also showcases your presentation skills.

Us Financial System Along With Regulatory Bodies Ppt Powerpoint Presentation Inspiration Pictures
This is a us financial system along with regulatory bodies ppt powerpoint presentation inspiration pictures. This is a four stage process. The stages in this process are business, management, planning, strategy, marketing.

Financial Statement Analysis P And L Statement Ppt PowerPoint Presentation Professional Slides
This is a financial statement analysis p and l statement ppt powerpoint presentation professional slides. This is a five stage process. The stages in this process are management, marketing, business, strategy, planning.
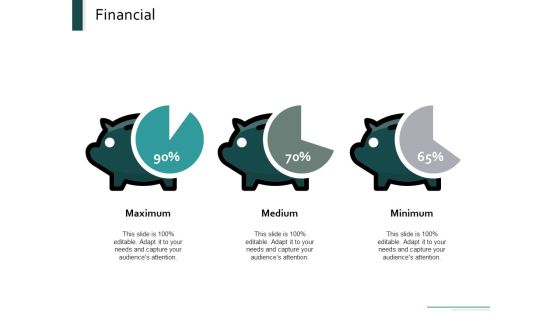
Financial Maximum Medium Minimum Ppt Powerpoint Presentation Portfolio Master Slide
This is a financial maximum medium minimum ppt powerpoint presentation portfolio master slide.This is a three stage process. The stages in this process are financial, maximum, medium, minimum, management.

6 Stages Sequentially Described Chart Technical Support Process Flow Chart PowerPoint Templates
We present our 6 stages sequentially described chart technical support process flow chart PowerPoint templates.Use our Arrows PowerPoint Templates because there are a bucketful of brilliant ideas swirling around within your group. Use our Business PowerPoint Templates because everybody knows The world over it is a priority for many. Along with it there are so many oppurtunities waiting to be utilised. Download and present our Competition PowerPoint Templates because you have a good idea of the roadmap to your desired destination. Use our Design PowerPoint Templates because you should take your team soaring to the pinnacle they crave. Download and present our Shapes PowerPoint Templates because this is An innovative slide design depicting driving home the relevance of a steady rhythm.Use these PowerPoint slides for presentations relating to arrow, arrows, block, business, chart, design, development, diagram, direction, element, flow, flowchart, graph, linear, management, organization, process, program, section, sign, solution, symbol. The prominent colors used in the PowerPoint template are Green, Gray, Black. Professionals tell us our 6 stages sequentially described chart technical support process flow chart PowerPoint templates are Liberated. The feedback we get is that our chart PowerPoint templates and PPT Slides are topically designed to provide an attractive backdrop to any subject. We assure you our 6 stages sequentially described chart technical support process flow chart PowerPoint templates are readymade to fit into any presentation structure. Customers tell us our direction PowerPoint templates and PPT Slides are Whimsical. Presenters tell us our 6 stages sequentially described chart technical support process flow chart PowerPoint templates are Cheerful. People tell us our direction PowerPoint templates and PPT Slides are Endearing.

Cash Flow Statement Kpis Tabular Form Ppt PowerPoint Presentation Styles Design Inspiration
This is a cash flow statement kpis tabular form ppt powerpoint presentation styles design inspiration. This is a four stage process. The stages in this process are finance, analysis, management, business, marketing.
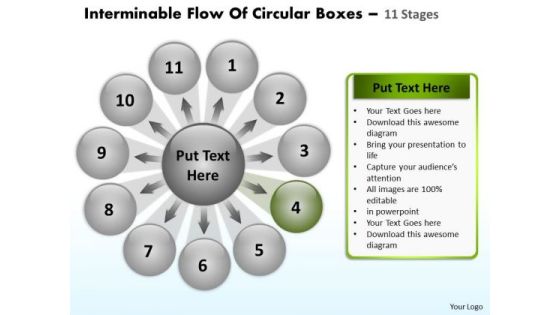
Interminable Flow Of Circular Boxes 11 Stages Venn Network PowerPoint Templates
We present our interminable flow of circular boxes 11 stages Venn Network PowerPoint templates.Download and present our Arrows PowerPoint Templates because you will be able to Highlight these individual targets and the paths to their achievement. Download our Business PowerPoint Templates because you can Lead your flock steadily to greater heights. Look around at the vast potential of achievement around you. Present our Signs PowerPoint Templates because this template contains the material to highlight the key issues of your presentation. Download our Shapes PowerPoint Templates because you can come forth with the plans you have so carefully laid out. Download and present our Spheres PowerPoint Templates because the basic stages are in place, you need to build upon them with our PowerPoint templates.Use these PowerPoint slides for presentations relating to Arrows, Business, Chart, Circular, Commerce, Concept, Contribution, Cycle, Development, Diagram, Global, Idea, Informative, Internet, Join, Making, Manage, Management, Market, Marketing, Partner, Paying, Performance, Plans, Process, Productive, Productivity, Profit, Profitable, Project. The prominent colors used in the PowerPoint template are Green, Black, Gray. Professionals tell us our interminable flow of circular boxes 11 stages Venn Network PowerPoint templates are Royal. You can be sure our Chart PowerPoint templates and PPT Slides are Gorgeous. Customers tell us our interminable flow of circular boxes 11 stages Venn Network PowerPoint templates are Awesome. Professionals tell us our Chart PowerPoint templates and PPT Slides are effectively colour coded to prioritise your plans They automatically highlight the sequence of events you desire. People tell us our interminable flow of circular boxes 11 stages Venn Network PowerPoint templates are Efficacious. People tell us our Cycle PowerPoint templates and PPT Slides provide you with a vast range of viable options. Select the appropriate ones and just fill in your text.
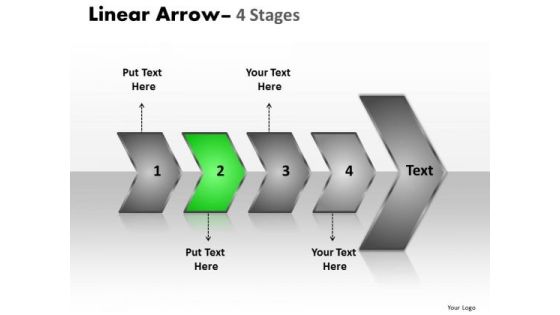
Sales Ppt Theme Succeeding Media Representation Theory PowerPoint Of 4 Arrows Design
We present our sales PPT Theme succeeding media representation theory power point of 4 arrows design. Use our Abstract PowerPoint Templates because; illustrate your plans on using the many social media modes available to inform society at large of the benefits of your product. Use our Symbol PowerPoint Templates because, Churn the mixture to the right degree and pound home your views and expectations in a spectacularly grand and virtuoso fluid performance. Use our Business PowerPoint Templates because; Blaze a brilliant trail from point to point. Use our Process and Flows PowerPoint Templates because, transmit your thoughts via our slides and prod your team to action. Use our Arrows PowerPoint Templates because, anticipate the doubts and questions in the minds of your colleagues and enlighten them with your inspired strategy to garner desired success. Use these PowerPoint slides for presentations relating to Arrow, Background, Business, Chart, Diagram, Financial, Flow, Graphic, Gray, Icon, Illustration, Linear, Management, Orange, Perspective, Process, Reflection, Spheres, Stage, Text. The prominent colors used in the PowerPoint template are Green, Gray, and Black

About Us Green Energy Power Plant Firm Clean And Renewable Energy Ppt PowerPoint Presentation Styles Picture PDF
This slide represents the introduction of a green energy power firm, including the years of track record, rank in the US commercial, and years of project warranty.Deliver an awe inspiring pitch with this creative About Us Green Energy Power Plant Firm Clean And Renewable Energy Ppt PowerPoint Presentation Styles Picture PDF bundle. Topics like Highest Standards, Communities, Organizations Continue can be discussed with this completely editable template. It is available for immediate download depending on the needs and requirements of the user.

data collection and analysis flow chart ppt powerpoint presentation microsoft
This is a data collection and analysis flow chart ppt powerpoint presentation microsoft. This is a nine stage process. The stages in this process are business, planning, marketing, strategy, management.

Capital Investment Options What Will Be Our Project Development Cycle Background PDF
Following slide portrays companys real estate project development cycle. Here the cycle starts from sourcing step and ends at facility management. This is a Capital Investment Options What Will Be Our Project Development Cycle Background PDF template with various stages. Focus and dispense information on six stages using this creative set, that comes with editable features. It contains large content boxes to add your information on topics like Project Management, Facility Management, Design Works, Terrain Attainment. You can also showcase facts, figures, and other relevant content using this PPT layout. Grab it now.

What Is Parallel Processing Dynamic Layout Of Three Stage PowerPoint Slides
We present our what is parallel processing dynamic layout of three stage PowerPoint Slides.Download and present our Arrows PowerPoint Templates because Your audience will believe you are the cats whiskers. Use our Business PowerPoint Templates because Our PowerPoint Templates and Slides are Clear and concise. Use them and dispel any doubts your team may have. Download our Leadership PowerPoint Templates because It will get your audience in sync. Present our Sales PowerPoint Templates because Our PowerPoint Templates and Slides are innately eco-friendly. Their high recall value negate the need for paper handouts. Present our Shapes PowerPoint Templates because Our PowerPoint Templates and Slides are aesthetically designed to attract attention. We gaurantee that they will grab all the eyeballs you need.Use these PowerPoint slides for presentations relating to business, chart, collaborate, colorful, colors, commerce, concept, data, development, direction, economic, forward, graph, graphics, growing, growth, illustration, improvement, interaction, lead, leadership, line, manage, management, networking, object, organization, organize, performance, race, relation, relationship, resources, results, sales, same, staff, team, together. The prominent colors used in the PowerPoint template are Blue navy, Green, Blue. People tell us our what is parallel processing dynamic layout of three stage PowerPoint Slides will make you look like a winner. People tell us our commerce PowerPoint templates and PPT Slides are visually appealing. Presenters tell us our what is parallel processing dynamic layout of three stage PowerPoint Slides are incredible easy to use. We assure you our data PowerPoint templates and PPT Slides will make the presenter look like a pro even if they are not computer savvy. Presenters tell us our what is parallel processing dynamic layout of three stage PowerPoint Slides will impress their bosses and teams. Professionals tell us our collaborate PowerPoint templates and PPT Slides are specially created by a professional team with vast experience. They diligently strive to come up with the right vehicle for your brilliant Ideas.
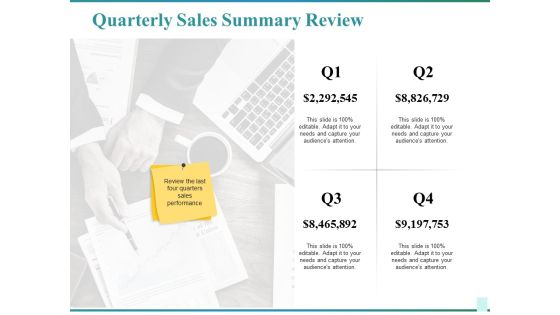
Quarterly Sales Summary Review Ppt PowerPoint Presentation Infographics Graphics Template
This is a quarterly sales summary review ppt powerpoint presentation infographics graphics template. This is a four stage process. The stages in this process are business, marketing, review, management, planning.

 Home
Home