AI PPT Maker
Templates
PPT Bundles
Design Services
Business PPTs
Business Plan
Management
Strategy
Introduction PPT
Roadmap
Self Introduction
Timelines
Process
Marketing
Agenda
Technology
Medical
Startup Business Plan
Cyber Security
Dashboards
SWOT
Proposals
Education
Pitch Deck
Digital Marketing
KPIs
Project Management
Product Management
Artificial Intelligence
Target Market
Communication
Supply Chain
Google Slides
Research Services
 One Pagers
All Categories
-
Home
- Customer Favorites
- Business Impact Analysis
Business Impact Analysis

Microsoft Strategic Plan To Become Market Leader PESTLE Analysis Of Microsoft To Identify Various Factors Portrait PDF
This slide shows six different factors which can have a direct or indirect impact on the business of microsoft. These factors or elements are political, economical, social, technological, ecological and legal factors. If you are looking for a format to display your unique thoughts, then the professionally designed Microsoft Strategic Plan To Become Market Leader PESTLE Analysis Of Microsoft To Identify Various Factors Portrait PDF is the one for you. You can use it as a Google Slides template or a PowerPoint template. Incorporate impressive visuals, symbols, images, and other charts. Modify or reorganize the text boxes as you desire. Experiment with shade schemes and font pairings. Alter, share or cooperate with other people on your work. Download Microsoft Strategic Plan To Become Market Leader PESTLE Analysis Of Microsoft To Identify Various Factors Portrait PDF and find out how to give a successful presentation. Present a perfect display to your team and make your presentation unforgettable.

Detailed Analysis Of Red Ocean Vs Blue Ocean Approach Using Blue Ocean With Existing Strategic Planning Graphics PDF
This template cover companys strategies to use blue ocean with existing strategic planning model. It also depicts that SWOT analysis helps determine areas where organization is doing well and areas it needs to improve and by using both frameworks together, company will be able to identify how organization can grow in the future Get a simple yet stunning designed Detailed Analysis Of Red Ocean Vs Blue Ocean Approach Using Blue Ocean With Existing Strategic Planning Graphics PDF. It is the best one to establish the tone in your meetings. It is an excellent way to make your presentations highly effective. So, download this PPT today from Slidegeeks and see the positive impacts. Our easy to edit Detailed Analysis Of Red Ocean Vs Blue Ocean Approach Using Blue Ocean With Existing Strategic Planning Graphics PDF can be your go to option for all upcoming conferences and meetings. So, what are you waiting for Grab this template today.

Benefits Of Credit Risk Management For The Bank Credit Risk Analysis Model For Banking Institutions Graphics PDF
This slide shows the benefits of credit risk management for the bank such as protect balance sheet, increase sales, enhance credit management, improve financing, etc.Presenting this PowerPoint presentation, titled Benefits Of Credit Risk Management For The Bank Credit Risk Analysis Model For Banking Institutions Graphics PDF, with topics curated by our researchers after extensive research. This editable presentation is available for immediate download and provides attractive features when used. Download now and captivate your audience. Presenting this Benefits Of Credit Risk Management For The Bank Credit Risk Analysis Model For Banking Institutions Graphics PDF. Our researchers have carefully researched and created these slides with all aspects taken into consideration. This is a completely customizable Benefits Of Credit Risk Management For The Bank Credit Risk Analysis Model For Banking Institutions Graphics PDF that is available for immediate downloading. Download now and make an impact on your audience. Highlight the attractive features available with our PPTs.
Identify Value Impacting Deliverables Icons PDF
This template covers the guidelines for identifying and validating the top three to five value-added IT services apps or projects. Presenting identify value impacting deliverables icons pdf to provide visual cues and insights. Share and navigate important information on three stages that need your due attention. This template can be used to pitch topics like transaction systems, optimization, service, risk mitigation, revenue impact. In addtion, this PPT design contains high resolution images, graphics, etc, that are easily editable and available for immediate download.

Case Competition Inflated Fuel Price In Logistics Firm Swot Analysis Of XYZ Logistics Company Threats Brochure PDF
This slide shows some threats that may effect the company in future course of time and impact the company profits. Some potential threats are Rising Fuel Costs, Intense Competition, Government Regulations and Currency Fluctuations etc. This is a v template with various stages. Focus and dispense information on four stages using this creative set, that comes with editable features. It contains large content boxes to add your information on topics like rising fuel costs, intense competition, government regulations and currency fluctuations, threat, economic. You can also showcase facts, figures, and other relevant content using this PPT layout. Grab it now.

FMEA Failure Mode And Effects Analysis Table With An Example FMEA Techniques For Process Assessment Portrait PDF
This slide provides the FMEA table along with details such as process function, failure mode, cause of failure, possible effect of failure, potential severity, probability of occurrence, probability of not detecting, risk priority number RPN etc.Deliver an awe inspiring pitch with this creative FMEA Failure Mode And Effects Analysis Table With An Example FMEA Techniques For Process Assessment Portrait PDF bundle. Topics like Severity Occurrence, Process Function, Overpressure Failure can be discussed with this completely editable template. It is available for immediate download depending on the needs and requirements of the user.

Detailed Analysis Of Red Ocean Vs Blue Ocean Approach Profit Model For Blue Ocean Strategy Icons PDF
This template covers setting up of new profit model for the business while implementing blue ocean strategy. It includes strategic price, target profit, target cost, partnering, streamlining cost innovation, pricing innovation. Retrieve professionally designed Detailed Analysis Of Red Ocean Vs Blue Ocean Approach Profit Model For Blue Ocean Strategy Icons PDF to effectively convey your message and captivate your listeners. Save time by selecting pre made slideshows that are appropriate for various topics, from business to educational purposes. These themes come in many different styles, from creative to corporate, and all of them are easily adjustable and can be edited quickly. Access them as PowerPoint templates or as Google Slides themes. You do not have to go on a hunt for the perfect presentation because Slidegeeks got you covered from everywhere.

Detailed Analysis Of Red Ocean Vs Blue Ocean Approach Mind Map Of Blue Ocean Leadership Professional PDF
This template covers a tipping point leadership mind map. It shows differences from the conventional approach. It also depicts that blue ocean leadership can help organizations realize oceans of employee potential and stop leaders from wasting their time. The step-by-step process we have outlined gives organizations and leaders a clear roadmap to approach the implementation of blue ocean leadership. The best PPT templates are a great way to save time, energy, and resources. Slidegeeks have 100 percent editable powerpoint slides making them incredibly versatile. With these quality presentation templates, you can create a captivating and memorable presentation by combining visually appealing slides and effectively communicating your message. Download Detailed Analysis Of Red Ocean Vs Blue Ocean Approach Mind Map Of Blue Ocean Leadership Professional PDF from Slidegeeks and deliver a wonderful presentation.

Detailed Analysis Of Red Ocean Vs Blue Ocean Approach Sequence Of Creating A Blue Ocean Introduction PDF
This template cover Sequence of creating blue ocean flowchart. It is used by companies to build their blue ocean strategy in the sequence of buyer utility, price, cost, and adoption. It also allows them to build a viable business model and ensure that a company profits from the blue ocean it is creating. Presenting this PowerPoint presentation, titled Detailed Analysis Of Red Ocean Vs Blue Ocean Approach Sequence Of Creating A Blue Ocean Introduction PDF, with topics curated by our researchers after extensive research. This editable presentation is available for immediate download and provides attractive features when used. Download now and captivate your audience. Presenting this Detailed Analysis Of Red Ocean Vs Blue Ocean Approach Sequence Of Creating A Blue Ocean Introduction PDF. Our researchers have carefully researched and created these slides with all aspects taken into consideration. This is a completely customizable Detailed Analysis Of Red Ocean Vs Blue Ocean Approach Sequence Of Creating A Blue Ocean Introduction PDF that is available for immediate downloading. Download now and make an impact on your audience. Highlight the attractive features available with our PPTs.

Toolkit For Data Science And Analytics Transition Data Change Management Plan With Value Chain Analysis Information PDF
This slide shows the value change management lifecycle. It includes the process of collecting and publicize the data and afterwards adopting change management approach for obtaining the data driven outcomes. Get a simple yet stunning designed Toolkit For Data Science And Analytics Transition Data Change Management Plan With Value Chain Analysis Information PDF. It is the best one to establish the tone in your meetings. It is an excellent way to make your presentations highly effective. So, download this PPT today from Slidegeeks and see the positive impacts. Our easy to edit Toolkit For Data Science And Analytics Transition Data Change Management Plan With Value Chain Analysis Information PDF can be your go to option for all upcoming conferences and meetings. So, what are you waiting for Grab this template today.
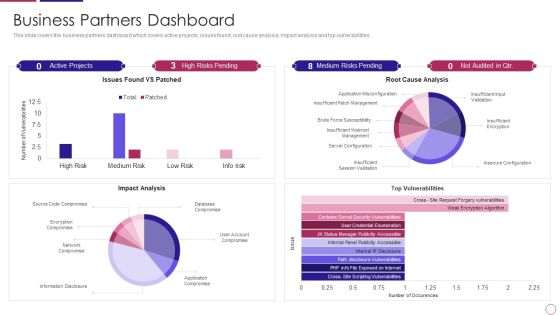
PRM To Streamline Business Processes Business Partners Dashboard Introduction PDF
This slide covers the business partners dashboard which covers active projects, issues found, root cause analysis, impact analysis and top vulnerabilities. Deliver and pitch your topic in the best possible manner with this prm to streamline business processes business partners dashboard introduction pdf. Use them to share invaluable insights on impact analysis, top vulnerabilities, server configuration, network compromise, issues found vs patched and impress your audience. This template can be altered and modified as per your expectations. So, grab it now.
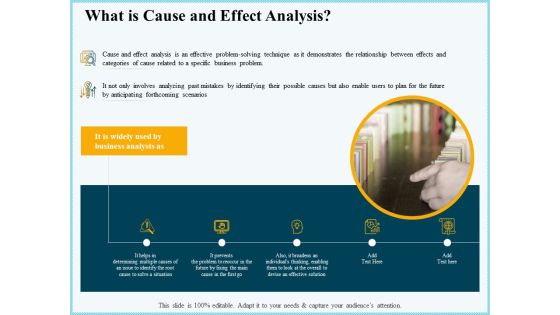
Vicious Circle Effect On Quality Assurance What Is Cause And Effect Analysis Ppt Infographic Template Deck PDF
Deliver an awe-inspiring pitch with this creative vicious circle effect on quality assurance what is cause and effect analysis ppt infographic template deck pdf bundle. Topics like business, analysts, problem, relationship, possible causes can be discussed with this completely editable template. It is available for immediate download depending on the needs and requirements of the user.

Guide For Managers To Effectively Handle Products Competitor Analysis Market Ppt PowerPoint Presentation Summary Visual Aids PDF
Presenting this set of slides with name guide for managers to effectively handle products competitor analysis market ppt powerpoint presentation summary visual aids pdf. The topics discussed in these slides are competitors, market leader, challenger, niche competitor, explanations, business. This is a completely editable PowerPoint presentation and is available for immediate download. Download now and impress your audience.

Effective Data Arrangement For Data Accessibility And Processing Readiness Data Exploration Process In Detail Analysis Ideas PDF
This slide shows the data exploration process in detail that can be used to bring out the basic understanding of the real time data into data analytics. This is a effective data arrangement for data accessibility and processing readiness data exploration process in detail analysis ideas pdf template with various stages. Focus and dispense information on four stages using this creative set, that comes with editable features. It contains large content boxes to add your information on topics like treatment, outlier treatment, variable transformation. You can also showcase facts, figures, and other relevant content using this PPT layout. Grab it now.
Fishbone Ishikawa Cause And Effect Analysis Sources Of Variation Method Ppt PowerPoint Presentation Icon Example Topics PDF
Presenting this set of slides with name fishbone ishikawa cause and effect analysis sources of variation method ppt powerpoint presentation icon example topics pdf. The topics discussed in these slides are different methods followed produce products, alterations caused inappropriate methods, processes, effectiveness. This is a completely editable PowerPoint presentation and is available for immediate download. Download now and impress your audience.

Fishbone Ishikawa Cause And Effect Analysis Sources Of Variation People Ppt PowerPoint Presentation Infographics Designs Download PDF
Presenting this set of slides with name fishbone ishikawa cause and effect analysis sources of variation people ppt powerpoint presentation infographics designs download pdf. The topics discussed in these slides are skill, knowledge, attitude worker, individual justified, equipment. This is a completely editable PowerPoint presentation and is available for immediate download. Download now and impress your audience.

Fishbone Ishikawa Cause And Effect Analysis Sources Of Variation Measurement System Ppt PowerPoint Presentation Layouts Graphic Tips PDF
Presenting this set of slides with name fishbone ishikawa cause and effect analysis sources of variation measurement system ppt powerpoint presentation layouts graphic tips pdf. The topics discussed in these slides are multiple measuring, variations due difference, measuring instruments, equipment, knowledge and experience. This is a completely editable PowerPoint presentation and is available for immediate download. Download now and impress your audience.
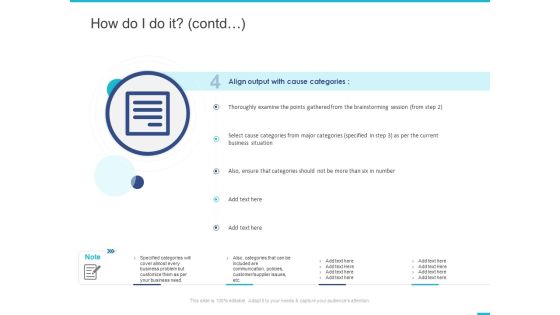
Fishbone Ishikawa Cause And Effect Analysis How Do I Do It Contd Communication Ppt PowerPoint Presentation Show Layout PDF
Presenting this set of slides with name fishbone ishikawa cause and effect analysis how do i do it contd communication ppt powerpoint presentation show layout pdf. This is a one stage process. The stages in this process are align output cause categories, brainstorming, business situation. This is a completely editable PowerPoint presentation and is available for immediate download. Download now and impress your audience.

Detailed Analysis Of Red Ocean Vs Blue Ocean Approach Key Challenges That Can Occur While Shifting Towards Elements PDF
This template covers hurdles that company should consider while formulating blue ocean strategy. Some of the challenges are strategic clarity and corporate mindset, finding the right blue ocean, clarity about the new destination, the trade-offs it requires. Explore a selection of the finest Detailed Analysis Of Red Ocean Vs Blue Ocean Approach Key Challenges That Can Occur While Shifting Towards Elements PDF here. With a plethora of professionally designed and pre made slide templates, you can quickly and easily find the right one for your upcoming presentation. You can use our Detailed Analysis Of Red Ocean Vs Blue Ocean Approach Key Challenges That Can Occur While Shifting Towards Elements PDF to effectively convey your message to a wider audience. Slidegeeks has done a lot of research before preparing these presentation templates. The content can be personalized and the slides are highly editable. Grab templates today from Slidegeeks.

Marketers Guide To Data Analysis Optimization Analyzing Cost Per Click CPC To Ensure Higher ROI Slides PDF
Get a simple yet stunning designed Marketers Guide To Data Analysis Optimization Analyzing Cost Per Click CPC To Ensure Higher ROI Slides PDF. It is the best one to establish the tone in your meetings. It is an excellent way to make your presentations highly effective. So, download this PPT today from Slidegeeks and see the positive impacts. Our easy to edit Marketers Guide To Data Analysis Optimization Analyzing Cost Per Click CPC To Ensure Higher ROI Slides PDF can be your go to option for all upcoming conferences and meetings. So, what are you waiting for Grab this template today.

Mitigating Sales Risks With Strategic Action Planning Key Metrics To Assess Effectiveness Of Sales Risk Analysis Rules PDF
The following slide highlights some key performance indicators to measure the effectiveness of sales risk evaluation on revenue performance. It includes elements such as opportunities, win rate, average time to win, sales velocity along with key insights etc. Create an editable Mitigating Sales Risks With Strategic Action Planning Key Metrics To Assess Effectiveness Of Sales Risk Analysis Rules PDF that communicates your idea and engages your audience. Whether youre presenting a business or an educational presentation, pre designed presentation templates help save time. Mitigating Sales Risks With Strategic Action Planning Key Metrics To Assess Effectiveness Of Sales Risk Analysis Rules PDF is highly customizable and very easy to edit, covering many different styles from creative to business presentations. Slidegeeks has creative team members who have crafted amazing templates. So, go and get them without any delay.
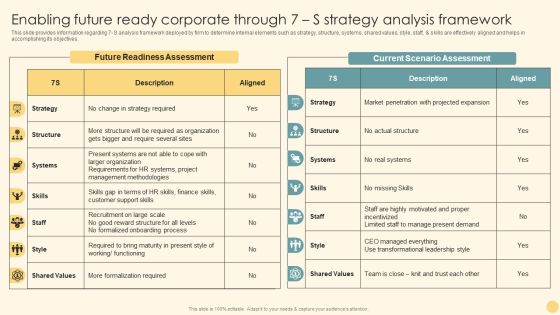
Enabling Future Ready Corporate Through 7 S Strategy Analysis Framework Ppt PowerPoint Presentation File Background Images PDF
This slide provides information regarding 7 S analysis framework deployed by firm to determine internal elements such as strategy, structure, systems, shared values, style, staff, and skills are effectively aligned and helps in accomplishing its objectives. Get a simple yet stunning designed Enabling Future Ready Corporate Through 7 S Strategy Analysis Framework Ppt PowerPoint Presentation File Background Images PDF. It is the best one to establish the tone in your meetings. It is an excellent way to make your presentations highly effective. So, download this PPT today from Slidegeeks and see the positive impacts. Our easy to edit Enabling Future Ready Corporate Through 7 S Strategy Analysis Framework Ppt PowerPoint Presentation File Background Images PDF can be your go-to option for all upcoming conferences and meetings. So, what are you waiting for Grab this template today.

Strategic Guide For Positioning Expanded Brand Competitive Analysis To Get Valuable Insights On Product Offerings Slides PDF
Following table shows competitor analysis of various companies offering products like sensors, processors, communication hardware, platform, devices, analytics and data base along with specific product. Get a simple yet stunning designed Strategic Guide For Positioning Expanded Brand Competitive Analysis To Get Valuable Insights On Product Offerings Slides PDF. It is the best one to establish the tone in your meetings. It is an excellent way to make your presentations highly effective. So, download this PPT today from Slidegeeks and see the positive impacts. Our easy-to-edit Strategic Guide For Positioning Expanded Brand Competitive Analysis To Get Valuable Insights On Product Offerings Slides PDF can be your go-to option for all upcoming conferences and meetings. So, what are you waiting for. Grab this template today.
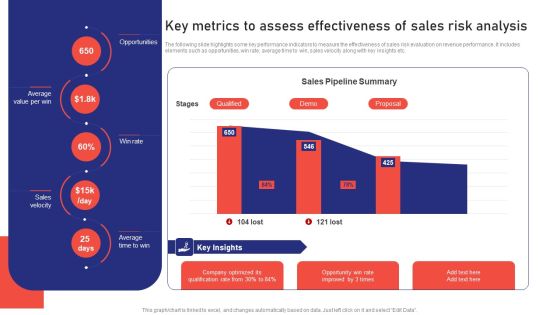
Sales Risk Assessment For Profit Maximization Key Metrics To Assess Effectiveness Of Sales Risk Analysis Ideas PDF
The following slide highlights some key performance indicators to measure the effectiveness of sales risk evaluation on revenue performance. It includes elements such as opportunities, win rate, average time to win, sales velocity along with key insights etc. Get a simple yet stunning designed Sales Risk Assessment For Profit Maximization Key Metrics To Assess Effectiveness Of Sales Risk Analysis Ideas PDF. It is the best one to establish the tone in your meetings. It is an excellent way to make your presentations highly effective. So, download this PPT today from Slidegeeks and see the positive impacts. Our easy to edit Sales Risk Assessment For Profit Maximization Key Metrics To Assess Effectiveness Of Sales Risk Analysis Ideas PDF can be your go to option for all upcoming conferences and meetings. So, what are you waiting for Grab this template today.

Marketers Guide To Data Analysis Optimization Tracking Spam Complaint Rate To Avoid Account Suspension Risk Template PDF
This slide covers an overview of the spam rate to identify the number of recipients who mark messages as spam in their inboxes. It also includes strategies to reduce spam, such as sending emails only to those who have opted to receive them, segmenting your email list, etc. Get a simple yet stunning designed Marketers Guide To Data Analysis Optimization Tracking Spam Complaint Rate To Avoid Account Suspension Risk Template PDF. It is the best one to establish the tone in your meetings. It is an excellent way to make your presentations highly effective. So, download this PPT today from Slidegeeks and see the positive impacts. Our easy to edit Marketers Guide To Data Analysis Optimization Tracking Spam Complaint Rate To Avoid Account Suspension Risk Template PDF can be your go to option for all upcoming conferences and meetings. So, what are you waiting for Grab this template today.
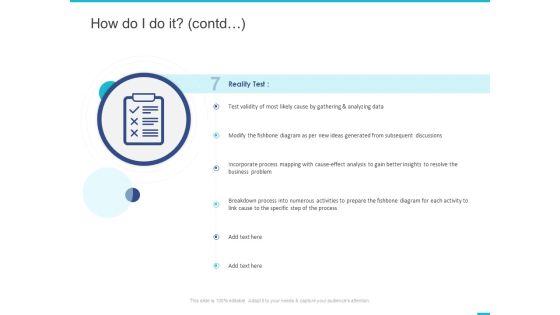
Fishbone Ishikawa Cause And Effect Analysis How Do I Do It Contd Process Ppt PowerPoint Presentation Portfolio Design Inspiration PDF
Presenting this set of slides with name fishbone ishikawa cause and effect analysis how do i do it contd process ppt powerpoint presentation portfolio design inspiration pdf. This is a one stage process. The stages in this process are reality test, analyzing data, business problem, process. This is a completely editable PowerPoint presentation and is available for immediate download. Download now and impress your audience.

Drug Indicator Extension In A Pharmaceuticals Company Competitive Analysis Of SW Care Pharmaceutical Company 2021 Ideas PDF
This slide shows the competitive analysis of SW Care Pharmaceutical Company with other competitors, based on various parameters such as revenue, Treatment Type, Injection Frequency, RA Indication Launch, Drug Effectiveness etc. Deliver an awe inspiring pitch with this creative drug indicator extension in a pharmaceuticals company competitive analysis of sw care pharmaceutical company 2021 ideas pdf bundle. Topics like drug effectiveness, injection frequency, pharmaceutical companies, revenue can be discussed with this completely editable template. It is available for immediate download depending on the needs and requirements of the user.

Two Factors Analysis Layout For Marketing Tactics To Retain Customers Ppt PowerPoint Presentation Gallery Layout Ideas PDF
Presenting two factors analysis layout for marketing tactics to retain customers ppt powerpoint presentation gallery layout ideas pdf to dispense important information. This template comprises two stages. It also presents valuable insights into the topics including formal communication, conversion tactics. This is a completely customizable PowerPoint theme that can be put to use immediately. So, download it and address the topic impactfully.
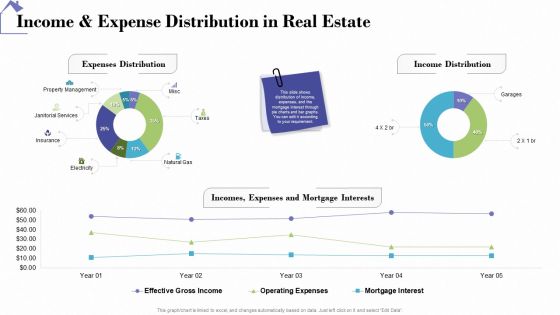
Industry Analysis Of Real Estate And Construction Sector Income And Expense Distribution In Real Estate Clipart PDF
Deliver an awe inspiring pitch with this creative industry analysis of real estate and construction sector income and expense distribution in real estate clipart pdf bundle. Topics like property management, services, insurance, effective, operating expenses can be discussed with this completely editable template. It is available for immediate download depending on the needs and requirements of the user.
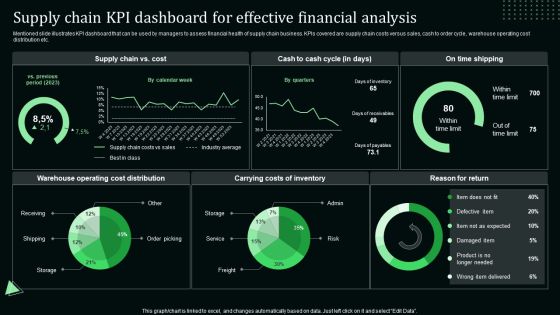
Supply Chain Kpi Dashboard For Effective Financial Analysis Stand Out Digital Supply Chain Tactics Enhancing Graphics PDF
Mentioned slide illustrates KPI dashboard that can be used by managers to assess financial health of supply chain business. KPIs covered are supply chain costs versus sales, cash to order cycle, warehouse operating cost distribution etc.Coming up with a presentation necessitates that the majority of the effort goes into the content and the message you intend to convey. The visuals of a PowerPoint presentation can only be effective if it supplements and supports the story that is being told. Keeping this in mind our experts created Supply Chain Kpi Dashboard For Effective Financial Analysis Stand Out Digital Supply Chain Tactics Enhancing Graphics PDF to reduce the time that goes into designing the presentation. This way, you can concentrate on the message while our designers take care of providing you with the right template for the situation.
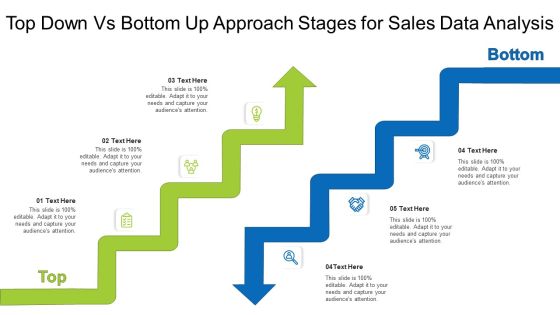
Top Down Vs Bottom Up Approach Stages For Sales Data Analysis Ppt PowerPoint Presentation Inspiration Template PDF
Presenting top down vs bottom up approach stages for sales data analysis ppt powerpoint presentation inspiration template pdf to dispense important information. This template comprises two stages. It also presents valuable insights into the topics including top down vs bottom up approach stages for sales data analysis. This is a completely customizable PowerPoint theme that can be put to use immediately. So, download it and address the topic impactfully.

6 Month Project Timeline Slide For Cleaning Imbalanced Data Sentiment Analysis Ppt PowerPoint Presentation File Deck PDF
Presenting 6 month project timeline slide for cleaning imbalanced data sentiment analysis ppt powerpoint presentation file deck pdf to dispense important information. This template comprises six stages. It also presents valuable insights into the topics including 6 month project timeline slide for cleaning imbalanced data sentiment analysis. This is a completely customizable PowerPoint theme that can be put to use immediately. So, download it and address the topic impactfully.

3 Arrows In A Sphere Diagram For Revenue Cycle Profitability Analysis Ppt PowerPoint Presentation Gallery Visual Aids PDF
Presenting 3 arrows in a sphere diagram for revenue cycle profitability analysis ppt powerpoint presentation gallery visual aids pdf to dispense important information. This template comprises three stages. It also presents valuable insights into the topics including 3 arrows in a sphere diagram for revenue cycle profitability analysis. This is a completely customizable PowerPoint theme that can be put to use immediately. So, download it and address the topic impactfully.

Strategic Plan To Increase Sales Volume And Revenue Market Segmentation Analysis Chart For Implementing Sales Strategy Microsoft PDF
This slide shows the Market Segmentation based on various characteristics like Geographic region, Climate, Country etc. Demographic Age, Sex, Religion etc. Psychographic Personality, Attitude, Opinions etc. and Behavioral Usage Rate, Purchase Readiness etc. which will help to categorize the target audience more effectively and implement the sales strategy. Deliver an awe inspiring pitch with this creative strategic plan to increase sales volume and revenue market segmentation analysis chart for implementing sales strategy microsoft pdf bundle. Topics like psychographic, behavioral, geographic, demographic can be discussed with this completely editable template. It is available for immediate download depending on the needs and requirements of the user.

Analysis Plan For E Commerce Promotion Tactics Conversation Rate And Economic Value Of Deployed Social Media Channels Portrait PDF
This slide tabulates the economic value obtained from multiple social media channels. It also provides information regarding the total number of posts, comments, conversion rate, amplification rate and applause rate. Coming up with a presentation necessitates that the majority of the effort goes into the content and the message you intend to convey. The visuals of a PowerPoint presentation can only be effective if it supplements and supports the story that is being told. Keeping this in mind our experts created Analysis Plan For E Commerce Promotion Tactics Conversation Rate And Economic Value Of Deployed Social Media Channels Portrait PDF to reduce the time that goes into designing the presentation. This way, you can concentrate on the message while our designers take care of providing you with the right template for the situation.
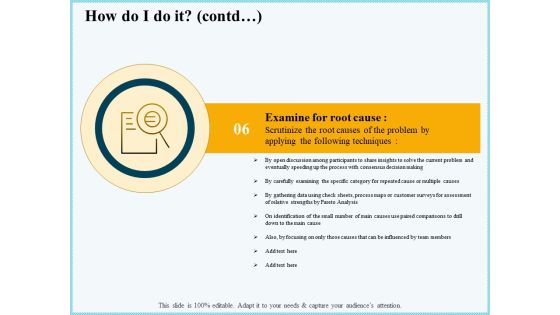
Vicious Circle Effect On Quality Assurance How Do I Do It Contd Analysis Ppt Show Outline PDF
This is a vicious circle effect on quality assurance how do i do it contd analysis ppt show outline pdf template with various stages. Focus and dispense information on one stages using this creative set, that comes with editable features. It contains large content boxes to add your information on topics like consensus decision making, current problem, pareto analysis, team members. You can also showcase facts, figures, and other relevant content using this PPT layout. Grab it now.

Failure Methods And Effects Assessments FMEA Major Steps In Failure Mode And Effects Analysis Process Demonstration PDF
This slide provides the major steps in Failure Mode and Effects Analysis FMEA Process. It covers all the phases from reviewing the process to calculating the resulting RPNs risk priority numbers. This is a failure methods and effects assessments fmea major steps in failure mode and effects analysis process demonstration pdf template with various stages. Focus and dispense information on ten stages using this creative set, that comes with editable features. It contains large content boxes to add your information on topics like process, team, analyse, potential, severity ranking. You can also showcase facts, figures, and other relevant content using this PPT layout. Grab it now.

Criterion For Choosing Distribution Channel For Efficient Sales Administration Cost Benefit Analysis Of New Distribution Channel Mockup PDF
This slide shows the cost benefit analysis of implementing new distribution strategies with expected increase in sales percentage from the current level. The three strategies involves one-level, two-level and three level of sales channel. Get a simple yet stunning designed Criterion For Choosing Distribution Channel For Efficient Sales Administration Cost Benefit Analysis Of New Distribution Channel Mockup PDF. It is the best one to establish the tone in your meetings. It is an excellent way to make your presentations highly effective. So, download this PPT today from Slidegeeks and see the positive impacts. Our easy-to-edit Criterion For Choosing Distribution Channel For Efficient Sales Administration Cost Benefit Analysis Of New Distribution Channel Mockup PDF can be your go-to option for all upcoming conferences and meetings. So, what are you waiting for. Grab this template today.

Fishbone Ishikawa Cause And Effect Analysis Why Use Cause And Effect Diagram Ppt PowerPoint Presentation Gallery Background PDF
Presenting this set of slides with name fishbone ishikawa cause and effect analysis why use cause and effect diagram ppt powerpoint presentation gallery background pdf. This is a six stage process. The stages in this process are facilitates system thinking, visual linkages, communicate. This is a completely editable PowerPoint presentation and is available for immediate download. Download now and impress your audience.

Importance Of Failure Mode And Effects Analysis In An Organization FMEA Techniques For Process Assessment Infographics PDF
This slide provides the importance and uses of Failure Mode and Effects Analysis to identify the error or failures in any process in an organization. Presenting Importance Of Failure Mode And Effects Analysis In An Organization FMEA Techniques For Process Assessment Infographics PDF to provide visual cues and insights. Share and navigate important information on one stage that need your due attention. This template can be used to pitch topics like Designing Or Redesigning, Restructuring Process, Existing Process. In addtion, this PPT design contains high resolution images, graphics, etc, that are easily editable and available for immediate download.

Vicious Circle Effect On Quality Assurance Process Flow Of Cause And Effect Analysis Ppt Portfolio Structure PDF
Presenting vicious circle effect on quality assurance process flow of cause and effect analysis ppt portfolio structure pdf to provide visual cues and insights. Share and navigate important information on seven stages that need your due attention. This template can be used to pitch topics like brainstorm, draw fishbone diagram, align output cause categories, allocate causes, examine root cause, test reliability, identify problem. In addtion, this PPT design contains high-resolution images, graphics, etc, that are easily editable and available for immediate download.

Fishbone Ishikawa Cause And Effect Analysis What Is A Cause And Effect Diagram Ppt PowerPoint Presentation Ideas Portfolio PDF
Presenting this set of slides with name fishbone ishikawa cause and effect analysis what is a cause and effect diagram ppt powerpoint presentation ideas portfolio pdf. This is a one stage process. The stages in this process are equipment, process, specify cause category here, materials, environment, specify cause category . This is a completely editable PowerPoint presentation and is available for immediate download. Download now and impress your audience.

Target Audience Strategy For B2B And B2C Business How Inbound Marketing Strategy Impacts The Organization Demonstration PDF
Purpose of the following slide is to help organization understand impact of inbound marketing strategy on organization. These impacts can be increase number of qualified leads, increase in total number of visor in websites, etc. This modern and well-arranged Target Audience Strategy For B2B And B2C Business How Inbound Marketing Strategy Impacts The Organization Demonstration PDF provides lots of creative possibilities. It is very simple to customize and edit with the Powerpoint Software. Just drag and drop your pictures into the shapes. All facets of this template can be edited with Powerpoint no extra software is necessary. Add your own material, put your images in the places assigned for them, adjust the colors, and then you can show your slides to the world, with an animated slide included.

Major Market Drivers Of Global Food And Beverage Industry International Food And Beverages Sector Analysis Icons PDF
This slide represents major market drivers of global food and beverage industry. It provides information about enhanced foods, augmented transparency, packaging design, lifestyle, customer loyalty, market penetration, etc. This is a Major Market Drivers Of Global Food And Beverage Industry International Food And Beverages Sector Analysis Icons PDF template with various stages. Focus and dispense information on four stages using this creative set, that comes with editable features. It contains large content boxes to add your information on topics like Potential Impact, Market Drivers, Enhanced Foods. You can also showcase facts, figures, and other relevant content using this PPT layout. Grab it now.
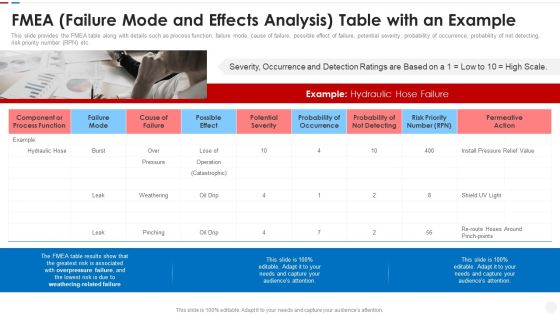
Failure Methods And Effects Assessments FMEA FMEA Failure Mode And Effects Analysis Table With An Example Topics PDF
This slide provides the FMEA table along with details such as process function, failure mode, cause of failure, possible effect of failure, potential severity, probability of occurrence, probability of not detecting, risk priority number RPN etc. This is a failure methods and effects assessments fmea fmea failure mode and effects analysis table with an example topics pdf template with various stages. Focus and dispense information on one stages using this creative set, that comes with editable features. It contains large content boxes to add your information on topics like process function, potential severity, risk priority, probability. You can also showcase facts, figures, and other relevant content using this PPT layout. Grab it now.

Procedure To Develop Effective Product Step 2 Market Analysis For Understanding Competitor Strategy Ppt Portfolio Diagrams PDF
This slide covers the process of market analysis for competitor assessment. It includes steps such as classifying competitors, examining the competitive environment, and analyzing competitors strengths, weaknesses, threats, opportunities, etc. Slidegeeks has constructed Procedure To Develop Effective Product Step 2 Market Analysis For Understanding Competitor Strategy Ppt Portfolio Diagrams PDF after conducting extensive research and examination. These presentation templates are constantly being generated and modified based on user preferences and critiques from editors. Here, you will find the most attractive templates for a range of purposes while taking into account ratings and remarks from users regarding the content. This is an excellent jumping-off point to explore our content and will give new users an insight into our top-notch PowerPoint Templates.
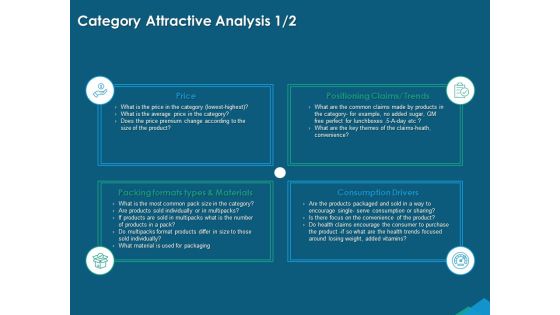
Guide For Managers To Effectively Handle Products Category Attractive Analysis Price Ppt PowerPoint Presentation Show Portrait PDF
Presenting this set of slides with name guide for managers to effectively handle products category attractive analysis price ppt powerpoint presentation show portrait pdf. This is a four stage process. The stages in this process are price, positioning claims trends, packing formats types and materials, consumption drivers. This is a completely editable PowerPoint presentation and is available for immediate download. Download now and impress your audience.
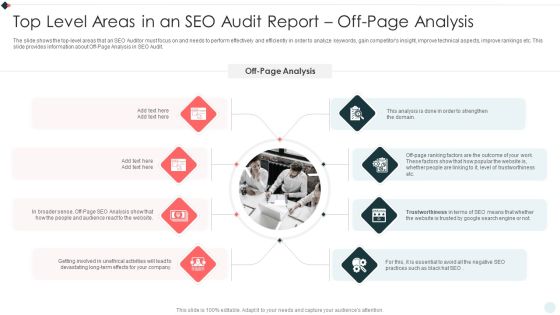
SEO Audit Summary To Increase Top Level Areas In An SEO Audit Report Off Page Analysis Graphics PDF
The slide shows the top-level areas that an SEO Auditor must focus on and needs to perform effectively and efficiently in order to analyze keywords, gain competitors insight, improve technical aspects, improve rankings etc. This slide provides information about Off-Page Analysis in SEO Audit. This is a SEO Audit Summary To Increase Top Level Areas In An SEO Audit Report Off Page Analysis Graphics PDF template with various stages. Focus and dispense information on eight stages using this creative set, that comes with editable features. It contains large content boxes to add your information on topics like Unethical Activities, Getting Involved, SEO Analysis. You can also showcase facts, figures, and other relevant content using this PPT layout. Grab it now.

Guide To Develop And Estimate Brand Value Sample Net Asset Value And Replacement Cost Analysis Methods Demonstration PDF
Following slide illustrates the examples of both methods namely net asset value and replacement cost analysis. Businesses can use these methods for their asset valuation.Coming up with a presentation necessitates that the majority of the effort goes into the content and the message you intend to convey. The visuals of a PowerPoint presentation can only be effective if it supplements and supports the story that is being told. Keeping this in mind our experts created Guide To Develop And Estimate Brand Value Sample Net Asset Value And Replacement Cost Analysis Methods Demonstration PDF to reduce the time that goes into designing the presentation. This way, you can concentrate on the message while our designers take care of providing you with the right template for the situation.

Clients Existing Website Traffic Assessment Top Level Areas In An SEO Audit Report Off Page Analysis Diagrams PDF
The slide shows the top level areas that an SEO Auditor must focus on and needs to perform effectively and efficiently in order to analyze keywords, gain competitors insight, improve technical aspects, improve rankings etc. This slide provides information about Off Page Analysis in SEO Audit.This is a Clients Existing Website Traffic Assessment Top Level Areas In An SEO Audit Report Off Page Analysis Diagrams PDF template with various stages. Focus and dispense information on seven stages using this creative set, that comes with editable features. It contains large content boxes to add your information on topics like Level Trustworthiness, Trustworthiness, Strengthen Domain. You can also showcase facts, figures, and other relevant content using this PPT layout. Grab it now.

Clients Existing Website Traffic Assessment Top Level Areas In An SEO Audit Report On Page Analysis Graphics PDF
The slide shows the top level areas that an SEO Auditor must focus on and needs to perform effectively and efficiently in order to analyze keywords, gain competitors insight, improve technical aspects, improve rankings etc. This slide provides information about On Page Analysis in SEO Audit.Presenting Clients Existing Website Traffic Assessment Top Level Areas In An SEO Audit Report On Page Analysis Graphics PDF to provide visual cues and insights. Share and navigate important information on six stages that need your due attention. This template can be used to pitch topics like General Content, Various Conflicting, Cannibalization Duplicate. In addtion, this PPT design contains high resolution images, graphics, etc, that are easily editable and available for immediate download.

Clients Existing Website Traffic Assessment Top Level Areas In An SEO Audit Report Technical Analysis Introduction PDF
The slide shows the top level areas that an SEO Auditor must focus on and needs to perform effectively and efficiently in order to analyze keywords, gain competitors insight, improve technical aspects, improve rankings etc. This slide provides information about Technical Analysis in SEO Audit.This is a Clients Existing Website Traffic Assessment Top Level Areas In An SEO Audit Report Technical Analysis Introduction PDF template with various stages. Focus and dispense information on six stages using this creative set, that comes with editable features. It contains large content boxes to add your information on topics like Almost Immediately, Post Occasionally, Whereas Indexability. You can also showcase facts, figures, and other relevant content using this PPT layout. Grab it now.

SEO Audit Summary To Increase Top Level Areas In An SEO Audit Report On Page Analysis Diagrams PDF
The slide shows the top-level areas that an SEO Auditor must focus on and needs to perform effectively and efficiently in order to analyze keywords, gain competitors insight, improve technical aspects, improve rankings etc. This slide provides information about On-Page Analysis in SEO Audit. This is a SEO Audit Summary To Increase Top Level Areas In An SEO Audit Report On Page Analysis Diagrams PDF template with various stages. Focus and dispense information on seven stages using this creative set, that comes with editable features. It contains large content boxes to add your information on topics like Individual Page, General Content, Duplicate Content. You can also showcase facts, figures, and other relevant content using this PPT layout. Grab it now.
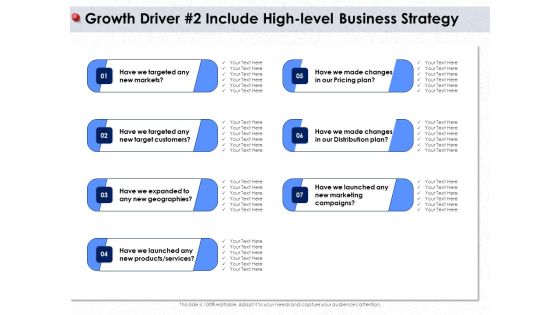
Ways To Design Impactful Trading Solution Growth Driver 2 Include High Level Business Strategy Ppt Infographic Template Gallery PDF
Presenting this set of slides with name ways to design impactful trading solution growth driver 2 include high level business strategy ppt infographic template gallery pdf. This is a seven stage process. The stages in this process are targeted new markets, target customers, geographies, products services, pricing plan, distribution plan, marketing campaign. This is a completely editable PowerPoint presentation and is available for immediate download. Download now and impress your audience.

Marketers Guide To Data Analysis Optimization Introduction To Paid Search Analytics For Improving Campaign Roi Demonstration PDF
This slide covers a brief overview of paid search analytics to determine campaign returns. It also includes steps for conducting a PPC audit, such as checking location and target settings, evaluating ads, using extensions, assessing keywords, etc. The best PPT templates are a great way to save time, energy, and resources. Slidegeeks have 100 percent editable powerpoint slides making them incredibly versatile. With these quality presentation templates, you can create a captivating and memorable presentation by combining visually appealing slides and effectively communicating your message. Download Marketers Guide To Data Analysis Optimization Introduction To Paid Search Analytics For Improving Campaign Roi Demonstration PDF from Slidegeeks and deliver a wonderful presentation.

Detailed Analysis Of Red Ocean Vs Blue Ocean Approach From Market Competing To Market Creation Shift Pictures PDF
This template covers reason to shift from market competition to market creation. It depicts that Companies are attempting to establish a new value-cost frontier by seeking differentiation and low costs. Coming up with a presentation necessitates that the majority of the effort goes into the content and the message you intend to convey. The visuals of a PowerPoint presentation can only be effective if it supplements and supports the story that is being told. Keeping this in mind our experts created Detailed Analysis Of Red Ocean Vs Blue Ocean Approach From Market Competing To Market Creation Shift Pictures PDF to reduce the time that goes into designing the presentation. This way, you can concentrate on the message while our designers take care of providing you with the right template for the situation.
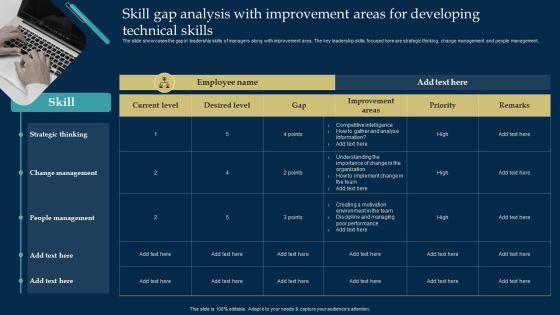
Employee Training And Development Strategy Skill Gap Analysis With Improvement Areas For Developing Technical Skills Slides PDF
The slide showcases the gap in leadership skills of managers along with improvement area. The key leadership skills focused here are strategic thinking, change management and people management. Coming up with a presentation necessitates that the majority of the effort goes into the content and the message you intend to convey. The visuals of a PowerPoint presentation can only be effective if it supplements and supports the story that is being told. Keeping this in mind our experts created Employee Training And Development Strategy Skill Gap Analysis With Improvement Areas For Developing Technical Skills Slides PDF to reduce the time that goes into designing the presentation. This way, you can concentrate on the message while our designers take care of providing you with the right template for the situation.
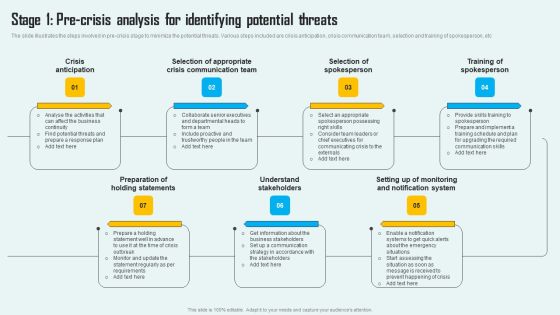
Key Phase Of Crisis Communication Management Plan Stage 1 Pre Crisis Analysis For Identifying Potential Threats Mockup PDF
The slide illustrates the steps involved in pre-crisis stage to minimize the potential threats. Various steps included are crisis anticipation, crisis communication team, selection and training of spokesperson, etc Coming up with a presentation necessitates that the majority of the effort goes into the content and the message you intend to convey. The visuals of a PowerPoint presentation can only be effective if it supplements and supports the story that is being told. Keeping this in mind our experts created Key Phase Of Crisis Communication Management Plan Stage 1 Pre Crisis Analysis For Identifying Potential Threats Mockup PDF to reduce the time that goes into designing the presentation. This way, you can concentrate on the message while our designers take care of providing you with the right template for the situation.

3 Key Areas Of Ai Impacting Businesses Icon Professional PDF
Pitch your topic with ease and precision using this 3 Key Areas Of Ai Impacting Businesses Icon Professional PDF. This layout presents information on 3 Key Areas, Ai Impacting, Businesses. It is also available for immediate download and adjustment. So, changes can be made in the color, design, graphics or any other component to create a unique layout.
Fishbone Ishikawa Cause And Effect Analysis How Do I Do It Ppt PowerPoint Presentation Icon Graphics Tutorials PDF
Presenting this set of slides with name fishbone ishikawa cause and effect analysis how do i do it ppt powerpoint presentation icon graphics tutorials pdf. This is a one stage process. The stages in this process are identify problem, business, analyzed, problem. This is a completely editable PowerPoint presentation and is available for immediate download. Download now and impress your audience.
