Business Benefits
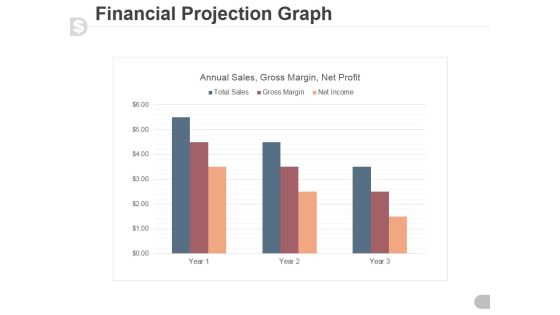
Financial Projection Graph Template 1 Ppt PowerPoint Presentation Guide
This is a financial projection graph template 1 ppt powerpoint presentation guide. This is a three stage process. The stages in this process are annual sales, gross margin, net profit.

Competitor Analysis Template Ppt PowerPoint Presentation Ideas
This is a competitor analysis template ppt powerpoint presentation ideas. This is a five stage process. The stages in this process are revenue, profit, market share, number of employee, product quality, main activity, revenue.

Asset Allocation Ppt PowerPoint Presentation Sample
This is a asset allocation ppt powerpoint presentation sample. This is a two stage process. The stages in this process are risk, reward, risk reward ratio, take profit distance.

Stacked Line Chart Ppt PowerPoint Presentation Shapes
This is a stacked line chart ppt powerpoint presentation shapes. This is a two stage process. The stages in this process are product, profit in thousands, finance, analysis, growth.

Break Even Analysis Ppt PowerPoint Presentation Slides
This is a break even analysis ppt powerpoint presentation slides. This is a two stage process. The stages in this process are loss, profit, sales, total revenue, break even point, total costs.
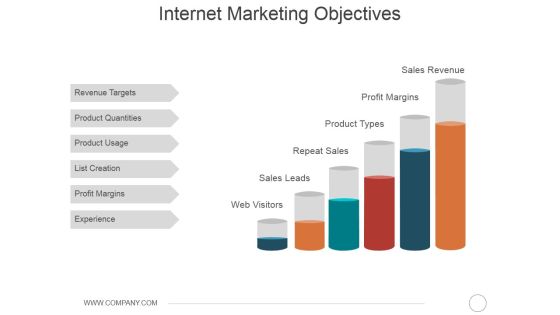
Internet Marketing Objectives Ppt PowerPoint Presentation Portfolio Summary
This is a internet marketing objectives ppt powerpoint presentation portfolio summary. This is a six stage process. The stages in this process are revenue targets, product quantities, product usage, list creation, profit margins, experience.

Competitor Analysis Comparison Table Ppt PowerPoint Presentation Outline Slides
This is a competitor analysis comparison table ppt powerpoint presentation outline slides. This is a two stage process. The stages in this process are revenue, profit, market share, main activity, number of employee, product quality.

Competitor Analysis Comparison Table Ppt PowerPoint Presentation Infographic Template Graphics
This is a competitor analysis comparison table ppt powerpoint presentation infographic template graphics. This is a seven stage process. The stages in this process are profit, revenue, market share, main activity, criteria.

Competitor Analysis Comparison Table Ppt PowerPoint Presentation Icon Designs Download
This is a competitor analysis comparison table ppt powerpoint presentation icon designs download. This is a seven stage process. The stages in this process are revenue, profit, market share, main activity, number of employee, product quality.

Competitor Analysis Comparison Table Ppt PowerPoint Presentation Infographics Design Inspiration
This is a competitor analysis comparison table ppt powerpoint presentation infographics design inspiration. This is a seven stage process. The stages in this process are revenue, profit, market share, main activity.

Key Financial Ratio Template 3 Ppt PowerPoint Presentation Slides Inspiration
This is a key financial ratio template 3 ppt powerpoint presentation slides inspiration. This is a four stage process. The stages in this process are liquidity, profitability, activity, solvency.

Internet Marketing Objectives Ppt PowerPoint Presentation Layouts Smartart
This is a internet marketing objectives ppt powerpoint presentation layouts smartart. This is a six stage process. The stages in this process are sales leads, product types, sales revenue, profit margins, repeat sales, web visitors.

Financials Base Plan Ppt Powerpoint Presentation Slides Design Inspiration
This is a financials base plan ppt powerpoint presentation slides design inspiration. This is a four stage process. The stages in this process are financial summary, revenue, cost of sales, gross profit.
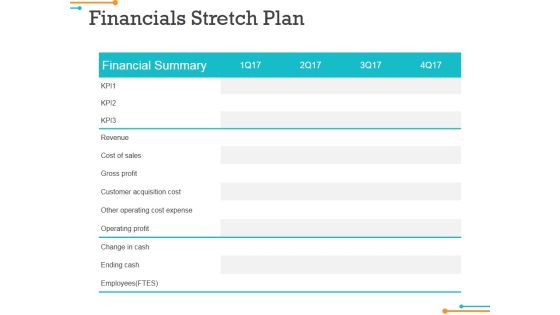
Financials Stretch Plan Ppt Powerpoint Presentation Infographics Background Image
This is a financials stretch plan ppt powerpoint presentation infographics background image. This is a four stage process. The stages in this process are financial summary, revenue, cost of sales, gross profit.

Calculating Customer Lifetime Value Clv Ppt PowerPoint Presentation Show Icon
This is a calculating customer lifetime value clv ppt powerpoint presentation show icon. This is a five stage process. The stages in this process are average acquisition cost, average customer revenue, average customer costs, average customer profit, customer retention rate.

Financials Base Plan Ppt PowerPoint Presentation Portfolio Background Designs
This is a financials base plan ppt powerpoint presentation portfolio background designs. This is a four stage process. The stages in this process are revenue, cost of sales, gross profit, customer acquisition cost, other operating cost expense.
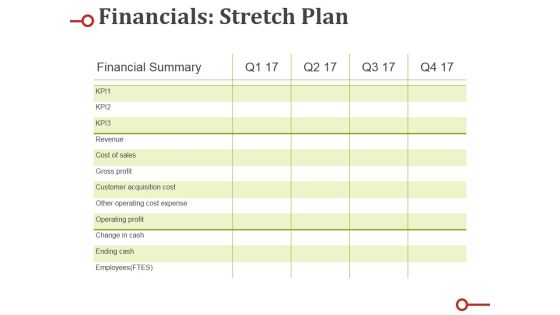
Financials Stretch Plan Ppt PowerPoint Presentation Show Designs Download
This is a financials stretch plan ppt powerpoint presentation show designs download. This is a four stage process. The stages in this process are revenue, cost of sales, gross profit, customer acquisition cost, other operating cost expense.

Financials Summary Base Plan Vs Stretch Plan Ppt PowerPoint Presentation Microsoft
This is a financials summary base plan vs stretch plan ppt powerpoint presentation microsoft. This is a three stage process. The stages in this process are revenue, cost of sales, gross profit, customer acquisition cost, other operating cost expense.

Competition Comparison Table Ppt PowerPoint Presentation Pictures File Formats
This is a competition comparison table ppt powerpoint presentation pictures file formats. This is a seven stage process. The stages in this process are revenue, profit, market share, main activity, number of employee, product quality.
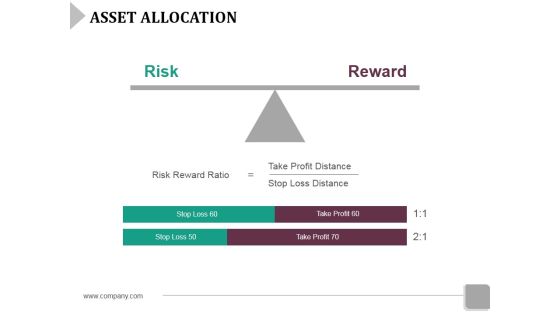
Asset Allocation Ppt PowerPoint Presentation Slides Structure
This is a asset allocation ppt powerpoint presentation slides structure. This is a two stage process. The stages in this process are risk, reward, stop loss, take profit, risk reward ratio.
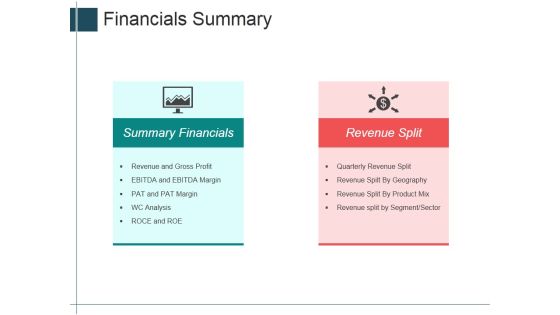
Financials Summary Ppt Powerpoint Presentation Inspiration Slides
This is a financials summary ppt powerpoint presentation inspiration slides. This is a two stage process. The stages in this process are summary financials, revenue split, icons, revenue and gross profit.
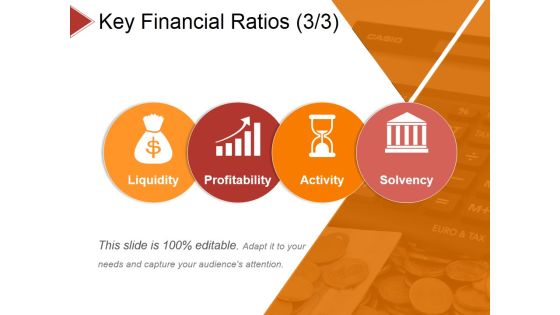
Key Financial Ratios Template 3 Ppt PowerPoint Presentation Summary Sample
This is a key financial ratios template 3 ppt powerpoint presentation summary sample. This is a four stage process. The stages in this process are liquidity, profitability, activity, solvency.
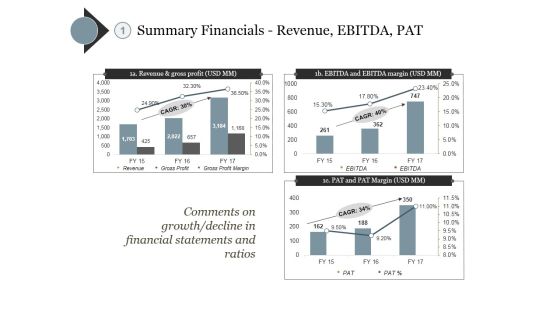
Summary Financials Revenue Ebitda Pat Ppt PowerPoint Presentation Model Clipart Images
This is a summary financials revenue ebitda pat ppt powerpoint presentation model clipart images. This is a three stage process. The stages in this process are revenue and gross profit, ebitda and ebitda margin, pat and pat margin.

Current State Analysis Financial Comparison Ppt Powerpoint Presentation File Graphic Tips
This is a current state analysis financial comparison ppt powerpoint presentation file graphic tips. This is a five stage process. The stages in this process are revenue, profits, cash balance.

Key Financial Ratios Template 3 Ppt PowerPoint Presentation Model Deck
This is a key financial ratios template 3 ppt powerpoint presentation model deck. This is a four stage process. The stages in this process are liquidity, profitability, activity, solvency.
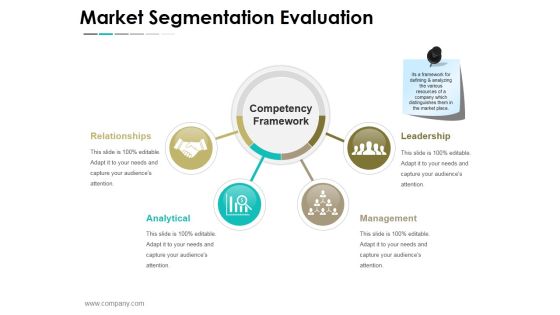
Market Segmentation Evaluation Ppt PowerPoint Presentation Layouts Images
This is a market segmentation evaluation ppt powerpoint presentation layouts images. This is a two stage process. The stages in this process are market sales, net profit, confectionary, milk products, beverages, nutrition and health care.

Competitor Analysis Ppt PowerPoint Presentation Professional Themes
This is a competitor analysis ppt powerpoint presentation professional themes. This is a six stage process. The stages in this process are revenue, profit, market share, main activity, number of employee, product quality.
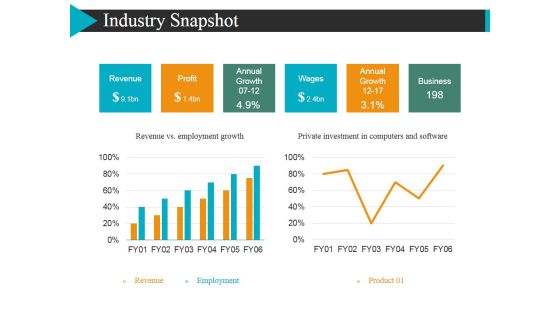
Industry Snapshot Template 2 Ppt Powerpoint Presentation Layouts Sample
This is a industry snapshot template 2 ppt powerpoint presentation layouts sample. This is a two stage process. The stages in this process are revenue, profit, annual growth, wages.
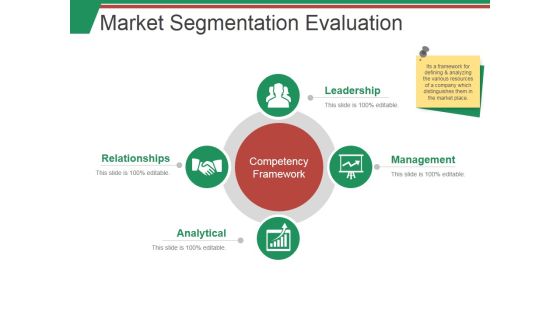
Market Segmentation Evaluation Template 1 Ppt PowerPoint Presentation Summary Smartart
This is a market segmentation evaluation template 1 ppt powerpoint presentation summary smartart. This is a two stage process. The stages in this process are market sales, net profit, beverages, milk product, nutrition.

Competitor Analysis Ppt PowerPoint Presentation Pictures Designs Download
This is a competitor analysis ppt powerpoint presentation pictures designs download. This is a six stage process. The stages in this process are revenue, profit, market share, main activity, number of employee, product quality.

Current State Analysis Financial Comparison Ppt PowerPoint Presentation Inspiration Good
This is a current state analysis financial comparison ppt powerpoint presentation inspiration good. This is a five stage process. The stages in this process are revenue, profits, cash balance, competitor.

Competitors Analysis Template Ppt PowerPoint Presentation Infographic Template Rules
This is a competitors analysis template ppt powerpoint presentation infographic template rules. This is a four stage process. The stages in this process are net profit margin, finance, marketing, bar, success.
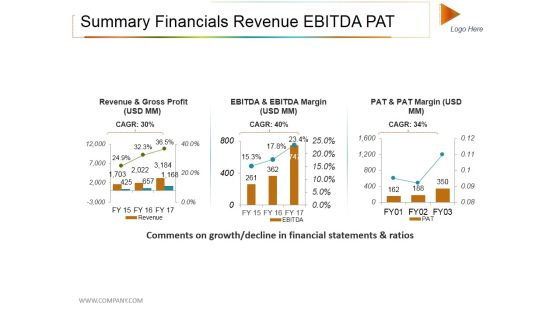
Summary Financials Revenue Ebitda Pat Ppt PowerPoint Presentation File Rules
This is a summary financials revenue ebitda pat ppt powerpoint presentation file rules. This is a three stage process. The stages in this process are revenue and gross profit, revenue, growth, success.
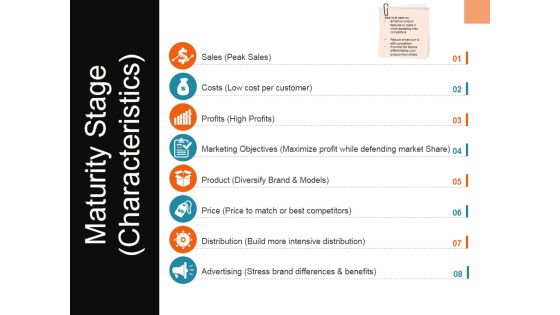
Maturity Stage Characteristics Ppt PowerPoint Presentation Slides Show
This is a maturity stage characteristics ppt powerpoint presentation slides show. This is a eight stage process. The stages in this process are sales, costs, profits, marketing objectives, product.

Competitor Analysis Ppt PowerPoint Presentation Outline Rules
This is a competitor analysis ppt powerpoint presentation outline rules. This is a seven stage process. The stages in this process are revenue, profit, market share, main activity, number of employee.

Competitor Analysis Ppt PowerPoint Presentation Show Infographics
This is a competitor analysis ppt powerpoint presentation show infographics. This is a seven stage process. The stages in this process are revenue, profit, market, share, main activity, number of employee.
Internet Marketing Objectives Ppt PowerPoint Presentation Icon Images
This is a internet marketing objectives ppt powerpoint presentation icon images. This is a six stage process. The stages in this process are sales, profit, product, repeat, sales, web.

Break Even Analysis Ppt PowerPoint Presentation Model File Formats
This is a break even analysis ppt powerpoint presentation model file formats. This is a two stage process. The stages in this process are cost, loss, break even point, profit, fixed costs.

Market Segmentation Evaluation Segment Size And Growth Potential Ppt PowerPoint Presentation Model
This is a market segmentation evaluation segment size and growth potential ppt powerpoint presentation model. This is a two stage process. The stages in this process are net profit, market sales, milk products, confectionary.

Consequences Of Poor Quality Ppt PowerPoint Presentation Portfolio Graphics Tutorials
This is a consequences of poor quality ppt powerpoint presentation portfolio graphics tutorials. This is a six stage process. The stages in this process are lost revenue, lost customers, increased costs, lower profits, lost productivity.

Consequences Of Poor Quality Ppt PowerPoint Presentation Gallery Layout Ideas
This is a consequences of poor quality ppt powerpoint presentation gallery layout ideas. This is a six stage process. The stages in this process are lost revenue, lost productivity, lower profits, lost customers, increased costs.

Consequences Of Poor Quality Ppt PowerPoint Presentation File Graphics
This is a consequences of poor quality ppt powerpoint presentation file graphics. This is a six stage process. The stages in this process are lost revenue, lost customers, increased costs, damaged brand, lower profits.
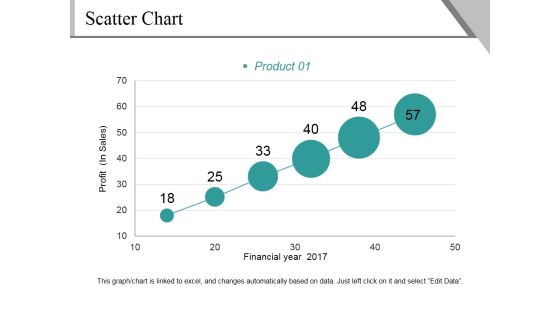
Scatter Chart Ppt PowerPoint Presentation File Background Image
This is a scatter chart ppt powerpoint presentation file background image. This is a six stage process. The stages in this process are profit, financial year, product, growth, success.

Break Even Analysis Ppt PowerPoint Presentation Portfolio Clipart
This is a break even analysis ppt powerpoint presentation portfolio clipart. This is a five stage process. The stages in this process are fixed cost, variable cost, sales revenue, profit, key comments on the table, units of output.

Comparison Based On Criteria Ppt PowerPoint Presentation Outline Pictures
This is a comparison based on criteria ppt powerpoint presentation outline pictures. This is a six stage process. The stages in this process are revenue, profit, market share, main activity, number of employee.

Comparison Based On Criteria Ppt PowerPoint Presentation Icon Example Introduction
This is a comparison based on criteria ppt powerpoint presentation icon example introduction. This is a six stage process. The stages in this process are criteria, revenue, profit, market share, main activity.
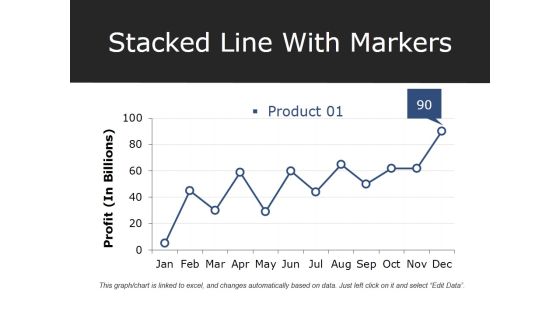
Stacked Line With Markers Ppt PowerPoint Presentation Professional Deck
This is a stacked line with markers ppt powerpoint presentation professional deck. This is a one stage process. The stages in this process are product, profit, growth, success, graph.
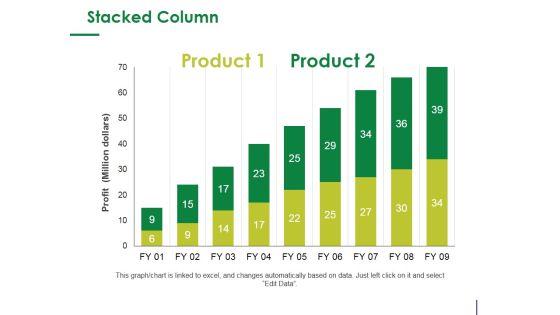
Stacked Column Ppt PowerPoint Presentation Infographic Template Design Ideas
This is a stacked column ppt powerpoint presentation infographic template design ideas. This is a two stage process. The stages in this process are product, profit, bar graph, growth, success.
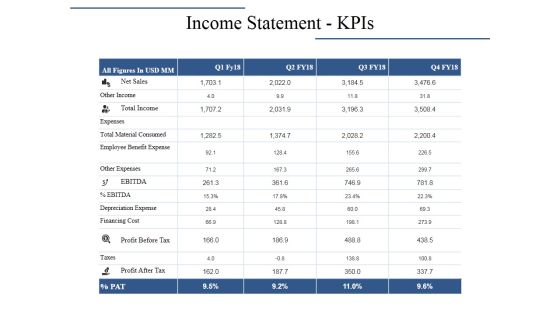
Income Statement Kpis Ppt PowerPoint Presentation Layouts Graphics Pictures
This is a income statement kpis ppt powerpoint presentation layouts graphics pictures. This is a four stage process. The stages in this process are net sales, total income, other income, profit before tax, expenses.

Sales Performance Dashboard Ppt PowerPoint Presentation Ideas Portfolio
This is a sales performance dashboard ppt powerpoint presentation ideas portfolio. This is a three stage process. The stages in this process are revenue, new customers, gross profit, customer satisfaction, sales comparison.

Sales Revenue Product Ppt PowerPoint Presentation Infographic Template Backgrounds
This is a sales revenue product ppt powerpoint presentation infographic template backgrounds. This is a three stage process. The stages in this process are product wise revenue, profit percent of total revenue, total income product.
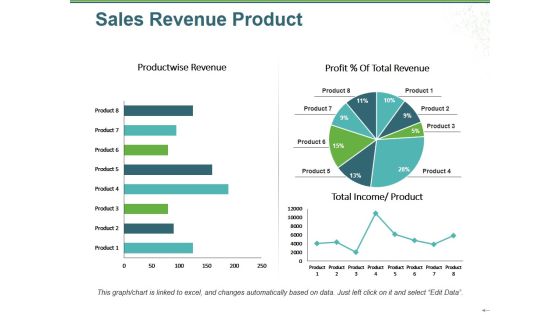
Sales Revenue Product Ppt PowerPoint Presentation Infographic Template Infographic Template
This is a sales revenue product ppt powerpoint presentation infographic template infographic template. This is a three stage process. The stages in this process are product wise revenue, total income, product, profit total revenue, pie.

Comparison Based On Criteria Ppt PowerPoint Presentation Slides Skills
This is a comparison based on criteria ppt powerpoint presentation slides skills. This is a five stage process. The stages in this process are revenue, profit, market share, main activity, number of employees, product quality.

Comparison Based On Criteria Ppt PowerPoint Presentation Show Outline
This is a comparison based on criteria ppt powerpoint presentation show outline. This is a six stage process. The stages in this process are revenue, profit, market share, main activity, number of employees.

Comparison Based On Criteria Ppt PowerPoint Presentation Show Graphics Pictures
This is a comparison based on criteria ppt powerpoint presentation show graphics pictures. This is a seven stage process. The stages in this process are competitor, revenue, profit, market share, main activity.
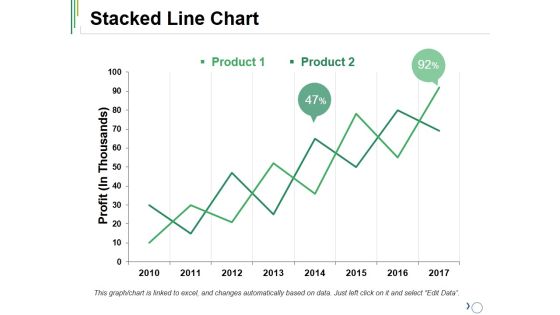
Stacked Line Chart Ppt PowerPoint Presentation Ideas Outfit
This is a stacked line chart ppt powerpoint presentation ideas outfit. This is a two stage process. The stages in this process are product, stacked line, profit, growth, success.

Comparison Based On Criteria Ppt PowerPoint Presentation Styles Picture
This is a comparison based on criteria ppt powerpoint presentation styles picture. This is a five stage process. The stages in this process are competitor, revenue, profit, criteria, market share.

Comparison Based On Criteria Ppt PowerPoint Presentation Infographic Template Layout Ideas
This is a comparison based on criteria ppt powerpoint presentation infographic template layout ideas. This is a seven stage process. The stages in this process are revenue, profit, market share, main activity, number of employees, product quality.

Comparison Based On Criteria Ppt PowerPoint Presentation Styles Designs
This is a comparison based on criteria ppt powerpoint presentation styles designs. This is a three stage process. The stages in this process are revenue, profit, market share, main activity, number of employees, product quality.

Pandl Kpis Ppt PowerPoint Presentation Gallery Display
This is a pandl kpis ppt powerpoint presentation gallery display. This is a four stage process. The stages in this process are net sales, total income, expenses, ebitda, profit after tax.


 Continue with Email

 Home
Home


